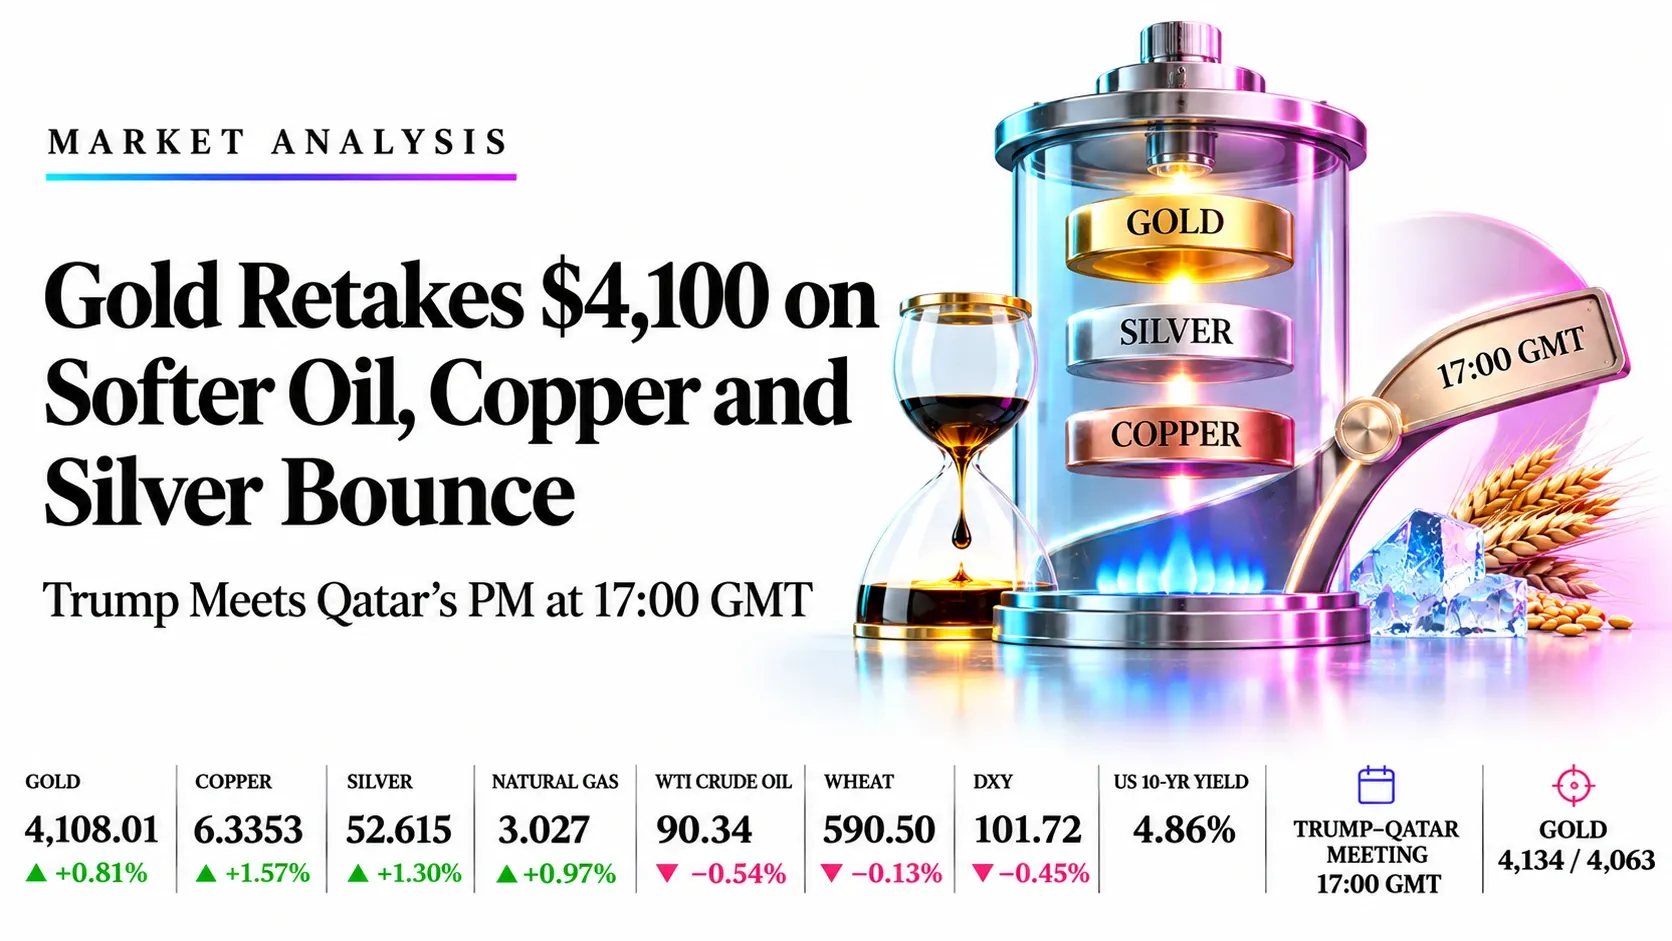
Gold Retakes $4,100 on Softer Oil, Copper and Silver Bounce, and Trump Meets Qatar’s PM at 17:00 GMT | Technical Analysis – Commodity Report | 09 Nov 2026
LIVE Commodities | Monday 9 November 2026 | 10:04 GMT snapshot, London session under way | Fed speakers from 13:40 GMT, Trump–Qatar meeting 17:00 GMT
Gold Retakes $4,100 on Softer Oil, Copper and Silver Bounce, and Trump Meets Qatar’s PM at 17:00 GMT
Market Overview
Metals are catching a bid while energy and grains lag: oil’s slide is easing inflation worries and the dollar index is down to 101.72 (−0.45%), lifting gold, silver, copper and natural gas, while WTI and wheat are lower. At the 10:04 GMT snapshot, Investing.com quotes copper at 6.3353 (+1.57%), silver at 52.615 (+1.30%), natural gas at 3.027 (+0.97%) and gold at 4,108.01 (+0.81%), against WTI at 90.34 (−0.54%) and December wheat near 590.50 (−0.13%). The US 10-year yield is near 4.86%, Asia’s tech rebound has lifted risk appetite even as Nvidia’s CEO probe keeps AI-linked stocks jumpy, and a December Fed hike is still priced near 80% after Friday’s 165,000 payrolls.
The rest of today decides whether the metals bounce holds. The US pit session opens at 13:20 GMT, Bowman speaks at 13:40 GMT and Goolsbee at 15:00 GMT, and Trump meets Qatar’s prime minister at 17:00 GMT on a new Iran ceasefire. Trump calls fresh strikes highly unlikely while Rubio calls the talks unproductive, so oil can flip in minutes. Wheat is the one stretched chart (RSI 23.16) with traders squaring up before USDA and the Abu Dhabi talks tomorrow, while RSI readings of 50.60, 41.59, 40.81, 53.61 and 41.14 show no other market stretched. Desk plan: buy dips in gold, silver, copper and natural gas, sell bounces in WTI, and treat wheat as a small, tight-stop bounce. This is a 10:04 GMT snapshot and the US session has not yet opened.
Key highlights
- Gold: Price 4,108 is above the 4,063 average and under the 4,191 and 4,199 averages; 4,134 caps and 4,063 is the floor.
- Copper: Price 6.3353 is bouncing off the channel floor under all three averages; 6.48 caps and 6.20 holds.
- Silver: Price 52.615 is under the 54.15 average with RSI 40.81; 53.46 caps and 51.40 supports.
- Natural gas: Price 3.027 is above all three averages (2.946 to 2.978); 3.092 caps and 2.95 holds.
- WTI: Price 90.34 is under the broken trendline and the 95.19 average; 91.42 caps and 89.29 supports.
- Wheat: Price near 590.50 with RSI 23.16 sits above the 564 channel floor; 595.50 caps and 585 holds.
What’s Moving Commodities Today
Gold retakes 4,100 as lower oil eases inflation worries, but a December Fed hike is still priced near 80%
Spot gold rose as much as 1.4% to 4,123.46 by 04:28 GMT as softer crude cooled inflation fears and the dollar slipped. US payrolls of 165,000 and unemployment at 4.1% lifted the December hike odds to about 81% from 71%, so KCM Trade’s Tim Waterer says hot inflation data would put gold back on the defensive.
Source: Reuters via Investing.com, FXEmpire, FinanceFeeds, 9 Nov 2026
Trump says new Iran strikes are “highly unlikely”, Rubio calls talks unproductive, and Trump meets Qatar’s prime minister at 17:00 GMT
Crude dipped at the open on Trump’s CNN comments, then recovered after Rubio said Iran’s demands were unacceptable. WTI has held 89.80 to 91.42 and Brent 96.57 to 98.43, after Iran said five tankers caught fire near Hormuz and a drone attack halted Iraq’s Khor Mor gas field. Qatar says talks are still alive.
Source: Reuters via Investing.com, investingLive, Newsquawk, 9 Nov 2026
The dollar index slips to 101.72 and risk appetite returns as Asian tech rebounds, though Nvidia’s CEO probe keeps AI-linked stocks jumpy
The Nikkei and Taiex rebounded sharply after the recent AI-led selloff, while Nvidia fell in Frankfurt after its board opened an investigation into CEO Jensen Huang. The US 10-year yield is near 4.86%. Bowman (13:40 GMT) and Goolsbee (15:00 GMT) are the next tests for the dollar.
Source: Reuters via Investing.com, Investing.com tickers, 9 Nov 2026
Copper bounces on tight China stocks and record import premiums even as Friday’s payrolls beat lifted the dollar
LME copper closed at 13,755.50 (−0.13%) overnight, and COMEX copper is up about 1.6% today. China’s October producer prices rose 5.7%, the fastest since June 2022, and Shanghai stocks sit near record lows, but high premiums are cutting downstream buying and the Shanghai spot premium eased 240 yuan to 2,100–2,650.
Source: SMM, Trading Economics, Reuters via Investing.com, 9 Nov 2026
Silver climbs to about 52.60 as the gold/silver ratio eases to 78.05
FXStreet had silver at 52.43 (+0.93%) at 09:30 GMT, after Reuters had shown spot up 2.8% at 53.31 at 02:20 GMT. Silver is still about 26% down on the year, so rallies have met resistance near 54.
Source: FXStreet, Reuters via Analytics Insight, Investing.com, 9 Nov 2026
Natural gas rises as colder forecasts through 20 November meet record 21.4 bcf/d of LNG feedgas
Commodity Weather Group sees cooler central and eastern US weather through 20 November, though NatGasWeather calls demand light today. Because of Veterans Day, the EIA storage report has moved to Friday 13 November, with an injection of 45–55 Bcf expected against a five-year average near 60–62 Bcf.
Source: FXEmpire, BNEF, Commodity Weather Group, 9 Nov 2026
Chicago wheat hovers near its lowest since mid-February with RSI near 22, as traders square up before USDA and the Abu Dhabi talks
December Chicago wheat settled Friday at 591.25 after dipping to 585.00, and European cash prices are at multi-month lows on Black Sea peace hopes. The USDA WASDE is due tomorrow at 17:00 GMT and the Russia–Ukraine–US talks start in Abu Dhabi on 10–11 November, so a fund short squeeze is possible if they stall.
Source: Teucrium Grains and Sugar Weekly, Grain Ledger, Reuters, Investing.com, 9 Nov 2026
Key Drivers for the Rest of Today
Six things that set direction for the rest of the session in gold, copper, silver, natural gas, WTI and wheat. All times are GMT.
- COMEX and NYMEX pit open
- 13:20
- Mon 9 Nov, 13:20 GMT
- Floor liquidity returns for gold, silver, copper, WTI and gas; the US session usually sets the day’s range
- Fed speakers
- 13:40
- Mon 9 Nov, 13:40 and 15:00 GMT
- Bowman (dovish voter) at 13:40 and Goolsbee (hawkish non-voter) at 15:00 react to payrolls; hawkish tones hit gold, silver and copper
- US data
- 15:00
- Mon 9 Nov, 15:00 and 16:00 GMT
- Wholesale inventories (forecast 0.6%) at 15:00; NY Fed consumer inflation expectations (3.8% forecast, 3.9% prior) at 16:00
- Trump meets Qatar’s PM
- 17:00
- Mon 9 Nov, 17:00 GMT
- New ceasefire and nuclear talks; a breakthrough sinks WTI toward 87.20, a stall squeezes it back toward 93.00
- CBOT grains close
- 19:20
- Mon 9 Nov, 19:20 GMT
- Last chance for wheat position-squaring before tomorrow’s 17:00 GMT WASDE and the Abu Dhabi talks
- Setup expiry and daily close
- 21:00
- Mon 9 Nov, 21:00 and 22:00 GMT
- Unfilled ideas lapse at 21:00 GMT; daily candles close at 22:00 GMT
Swipe the strip to see every driver.
Trade Setups for Today
Ranked in the order gold, copper, silver, natural gas, WTI and wheat, valid until 21:00 GMT today. A 4-hour close beyond the stop cancels the idea.
| Instrument | Direction | Entry | Stop | Target 1 | Target 2 | Reward:risk | Conviction |
|---|---|---|---|---|---|---|---|
| Gold (XAUUSD) | Long | 4,075 | 4,038 | 4,134 | 4,148 | 1.6 / 2.0 | Medium |
| Copper (HG) | Long | 6.26 | 6.17 | 6.40 | 6.48 | 1.6 / 2.4 | Low |
| Silver (XAGUSD) | Long | 51.80 | 50.90 | 53.46 | 54.15 | 1.8 / 2.6 | Low |
| Natural Gas (NG) | Long | 2.980 | 2.910 | 3.092 | 3.124 | 1.6 / 2.1 | Medium |
| WTI Crude Oil (USOIL) | Short | 92.00 | 93.30 | 90.20 | 89.30 | 1.4 / 2.1 | Low |
| Wheat (ZW) | Long | 586.00 | 580.00 | 595.50 | 600.00 | 1.6 / 2.3 | Low |
Reward:risk is the distance from entry to each target divided by the distance from entry to the stop. A third target for each market is in its section below. Headline prices are Investing.com quotes; levels come from the daily charts at about 10:04 GMT. Gold, silver, WTI and gas levels are read straight from the charts (Investing.com differs by under 0.3%, though gold futures run about 9 dollars above the spot chart), while copper and wheat levels are shifted to the Investing.com basis because those chart feeds print about 0.076 higher (copper) and about 11 cents higher (March wheat). Every entry sits away from the current price and needs a pullback or a bounce to trigger, and the Fed speakers and the 17:00 GMT Qatar meeting can gap prices through them. Five ideas are long and one is short, and gold, silver and copper all lean on a softer dollar, so a hawkish Goolsbee at 15:00 GMT would hit three at once. Levels are conditional technical references, not recommendations.
Risk Scenario Analysis
Fed speakers from 13:40 GMT and the Trump–Qatar meeting at 17:00 GMT are the swing factors for the rest of today.
If Fed speakers sound hawkish or the Qatar talks stall, yields and oil rise and metals give back the bounce
Goolsbee backing a December hike, or a failed Qatar meeting that lifts Brent, would firm the dollar and yields. Gold, silver and copper would fall back, WTI and gas would bounce, and wheat would slip with no war premium to lean on.
- Gold4,063, then 4,000
- Copper6.20, then 6.00
- Silver51.40, then 50.00
- Natural Gas3.092, then 3.124
- WTI91.42, then 93.00
- Wheat585.00, then 564.00
If tones turn dovish or Qatar reports progress, the dollar and oil slide and metals extend
A dovish Bowman, cautious Goolsbee and ceasefire progress would deepen the dollar’s slide and ease inflation fears. Gold, silver and copper would test their overhead averages, WTI would break 89.29, and wheat would bounce off its oversold floor.
- Gold4,134, then 4,148
- Copper6.40, then 6.48
- Silver53.46, then 54.15
- Natural Gas2.98, then 2.95
- WTI89.29, then 87.20
- Wheat595.50, then 600.00
Gold (XAU/USD) | Investing.com quote, TVC chart feed
Gold Analysis: Price Holds Above 4,100 After Breaking Out of Its Falling Channel, With the 4,191 Average the Next Cap
4,108.01 +33.11 (+0.81%) on Investing.com Gold Futures Previous close 4,074.90 | TVC chart feed 4,099.01 at 10:04 GMT
Outlook: Bias is higher on dips while 4,063 holds. Gold is up on softer oil, a weaker dollar (index 101.72, −0.45%) and easing inflation worries, even with a December Fed hike priced near 80% after Friday’s 165,000 payrolls. Reuters had spot at 4,123.46 earlier, so 4,134 is the first test.

Key levels
- Support 2
- 4,000
- Support 1
- 4,063
- Resistance 1
- 4,134
- Resistance 2
- 4,191
- Price (4,099) is above the 4,063.02 average and under the 4,191.30 and 4,199.23 averages. Main catalysts: Bowman at 13:40 GMT and Goolsbee at 15:00 GMT moving Treasury yields, and any oil swing from the Trump–Qatar meeting at 17:00 GMT.
- RSI 50.60 over its 40.36 average: momentum has turned up from oversold. A close above 4,134 targets 4,148 (the 5 November high) and 4,191; a close under 4,054 puts the channel back in play and 4,000 in sight.
Setup: Long at 4,075, stop 4,038, targets 4,134, 4,148 and 4,191. Reward:risk 1.6 / 2.0 / 3.1, medium conviction. Cancel if a 4-hour close under 4,038, or if Goolsbee’s tone lifts yields and the dollar through Friday’s highs. Cancel if unfilled by 21:00 GMT today.
Copper (COMEX HG) | Investing.com quote, Capital.com chart feed
Copper Analysis: Bounce Off the Channel Floor Meets Tight China Stocks, but Every Average Overhead Still Caps
6.3353 +0.0978 (+1.57%) on Investing.com Copper Futures Previous close 6.2375 | Capital.com chart feed 6.41165 (+1.15%)
Outlook: Bias is higher on dips but conviction is low while price stays under all three averages. Copper is up 1.57% as the dollar eases and China’s physical market stays tight: Shanghai stocks sit near record lows and import premiums are at records, though the Shanghai spot premium fell 240 yuan to 2,100–2,650 today.

Key levels
- Support 2
- 6.00
- Support 1
- 6.20
- Resistance 1
- 6.48
- Resistance 2
- 6.56
- Price (6.3353) is under all three averages (6.48, 6.51, 6.56). Main catalysts: dollar and US yields from the 13:40 and 15:00 GMT Fed speakers, and Nasdaq swings, since copper is trading as an AI-capex proxy. LME copper closed at 13,755.50 (−0.13%).
- RSI 41.59 under its 44.88 average: bounce without confirmation. A close above 6.48 opens 6.56; a close under 6.20 breaks the channel floor and targets 6.00.
Setup: Long at 6.26, stop 6.17, targets 6.40, 6.48 and 6.56. Reward:risk 1.6 / 2.4 / 3.3, low conviction. Cancel if a 4-hour close under 6.17, or if Nasdaq slides again and drags the AI-capex trade lower. Cancel if unfilled by 21:00 GMT today.
Silver (XAG/USD) | Investing.com quote, TVC chart feed
Silver Analysis: Rebound Off the Channel Floor Stalls Under the 54.15 Average as the Gold/Silver Ratio Eases to 78
52.615 +0.673 (+1.30%) on Investing.com Silver Futures Previous close 51.942 | TVC chart feed 52.604 (+1.35%)
Outlook: Bias is higher on dips with low conviction. Silver follows gold up on lower oil and a softer dollar, and FXStreet puts the gold/silver ratio at 78.05, down from 78.27 on Friday. It remains about 26% lower on the year and well under the longer averages.

Key levels
- Support 2
- 48.90
- Support 1
- 51.40
- Resistance 1
- 53.46
- Resistance 2
- 54.15
- Price (52.615) is under the 54.15, 59.73 and 60.60 averages. Main catalysts: gold’s reaction to the 13:40 and 15:00 GMT Fed speakers and industrial sentiment from copper.
- RSI 40.81 over its 33.68 average: momentum is lifting off oversold. A close above 54.15 targets 54.80; a close under 51.40 sends price back toward the 48.90 channel floor.
Setup: Long at 51.80, stop 50.90, targets 53.46, 54.15 and 54.80. Reward:risk 1.8 / 2.6 / 3.3, low conviction. Cancel if a 4-hour close under 50.90, or if gold loses 4,063. Cancel if unfilled by 21:00 GMT today.
Natural Gas (NYMEX Henry Hub) | Investing.com quote, NYMEX chart feed
Natural Gas Analysis: Price Reclaims Three Averages as Colder Forecasts and Record LNG Feedgas Meet a Mild Start Today
3.027 +0.029 (+0.97%) on Investing.com Natural Gas Futures Previous close 2.998 | NYMEX chart feed 3.021 (+0.77%)
Outlook: Bias is higher on dips while 2.95 holds. December gas is up on colder central and eastern US forecasts through 20 November (Commodity Weather Group) and record LNG feedgas of 21.4 bcf/d (BNEF), though NatGasWeather still sees light demand today and a developing Super El Niño caps deferred contracts.

Key levels
- Support 2
- 2.830
- Support 1
- 2.950
- Resistance 1
- 3.092
- Resistance 2
- 3.241
- Price (3.021) is above all three averages (2.946 to 2.978). Main catalysts: forecast revisions from NOAA and Commodity Weather Group, and energy-complex moves from the Trump–Qatar meeting. The EIA storage report has moved to Friday 13 November because of Veterans Day.
- RSI 53.61 over its 44.73 average: momentum has flipped positive. A close above 3.092 targets 3.124 and 3.241; a close under 2.95 puts 2.83 in play.
Setup: Long at 2.980, stop 2.910, targets 3.092, 3.124 and 3.241. Reward:risk 1.6 / 2.1 / 3.7, medium conviction. Cancel if a 4-hour close under 2.91, or if forecast models turn warmer. Cancel if unfilled by 21:00 GMT today.
WTI Crude Oil (USOIL) | Investing.com quote, TVC chart feed
WTI Crude Oil Analysis: Price Sits Under the Broken Trendline as Trump’s “Unlikely” Meets Rubio’s “Unproductive”, With Qatar Talks at 17:00 GMT
90.34 −0.49 (−0.54%) on Investing.com WTI Futures Previous close 90.83 | TVC chart feed 90.36 | Brent 97.38
Outlook: Bias is lower on bounces while 93.00 caps, but conviction is low because the Qatar meeting is a binary event. Oil dipped at the open when Trump told CNN fresh strikes were highly unlikely, then recovered when Rubio called the talks unproductive; WTI has held 89.80 to 91.42 and ship attacks near Hormuz limit the downside.

Key levels
- Support 2
- 87.20
- Support 1
- 89.29
- Resistance 1
- 91.42
- Resistance 2
- 93.00
- Price (90.34) is under the 95.19 and 97.27 averages and above the 87.20 average. Main catalysts: Trump meets Qatar’s prime minister at 17:00 GMT on a new ceasefire, plus Hormuz shipping attacks and the halt at Iraq’s Khor Mor gas field.
- RSI 41.14 under its 54.24 average: momentum is soft. A close under 89.29 targets 87.20; a 4-hour close above 93.00 ends the bearish case and reopens 95.19.
Setup: Short at 92.00, stop 93.30, targets 90.20, 89.30 and 87.20. Reward:risk 1.4 / 2.1 / 3.7, low conviction. Cancel if a 4-hour close above 93.30, or if the Qatar meeting yields a ceasefire headline that spikes risk premium back in. Cancel if unfilled by 21:00 GMT today.
US Wheat (CBOT) | Investing.com quote, SelfInvest CFD chart feed
Wheat Analysis: Deeply Oversold Price Sits Near the Floor of a Falling Channel as Traders Square Up Before Tomorrow’s WASDE and Abu Dhabi Talks
590.50 −0.75 (−0.13%) on Investing.com US Wheat (Dec, cents per bushel) Previous close 591.25 | March CFD chart feed 601.5 (−0.26%)
Outlook: Bias is a small oversold bounce while 585 holds, with low conviction because the trend is still down. December Chicago wheat closed Friday at its lowest since mid-February, with the 14-day RSI near 22 and funds heavily short; the Russia–Ukraine–US talks in Abu Dhabi on 10–11 November are keeping the war premium out of the market.

Key levels
- Support 2
- 564.00
- Support 1
- 585.00
- Resistance 1
- 595.50
- Resistance 2
- 609.00
- Price (590.50) is under all three averages. Main catalysts: pre-WASDE position squaring (USDA report tomorrow at 17:00 GMT), Black Sea headlines, and the CBOT close at 19:20 GMT. Friday’s intraday low was 585.00.
- RSI 23.16 under its 25.62 average: the most oversold reading in this report. A close above 595.50 targets 600 and 609; a close under 585 targets the 564 channel floor.
Setup: Long at 586.00, stop 580.00, targets 595.50, 600.00 and 609.00. Reward:risk 1.6 / 2.3 / 3.8, low conviction. Cancel if a 4-hour close under 580, or if Abu Dhabi headlines point to a Black Sea reopening. Cancel if unfilled by 21:00 GMT today.
Conclusion
Oil’s slide and a softer dollar are lifting metals while a December Fed hike is still priced near 80%, so we prefer buying dips in gold near 4,075 (medium conviction), natural gas near 2.980 (medium), and copper near 6.26, silver near 51.80 and wheat near 586 (low), and selling a bounce in WTI near 92.00 (low). The session risks are the Fed speakers at 13:40 and 15:00 GMT, Trump’s meeting with Qatar’s PM at 17:00 GMT and the CBOT close at 19:20 GMT. A 4-hour close under 4,038 in gold or above 93.30 in WTI would change the picture.
Trade gold, copper, silver, natural gas, WTI and wheat with Capital Street FX.
Frequently Asked Questions
What is the commodities outlook for today?
Metals are firmer on softer oil and a weaker dollar, WTI and wheat are lower, and natural gas is up on colder forecasts. Fed speakers at 13:40 and 15:00 GMT and the Trump–Qatar meeting at 17:00 GMT are the main scheduled tests for gold, silver, copper, natural gas, WTI and wheat.
Which commodity trade ideas are live today?
Long gold, copper, silver and natural gas on dips, short WTI on a bounce, and a small long in oversold wheat, each with a stop and three targets valid until 21:00 GMT.
What time are the key events in GMT?
The COMEX and NYMEX pit opens at 13:20 GMT, Bowman speaks at 13:40, Goolsbee and US wholesale inventories follow at 15:00, NY Fed inflation expectations are at 16:00, Trump meets Qatar’s PM at 17:00, CBOT grains close at 19:20, setups expire at 21:00 and daily candles close at 22:00 GMT.
Why is gold back above 4,100 today?
Lower oil eased inflation worries and the dollar index slipped to 101.72, which helped non-yielding gold even though a December Fed hike is still priced near 80%. Hawkish Fed comments are the main risk.
Why is wheat so oversold?
Chicago wheat is near its lowest since mid-February with RSI at 23.16, as peace-talk hopes remove the Black Sea war premium and funds sit heavily short. That sets up a sharp bounce if Abu Dhabi stalls, but the trend is still down.