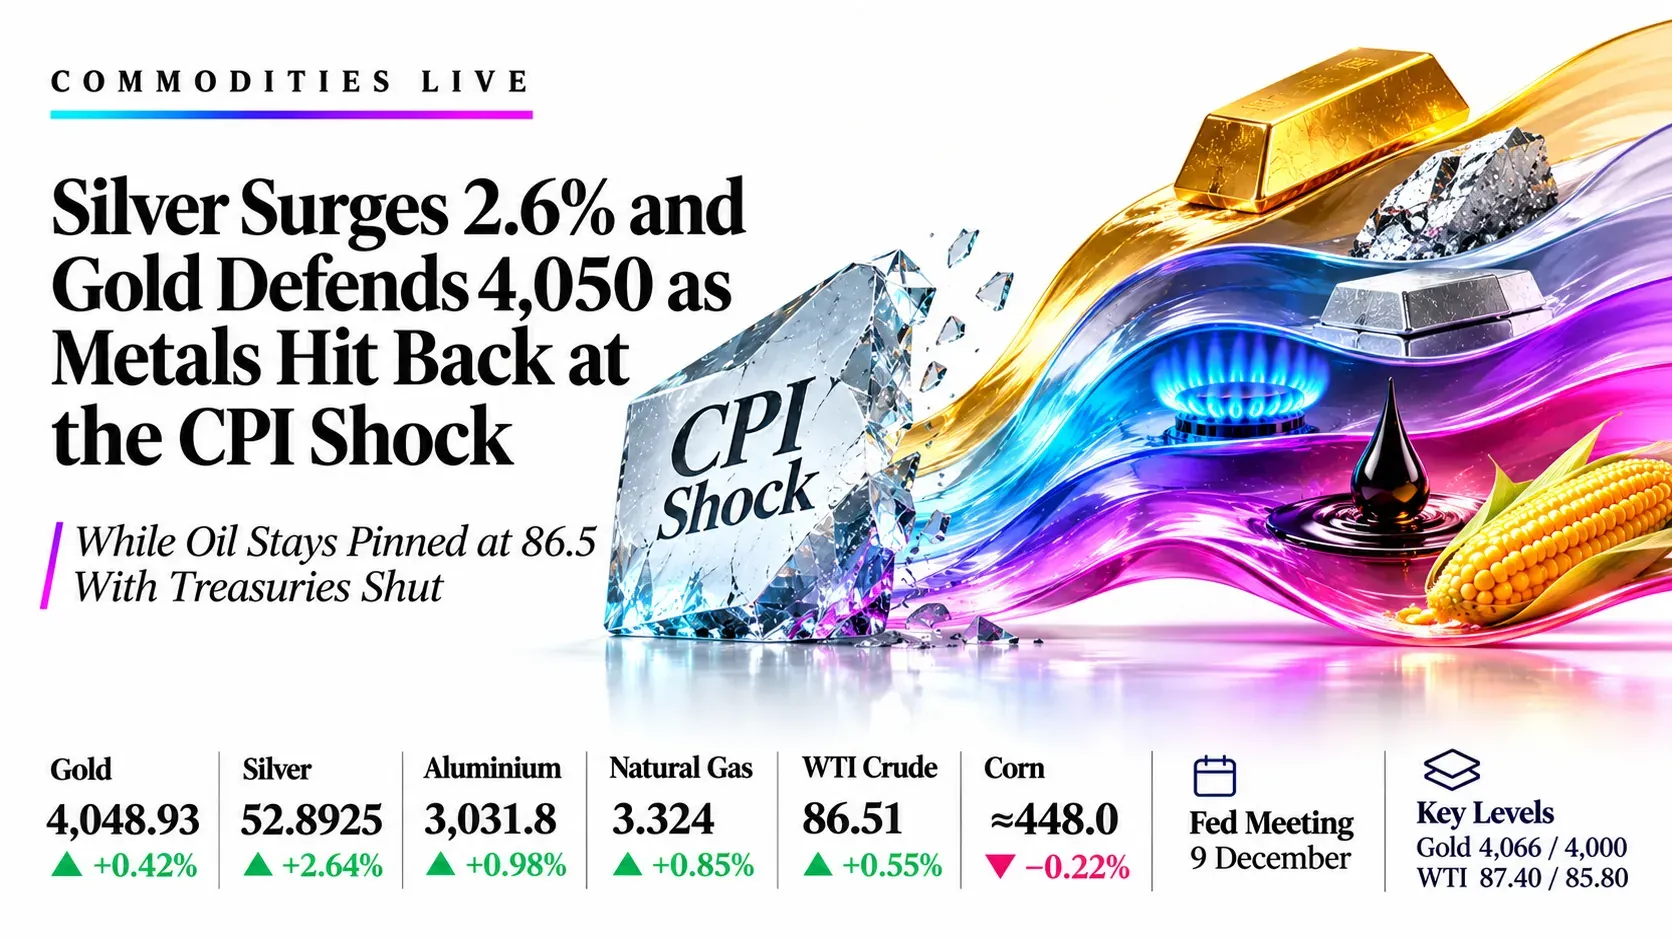
Silver Surges 2.6% and Gold Defends 4,050 as Metals Hit Back at the CPI Shock, While Oil Stays Pinned at 86.5 With Treasuries Shut | Technical Analysis – Comodity Report | 11-11-2026
LIVE Commodities | Wednesday 11 November 2026 | 09:40 GMT snapshot, London session under way | US Treasuries shut for Veterans Day, no US data
Silver Surges 2.6% and Gold Defends 4,050 as Metals Hit Back at the CPI Shock, While Oil Stays Pinned at 86.5 With Treasuries Shut
Market Overview
Metals are hitting back at Tuesday’s hot-CPI shock, with silver leading the charge, but a December Fed hike is now fully priced and the US Treasury market is shut for Veterans Day, so every move today is thin, fast and easy to overshoot. Silver is up 2.64% at 52.8925, gold is up 0.42% at 4,048.93 after Tuesday’s 2.6% plunge, aluminium has bounced 0.98% to 3,031.8 and natural gas is holding a three-week high at 3.324 (+0.85%). Crude is the weak link: WTI sits at 86.51, close to a two-month low, and corn is consolidating near 448.0 (−0.22%) after a bullish WASDE.
The damage came from October CPI, which printed +0.4% headline and +0.3% core against +0.3% and +0.2% expected. The dollar index jumped 0.6% to about 102.25, the 10-year yield touched 5%, and CME FedWatch now shows about an 89% chance of a 25 basis point hike on 9 December, with 11% to 15% for 50 basis points depending on the source.
With no top-tier US data, three things decide the rest of the session: Iran and Hormuz headlines, the dollar, and the US stock open at 14:30 GMT. Trump has signalled restraint on Iran, but Iran’s Mohsen Rezaei says no talks are under way and tanker attacks in Hormuz continue, while API showed a 9.0 million barrel US crude build. RSI readings of 47.08, 45.37, 43.69, 64.62, 36.56 and 51.95 show no stretched market except natural gas. Desk plan: buy dips in gold, aluminium, silver, natural gas and corn, and sell bounces in WTI. This is a 09:40 GMT snapshot, taken ahead of the US open at 14:30 GMT.
- Gold
- 4,048.93
- +0.42% | floor 4,000
- Defending the line after a 2.6% CPI drop
- Silver
- 52.8925
- +2.64% | cap 53.67
- Top performer; gold/silver ratio 76.5
- Aluminium
- 3,031.8
- +0.98% | cap 3,075
- Bounce capped by China export supply
- Natural Gas
- 3.324
- +0.85% | cap 3.350
- Three-week high, RSI 64.62 near overbought
- WTI Crude
- 86.51
- +0.55% | cap 87.40
- Near a two-month low; the one short idea
- Corn
- ≈448.0
- −0.22% | cap 456
- Digesting the bullish WASDE
Key highlights
- Gold: Price 4,048.93 is just under the 4,055.76 average; 4,066 caps and 4,000 is the floor.
- Aluminium: Price 3,031.8 sits on the 3,033.10 average inside a falling wedge; 3,075 caps and 2,985 holds.
- Silver: Price 52.8925 is under the 53.67 average with RSI 43.69; 53.67 caps and 51.50 supports.
- Natural gas: Price 3.324 is above all three averages (2.951 to 2.998) with RSI 64.62; 3.350 caps and 3.22 holds.
- WTI: Price 86.51 is under the broken trendline and the 87.40 average; 87.40 caps and 85.80 supports.
- Corn: Price near 448.0 (Investing.com basis) is above the broken channel; 456 caps and 441 holds.
What’s Moving Commodities Today
Gold steadies near 4,050 after a 2.6% CPI-driven drop, with a December Fed hike fully priced
Spot gold was near 4,040 to 4,050 on Wednesday after Tuesday’s fall, when October CPI rose 0.4% on the month against 0.3% expected and core rose 0.3% against 0.2%. December futures settled at 4,030.20 after a 4,156.20 high, and $4,000 is the support traders are watching. Waller said he would back 50 basis points if core inflation stays near 0.3% a month, and CME FedWatch shows about an 89% chance of 25 basis points and 11% for 50 for the 9 December meeting.
Source: FinanceFeeds citing Investing.com and FXStreet, Kitco, Babypips, CNBC, 11 Nov 2026
Silver jumps 2.6% to about 52.9 even as yields rise, and the gold/silver ratio falls to 76.5
FXStreet had silver at 52.92 at 09:30 GMT against 51.52 on Tuesday, and the gold/silver ratio fell to 76.52 from 78.25. The rebound came even though the 10-year Treasury yield is near 5% and the dollar index rose 0.6% to about 102.25 on Tuesday. Silver is still down about 25.5% this year, and Goodreturns flags the 51.50 to 52.00 zone as immediate support.
Source: FXStreet, Goodreturns, Rio Times, 11 Nov 2026
LME aluminium bounces 0.9% to 3,035.50 after a three-week low, but China exports and a firm dollar cap the move
Shanghai aluminium fell 1.6% to 22,795 yuan, an 11-month low, as China’s January to October exports of aluminium and products rose 18% to 5.9 million tons. Marex’s Ed Meir called the trade data a “stunning contribution to global supply”, while falling LME stocks lifted the nearby premium over the three-month price. Aluminium is down about 21% since reaching a four-year high in June.
Source: Reuters via Mining.com and XLB News, 10 to 11 Nov 2026
Natural gas holds a three-week high near 3.3 on near-record LNG feedgas and falling output
Reuters said front-month gas rose to 3.224 on Tuesday on cooler late-November forecasts, record LNG plant flows and lower output, which fell to a five-month daily low of 109.7 bcfd. The front month was overbought for a second straight day, and the storage surplus has shrunk from 7.7% above normal in April to about 1% in mid-October. The EIA storage report has moved to Friday 13 November because of Veterans Day, with a 45 to 55 Bcf injection expected.
Source: Reuters via Business Recorder, FXEmpire, 11 Nov 2026
WTI rebounds from a two-month low near 86.5 as Hormuz attacks offset US restraint on Iran, while API shows a 9.0 million barrel build
Brent rose 0.78% to 92.20 and WTI 0.57% to 86.53 at 01:19 GMT after Tuesday’s settles of 91.49 and 86.04, the lowest since 31 August; Reuters later had Brent at 92.53 (+1.1%) and WTI at 86.71 (+0.8%), after Brent had dipped to 89.16 on Tuesday. Iran’s Mohsen Rezaei said no talks are under way, and tanker attacks in the Strait of Hormuz continue: 37 vessels were attacked in October, the most of the war, with 10 more in November so far. API data showed a 9.0 million barrel crude build against a 1.0 million barrel draw expected (one outlet first listed it as a draw, but three reports carry the build), and the EIA report is due Thursday.
Source: Reuters via BigGo Finance, USO News and Grafa, CNBC, FinanceFeeds, Tradingpedia, OilPrice, 11 Nov 2026
Corn digests a bullish WASDE as USDA cuts the yield to 179.6 and ending stocks to 1.758 billion bushels
USDA lowered the 2026/27 corn yield to 179.6 bushels per acre from 181.2 (trade average 180.5) and production to 15.893 billion bushels, down 141 million, while raising exports 25 million bushels. Ending stocks fell to 1.758 billion from 1.849 billion and the season-average price was cut 10 cents to $4.60. CBOT corn rose about 12 cents after the report, then slipped 0.2% to 4.4825 by 05:05 GMT on Wednesday.
Source: DTN, Ohio’s Country Journal, American Ag Network, Reuters via Business Recorder, 10 to 11 Nov 2026
Key Drivers for the Rest of Today
Six things that set direction for the rest of the session in gold, aluminium, silver, natural gas, WTI and corn. All times are GMT.
- Iran and Hormuz headlines
- Live
- Wed 11 Nov, all session
- Trump’s restraint against Rezaei’s denial of talks and tanker attacks; moves WTI first, then corn and gas
- US stocks open
- 14:30
- Wed 11 Nov, 14:30 GMT
- Equities trade but the Treasury market is shut for Veterans Day, so yield moves in gold and silver can be thin
- LBMA Gold Price PM
- 15:00
- Wed 11 Nov, 15:00 GMT
- London afternoon benchmark; a common point for gold and silver to react to the dollar
- COMEX metals settlement
- 18:30
- Wed 11 Nov, 18:30 GMT
- Gold and silver settle; the US metals session is quiet with no US data today
- CBOT corn close and NYMEX settlement
- 19:20
- Wed 11 Nov, 19:20 and 19:30 GMT
- CBOT grains close at 19:20 GMT; NYMEX crude and gas settle at 19:30 GMT
- Setup expiry and daily close
- 21:00
- Wed 11 Nov, 21:00 and 22:00 GMT
- Unfilled ideas lapse at 21:00 GMT and daily candles close at 22:00 GMT; Thursday brings jobless claims and six Fed speakers
Swipe the strip to see every driver.
Trade Setups for Today
Ranked in the order gold, aluminium, silver, natural gas, WTI and corn, valid until 21:00 GMT today. A 4-hour close beyond the stop cancels the idea.
| Instrument | Direction | Entry | Stop | Target 1 | Target 2 | Reward:risk | Conviction |
|---|---|---|---|---|---|---|---|
| Gold (XAUUSD) | Long | 4,030 | 3,995 | 4,100 | 4,150 | 2.0 / 3.4 | Low |
| Aluminium (ALIUSD) | Long | 3,005 | 2,965 | 3,075 | 3,129 | 1.8 / 3.1 | Low |
| Silver (XAGUSD) | Long | 52.00 | 50.90 | 53.67 | 54.60 | 1.5 / 2.4 | Low |
| Natural Gas (NG) | Long | 3.240 | 3.160 | 3.350 | 3.400 | 1.4 / 2.0 | Low |
| WTI Crude Oil (USOIL) | Short | 87.30 | 88.60 | 85.00 | 84.00 | 1.8 / 2.5 | Medium |
| Corn (ZC) | Long | 441.0 | 435.0 | 452.0 | 456.0 | 1.8 / 2.5 | Low |
Reward:risk is the distance from entry to each target divided by the distance from entry to the stop. A third target for each market is in its section below. Levels come from the daily charts captured at 09:37 to 09:39 GMT (15:07 to 15:09 UTC+5:30). Gold, silver, WTI and gas levels are read straight from the TVC and NYMEX chart feeds, aluminium levels from the Capital.com feed (within about 5 of the LME three-month price) and corn levels are shifted about 10 lower to the Investing.com CBOT December basis, because the Skilling feed prints above it. Every entry sits away from the current price and needs a pullback or a bounce to trigger, and thin Treasury trading can gap prices through them. Five ideas are long and one is short; gold, silver and aluminium all lean on a softer dollar, so a firmer dollar would hit three at once. Levels are conditional technical references, not recommendations.
Risk Scenario Analysis
The dollar and Iran and Hormuz headlines are the swing factors for the rest of today.
If yields and the dollar push higher or Hormuz attacks escalate, metals give back the bounce and oil rises
Hawkish Fed talk or a firmer dollar would pressure gold, silver and aluminium, while a Hormuz setback would revive the oil premium and lift gas and corn with it.
- Gold4,000, then 3,950
- Aluminium2,985, then 2,950
- Silver51.50, then 50.00
- Natural Gas3.350, then 3.400
- WTI88.60, then 91.84
- Corn452, then 456
If the dollar eases and Iran de-escalation holds, metals extend the rebound and oil is offered
A softer dollar would let gold, silver and aluminium test their overhead averages, WTI would break 85.00, corn would fade with crude, and gas would give back part of its squeeze because it follows weather rather than oil.
- Gold4,100, then 4,150
- Aluminium3,075, then 3,129
- Silver53.67, then 54.60
- Natural Gas3.240, then 3.160
- WTI85.00, then 84.00
- Corn441, then 437
Gold (XAU/USD) | Investing.com quote, TVC chart feed
Gold Analysis: Price Holds 4,050 After the 2.6% CPI Drop, Pinned Just Under the 4,056 Average With 4,000 the Line to Defend
4,048.93 +16.96 (+0.42%) on the TVC spot feed Previous close 4,031.97 | Investing.com spot about 4,049 | Range 4,026.70 to 4,066.93 | Tuesday December futures settle 4,030.20
Outlook: Bias is higher on dips with low conviction while 4,000 holds. Gold fell about 2.6% on Tuesday after October CPI printed +0.4% headline and +0.3% core, which made a 25 basis point December hike fully priced, and it is steadying as the dollar index (about 102.25) pauses. With the Treasury market closed, yield-driven moves can be thin and gappy. A hold above 4,056 opens 4,100 to 4,150; a close under 4,000 points to 3,950.

Key levels
- Support 2
- 3,950
- Support 1
- 4,000
- Resistance 1
- 4,066
- Resistance 2
- 4,150
- Price (4,048.93) is under the 4,055.76 average and well under the 4,178.19 and 4,196.33 averages. Main catalysts: Iran and Hormuz headlines, the US stock open at 14:30 GMT and the dollar index near 102.25. Waller has said he would back 50 basis points if core inflation stays near 0.3% a month.
- RSI 47.08 over its 41.60 average: momentum is turning up from oversold. A close above 4,066 targets 4,100 and 4,150; a close under 4,000 puts 3,950 in sight.
Setup: Long at 4,030, stop 3,995, targets 4,100, 4,150 and 4,178. Reward:risk 2.0 / 3.4 / 4.2, low conviction. Cancel if a 4-hour close under 3,995, or if the dollar index and yields break to fresh highs. Cancel if unfilled by 21:00 GMT today.
Aluminium (LME 3M) | Investing.com basis, Capital.com chart feed
Aluminium Analysis: Bounce Stalls on the 3,033 Average Inside a Falling Wedge as China Exports and a Firm Dollar Cap It
3,031.8 +29.5 (+0.98%) on the Capital.com CFD feed Previous close 3,002.3 | LME three-month 3,035.50 (+0.9%) at 07:00 GMT | Range 3,016.3 to 3,045.6 | Tuesday close 3,006.50
Outlook: Bias is higher on dips with low conviction, and a close under 2,985 would turn it lower. Aluminium is bouncing from a three-week low, but China’s January to October exports rose 18% to 5.9 million tons, SHFE aluminium hit an 11-month low near 22,795 yuan and the dollar is near a two-week high. Falling LME stocks and a nearby premium over the three-month price give the dip some support.

Key levels
- Support 2
- 2,950
- Support 1
- 2,985
- Resistance 1
- 3,075
- Resistance 2
- 3,129
- Price (3,031.8) is level with the 3,033.10 average and under the 3,129.20 and 3,156.70 averages. Main catalysts: the dollar, Chinese export and SHFE headlines, and LME stocks (226,975 tons on 9 November, down 625). Aluminium is down about 21% since its June four-year high.
- RSI 45.37 on its 45.39 average: momentum is flat. A close above 3,075 opens 3,129; a close under 2,985 puts the wedge floor near 2,925 back in play.
Setup: Long at 3,005, stop 2,965, targets 3,075, 3,129 and 3,157. Reward:risk 1.8 / 3.1 / 3.8, low conviction. Cancel if a 4-hour close under 2,965, or if SHFE makes a fresh low on more export headlines. Cancel if unfilled by 21:00 GMT today.
Silver (XAG/USD) | Investing.com quote, TVC chart feed
Silver Analysis: Price Jumps 2.6% Off the Channel Floor and Presses the 53.67 Average as the Gold/Silver Ratio Drops to 76.5
52.8925 +1.3600 (+2.64%) on the TVC spot feed Previous close 51.5325 | FXStreet 52.92 at 09:30 GMT | Range 51.445 to 53.188
Outlook: Bias is higher on dips with low conviction. Silver is leading the rebound even though yields rose after CPI, helped by the 51.50 to 52.00 support zone and a gold/silver ratio that fell to 76.5 from 78.25 on Tuesday. It is still down about 25% this year and far under its longer averages near 59.2 and 60.3, so rallies need to clear 53.67 first.

Key levels
- Support 2
- 50.00
- Support 1
- 51.50
- Resistance 1
- 53.67
- Resistance 2
- 54.60
- Price (52.8925) is under the 53.67 average and well under the 59.22 and 60.34 averages. Main catalysts: gold, the dollar and thin Treasury trading. The gold/silver ratio is about 76.5 (4,048.93 divided by 52.8925).
- RSI 43.69 over its 34.51 average: momentum has turned up from oversold but stays weak. A close above 53.67 opens 54.60; a close under 51.50 puts 50.00 and the channel floor back in play.
Setup: Long at 52.00, stop 50.90, targets 53.67, 54.60 and 56.00. Reward:risk 1.5 / 2.4 / 3.6, low conviction. Cancel if a 4-hour close under 50.90, or if gold loses 4,000. Cancel if unfilled by 21:00 GMT today.
Natural Gas (NYMEX NG) | Investing.com quote, NYMEX chart feed
Natural Gas Analysis: Price Pushes Above the Channel Top Near 3.30 on Record LNG Feedgas, With RSI 64.62 Near Overbought
3.324 +0.028 (+0.85%) on NYMEX December futures Previous close 3.296 | Reuters December 3.224 earlier on Tuesday | Range 3.281 to 3.341
Outlook: Bias is higher on dips with low conviction after a three-week high. Reuters says gas held near that high on cooler late-November forecasts, near-record LNG flows and Lower 48 output of 112.2 bcfd so far in November (a five-month daily low of 109.7 bcfd on Tuesday). The front month was technically overbought for a second day, and the weekly EIA storage report has moved to Friday 13 November because of Veterans Day.

Key levels
- Support 2
- 3.100
- Support 1
- 3.220
- Resistance 1
- 3.350
- Resistance 2
- 3.400
- Price (3.324) is above all three averages (2.998, 2.963 and 2.951). Main catalysts: weather model runs, LNG feedgas, the output drop and the EIA storage report on Friday (45 to 55 Bcf expected against a five-year average near 60 to 62).
- RSI 64.62 over its 49.10 average: momentum is firm but near overbought. A close above 3.35 opens 3.40 and 3.50; a close under 3.22 hands back the breakout and targets 3.10.
Setup: Long at 3.240, stop 3.160, targets 3.350, 3.400 and 3.500. Reward:risk 1.4 / 2.0 / 3.3, low conviction. Cancel if a 4-hour close under 3.16, or if the next forecast run turns milder. Cancel if unfilled by 21:00 GMT today.
WTI Crude Oil | Investing.com quote, TVC chart feed
WTI Crude Oil Analysis: Price Rebounds From a Two-Month Low but Stays Under the Broken Trendline and the 87.40 Average
86.51 +0.47 (+0.55%) on the TVC WTI feed against Tuesday’s 86.04 settle Chart-feed previous close 86.43 (+0.09%) | Range 85.81 to 87.05 | Brent January about 92.2
Outlook: Bias is lower on bounces with medium conviction while WTI stays under 87.40. Oil bounced from its lowest level since 31 August as Hormuz tanker attacks offset US restraint on Iran, but Iran’s Mohsen Rezaei says no talks are under way. API reported a 9.0 million barrel US crude build against a 1.0 million barrel draw expected, and WTI is still about 20% under its late-October peak.

Key levels
- Support 2
- 84.00
- Support 1
- 85.80
- Resistance 1
- 87.40
- Resistance 2
- 88.60
- Price (86.51) is under the 87.40 average and the broken trendline, and far under the 95.02 and 96.22 averages. Main catalysts: Iran and Hormuz headlines, the API build and the EIA report, which has moved to Thursday 12 November because of the holiday.
- RSI 36.56 under its 50.51 average: momentum is weak but not yet oversold. A close under 85.80 targets 84.00 and 82.50; a close above 88.60 would cancel the bearish view and open 91.84.
Setup: Short at 87.30, stop 88.60, targets 85.00, 84.00 and 82.50. Reward:risk 1.8 / 2.5 / 3.7, medium conviction. Cancel if a 4-hour close above 88.60, or if a Hormuz escalation sends Brent back through 94. Cancel if unfilled by 21:00 GMT today.
Corn (CBOT ZC) | Investing.com basis, Skilling chart feed
Corn Analysis: Price Holds Above the Broken Channel After a Bullish WASDE, With Yield Cut to 179.6 and Stocks Down to 1.758 Billion Bushels
≈448.0 −0.22% CBOT December, Investing.com basis (estimated) Previous close ≈449.0 | Reuters CBOT corn 448.25 (−0.2%) at 05:05 GMT | Skilling chart feed 458.19 (−1.01)
Outlook: Bias is higher on dips with low conviction. USDA cut the 2026/27 corn yield to 179.6 bushels per acre from 181.2 (the trade expected 180.5), trimmed production to 15.893 billion bushels and lowered ending stocks to 1.758 billion from 1.849 billion, and corn rose about 12 cents on Tuesday. It is consolidating that gain, and grains are taking direction from crude oil.

Key levels
- Support 2
- 437
- Support 1
- 441
- Resistance 1
- 456
- Resistance 2
- 459
- Price (about 448.0) is above the 437.0 average and under the 458.8 and 466.6 averages on the Investing.com basis. Main catalysts: crude oil, the CBOT close at 19:20 GMT and follow-through from the WASDE. USDA also cut the season-average farm price by 10 cents to $4.60.
- RSI 51.95 over its 33.20 average: momentum has turned up from oversold. A close above 456 opens 459 and 466; a close under 437 puts the channel breakout in doubt.
Setup: Long at 441, stop 435, targets 452, 456 and 459 (Investing.com basis, add about 10 for the Skilling feed). Reward:risk 1.8 / 2.5 / 3.0, low conviction. Cancel if a 4-hour close under 435, or if crude oil slides again. Cancel if unfilled by 21:00 GMT today.
Conclusion
Metals are rebounding after the CPI shock while a December hike is fully priced and Treasuries are closed, so we prefer buying dips: gold near 4,030, aluminium near 3,005, silver near 52.00, natural gas near 3.240 and corn near 441 (all low conviction), and selling a bounce in WTI near 87.30 (medium). The session risks are Iran and Hormuz headlines, the US stock open at 14:30 GMT, COMEX settlement at 18:30, the CBOT close at 19:20 and the NYMEX settlement at 19:30 GMT. A 4-hour close under 3,995 in gold or above 88.60 in WTI would change the picture.
Trade gold, aluminium, silver, natural gas, WTI and corn with Capital Street FX.
Frequently Asked Questions
What is the commodities outlook for today?
Gold, silver and aluminium are bouncing after Tuesday’s hot-CPI sell-off, natural gas is at a three-week high, WTI is steadying near 86.5 and corn is consolidating after a bullish WASDE. With no top-tier US data and the Treasury market closed, Iran and Hormuz headlines are the main swing factor.
Which commodity trade ideas are live today?
Long gold, aluminium, silver, natural gas and corn on dips, and short WTI on a bounce, each with a stop and three targets valid until 21:00 GMT.
What time are the key events in GMT?
US stocks open at 14:30 GMT, the LBMA Gold Price PM is at 15:00, COMEX metals settle at 18:30, CBOT grains close at 19:20, NYMEX crude and gas settle at 19:30, setups expire at 21:00 and daily candles close at 22:00 GMT. The EIA oil report is Thursday 12 November and gas storage is Friday 13 November.
Why did gold fall on Tuesday?
October CPI rose 0.4% on the month and core 0.3%, both above forecasts, which made a December Fed hike fully priced, lifted the dollar index to about 102.25 and pushed the 10-year yield near 5%.
Why is corn higher after the WASDE?
USDA cut the corn yield to 179.6 bushels per acre from 181.2, which lowered production and ending stocks to 1.758 billion bushels from 1.849 billion. The trade had expected a smaller cut to stocks, so the report was read as bullish.