Nvidia’s CEO exit drags the Hang Seng down 1.26% and caps the Nasdaq 100, while Europe hits record highs ahead of US PPI | Technical Analysis – Index Report | 12 Nov 2026
LIVE Indices | Thursday 12 November 2026 | Updated 17:26 GMT
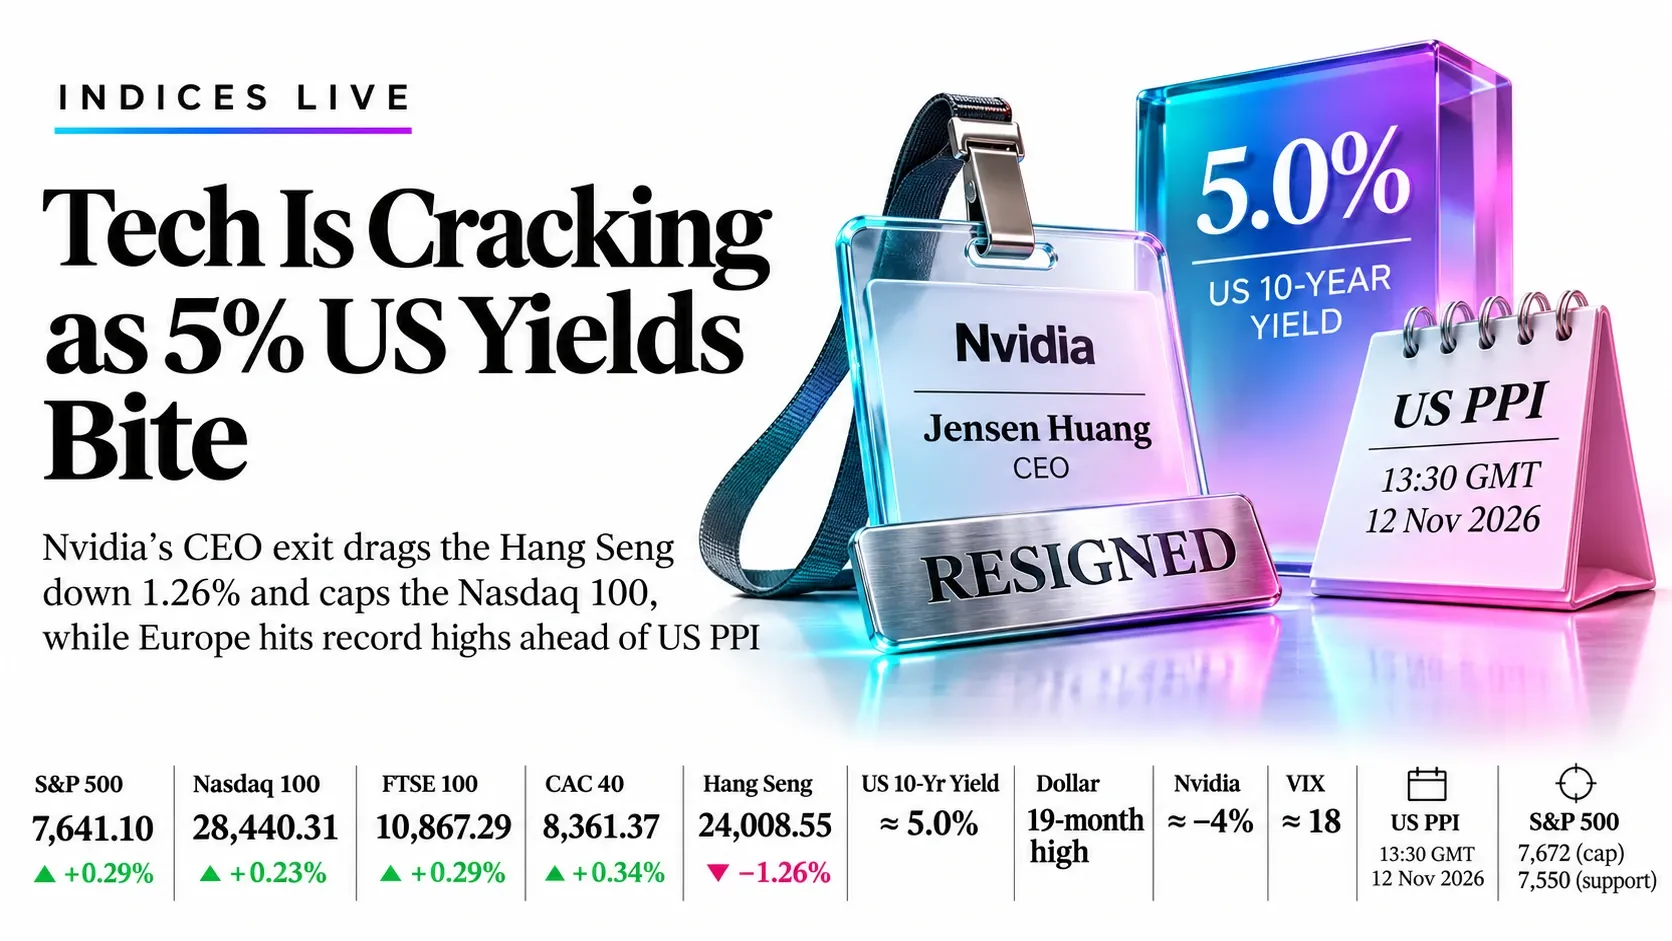
Tech Is Cracking as 5% US Yields BiteNvidia’s CEO exit drags the Hang Seng down 1.26% and caps the Nasdaq 100, while Europe hits record highs ahead of US PPI
Nvidia’s CEO has resigned, the US 10-year yield is back above 5% and the dollar is at a 19-month high. The Hang Seng has lost four sessions running while the FTSE 100 and CAC 40 sit near records, and Friday’s US PPI is the next hard test for every trade below.
Market Overview
Global equities have split in two: tech is cracking while defensive Europe sprints to records. Nvidia’s CEO Jensen Huang has resigned, the US 10-year yield is back above 5% and the dollar sits at a 19-month high. The Hang Seng has now lost four sessions in a row (−1.26% to 24,008.55) and the Nasdaq 100 (28,440.31) is still under all three averages, while the FTSE 100 (10,867.29, +0.29%) and CAC 40 (8,361.37, +0.34%) hold near record highs. Wall Street has clawed back its opening losses: at 17:26 GMT the S&P 500 was 7,641.10 (+0.29%) and Nvidia had pared its drop to about 4%.
The next test is Friday: US PPI at 13:30 GMT, the 14:30 GMT US open and Daly at 17:00 GMT will decide whether dip buyers or the yield bulls win. RSI readings are 50.44 in the S&P 500, 46.55 in the Nasdaq 100, 57.90 in the FTSE 100, 70.05 in the CAC 40 and 49.57 in the Hang Seng. Desk plan: sell bounces in the S&P 500, Nasdaq 100 and Hang Seng, and buy dips in the FTSE 100 and CAC 40. Nvidia reports quarterly results on 17 November, so headline risk stays high. The Friday session has not opened, so setups assume a pullback or bounce to the entries.
Key highlights
- S&P 500: Price 7,641.10 (17:26 GMT) sits just above its two short averages with RSI 50.44 from the chart capture; 7,672 caps and 7,550 supports.
- Nasdaq 100: Price 28,440.31 is under all three averages with RSI 46.55; 28,658 caps and 27,900 supports.
- FTSE 100: Price 10,867.29 is above all three averages with RSI 57.90; 11,000 caps and 10,750 supports.
- CAC 40: Price 8,361.37 is above all averages with RSI 70.05; 8,402 caps and 8,240 supports.
- Hang Seng: Price 24,008.55 is under two averages with RSI 49.57; 24,320 caps and 23,740 supports.
Market Pulse
Where each index stands now. The dot shows price inside its day range; Europe and Hong Kong are at final closes.
S&P 500 SPX · live 17:26 GMT
7,641.10
+21.72 (+0.29%)Prev 7,619.38
Dip buyers erased the Huang-exit selloff; 7,672 caps the bounce.
Decision zoneNasdaq 100 NDX · 16:47 GMT capture
28,440.31
+66.05 (+0.23%)Prev 28,374.26
Still under all three averages inside a falling channel.
Under averagesFTSE 100 UKX · closed
10,867.29
+31.82 (+0.29%)Prev 10,835.47
Above every average, under 1% from the 11,000 wedge top.
Dip-buy biasCAC 40 PX1 · closed
8,361.37
+28.49 (+0.34%)Prev 8,332.88
Channel breakout, but RSI 70 calls for a pullback entry.
OverboughtHang Seng HSI · closed
24,008.55
−307.37 (−1.26%)Prev 24,315.92
Fourth straight loss as Alibaba fell 6.7% and Tencent 2.6%.
Sell bounces- US 10-year yield
- ≈ 5.0%
- Dollar
- 19-month high
- Nvidia
- ≈ −4%
- VIX
- ≈ 18
What’s Moving Indices Now
Nvidia’s leadership crisis hits the Nasdaq and Hong Kong tech as CEO Huang’s exit rattles the AI trade
Nvidia fell roughly 5% to 8% as Jensen Huang’s ouster followed a board meeting and an inquiry reported by AFP; the stock has lost about 24% in a month. Wall Street futures slid about 0.5% before the open, then indices recovered as dip buyers stepped in; the VIX stayed near 18. Nvidia reports quarterly results on 17 November.
Source: Reuters via Yahoo Finance, AFP via Channels TV, Yahoo Finance, 12 Nov 2026
US 10-year yield touches 5% and the dollar hits a 19-month high on Fed rate-rise bets
Reuters reported Treasury yields at 5% again and the dollar at its strongest since April 2025. A hot October CPI and Waller’s view that 50 basis points should be considered keep a December hike in play for the 8 to 9 December meeting, pressuring long-duration tech and Asian property.
Source: Reuters via Yahoo Finance, Finwire market recap, 10 to 12 Nov 2026
S&P 500 rebounds from 7,551 to 7,641 after Wednesday’s 1.3% rally to 7,619.38
The S&P 500 opened lower and traded between 7,550.84 and 7,652.76 while the Nasdaq Composite settled Wednesday at 25,466.19 after a 1.6% rise. CoreWeave reversed about 13.6% after a 27% gain, showing how fast AI sentiment is swinging.
Source: Yahoo Finance, Investrade, Eurasia Business News, 12 Nov 2026
Hang Seng falls 1.26% to 24,008.55 for a fourth straight loss; Hang Seng Tech sinks 2.36%
Alibaba fell about 6.7% and Tencent 2.6% on concerns that Washington may restrict Chinese access to offshore datacentres with advanced chips. Gold and copper stocks also fell with metals, and southbound inflows were not enough to lift the index.
Source: BigGo Finance, Reuters, The Standard, 12 Nov 2026
European stocks hit record highs as defensive mix and earnings offset the Nvidia shock
The STOXX 600 set a record, the DAX rose about 1% to a new high, the CAC 40 gained roughly 0.5% to 0.7% and the FTSE 100 about 0.3%. Easing Middle East tension and strong earnings supported the region, which has less AI exposure than the US or Asia.
Source: Reuters, Investing.com, ADVFN, 12 Nov 2026
US producer prices at 13:30 GMT and three Fed speakers are the next tests for rate-hike pricing
Economists expect October PPI at +0.4% month on month after +1.3% in September. Collins speaks at 14:10 GMT, Bowman at 15:50 GMT and Daly at 17:00 GMT; Eurozone Q3 GDP (second estimate) is also due.
Source: Finwire recap, FXEmpire, ZeroHedge, Investing.com calendar, 13 Nov 2026
Key Drivers for Friday’s Session
Six things that set direction in the S&P 500, Nasdaq 100, FTSE 100, CAC 40 and Hang Seng. All times are GMT.
- Hong Kong open
- 01:30
- Fri 13 Nov, 01:30 GMT
- Hang Seng tries to hold 24,000 after four straight losses; Alibaba and Tencent set the tone
- Europe open
- 08:00
- Fri 13 Nov, 08:00 GMT
- FTSE 100 and CAC 40 start near record territory; Eurozone Q3 GDP follows at 10:00 GMT
- US PPI (October)
- 13:30
- Fri 13 Nov, 13:30 GMT
- Consensus +0.4% m/m after +1.3%; a hot print lifts yields and hits the Nasdaq 100 and S&P 500
- US equity open
- 14:30
- Fri 13 Nov, 14:30 GMT
- Nvidia and AI names drive the first hour; Collins speaks at 14:10 and Bowman at 15:50 GMT
- Daly speaks
- 17:00
- Fri 13 Nov, 17:00 GMT
- Support for faster hikes would extend the dollar and yield rally into the close
- Setup expiry and daily close
- 21:00
- Fri 13 Nov, 21:00 and 22:00 GMT
- Unfilled ideas lapse at 21:00 GMT and daily candles close at 22:00 GMT
Swipe the strip to see every driver.
Trade Setups for Friday’s Session
Ranked S&P 500, Nasdaq 100, FTSE 100, CAC 40, Hang Seng, valid until 21:00 GMT on Friday 13 Nov. A 4-hour close beyond the stop cancels the idea.
| Instrument | Direction | Entry | Stop | Target 1 | Target 2 | Reward:risk | Conviction |
|---|---|---|---|---|---|---|---|
| S&P 500 | Short | 7,672 | 7,730 | 7,600 | 7,550 | 1.2 / 2.1 | Medium |
| Nasdaq 100 | Short | 28,660 | 29,050 | 28,000 | 27,200 | 1.7 / 3.7 | Medium |
| FTSE 100 | Long | 10,760 | 10,670 | 10,880 | 10,950 | 1.3 / 2.1 | Medium |
| CAC 40 | Long | 8,245 | 8,150 | 8,400 | 8,500 | 1.6 / 2.7 | Medium |
| Hang Seng | Short | 24,320 | 24,650 | 23,740 | 23,400 | 1.8 / 2.8 | Medium |
Reward:risk is the distance from entry to each target divided by the distance from entry to the stop. A third target for each index is in its section below. Levels come from the daily charts captured at 16:46 to 16:48 GMT on 12 November (SP, NASDAQ, FTSE, TVC and HSI feeds). Every entry sits away from the current price and needs a pullback or bounce to trigger, and the 13:30 GMT PPI release can gap prices through them. Three ideas are short (S&P 500, Nasdaq 100, Hang Seng) and two are long (FTSE 100, CAC 40), so a hot PPI would help the shorts while a soft print would help the longs. Levels are conditional technical references, not recommendations.
Risk Scenario Analysis
US PPI at 13:30 GMT, the 14:30 GMT US open and Daly at 17:00 GMT are the swing factors for today.
If PPI is hot and Nvidia headlines worsen, yields and the dollar rise and tech slides
A PPI above +0.4% or hawkish words from Daly would lift December hike pricing and push the 10-year yield above 5%, pressuring the Nasdaq 100 and the Hang Seng most. Europe would hold up better but the CAC 40 would test its 8,241 average.
- S&P 5007,550, then 7,520
- Nasdaq 10028,000, then 27,200
- FTSE 10010,754, then 10,700
- CAC 408,241, then 8,150
- Hang Seng23,740, then 23,400
If PPI is soft and Nvidia stabilises, yields ease and dip buyers lift risk assets
A softer PPI would trim rate-hike odds and let the S&P 500 and Nasdaq 100 clear their averages, while a clean Hong Kong open above 24,320 would test the 24,600 line. Europe would extend toward records.
- S&P 5007,672, then 7,750
- Nasdaq 10028,658, then 29,380
- FTSE 10010,950, then 11,000
- CAC 408,402, then 8,500
- Hang Seng24,320, then 24,600
S&P 500 (SPX) | SP chart feed, index points
S&P 500 Analysis: Index Recovers to Its Averages After the Nov 5 Break, but 7,672 Caps the Bounce
7,641.10 +21.72 (+0.29%) at 17:26 GMT Previous close 7,619.38 | Range 7,550.84 to 7,652.76
Outlook: Bias is lower on bounces with medium conviction. The S&P 500 opened near 7,551 on Nvidia’s CEO turmoil, then recovered to 7,641 as dip buyers returned after Wednesday’s 1.3% rally to 7,619.38. With the US 10-year yield touching 5% and the dollar at a 19-month high, the index is stuck under the 7,672 average and the underside of its broken channel.

Key levels
- Support 2
- 7,350
- Support 1
- 7,550
- Resistance 1
- 7,672
- Resistance 2
- 7,750
- Price (7,641.10 at 17:26 GMT) is above the 7,620.18 and 7,624.34 averages and under 7,671.99, so this is a decision zone. Catalysts: US PPI at 13:30 GMT, the 14:30 GMT US open and Daly at 17:00 GMT.
- RSI 50.44 over its 45.00 average: momentum is neutral and turning up. A close under 7,550 reopens 7,520 and the early-November low near 7,350; a close above 7,672 puts the short on hold and targets 7,750.
Setup: Short at 7,672, stop 7,730, targets 7,600, 7,550 and 7,520. Reward:risk 1.2 / 2.1 / 2.6, medium conviction. Cancel if a 4-hour close above 7,730, or if the US 10-year yield falls back under 4.90% after PPI. Cancel if unfilled by 21:00 GMT on Friday 13 Nov.
Nasdaq 100 (NDX) | NASDAQ chart feed, index points
Nasdaq 100 Analysis: Bounce From the 26,550 Low Meets Channel Resistance While Nvidia’s Leadership Crisis Keeps Tech Fragile
28,440.31 +66.05 (+0.23%) on the chart feed Previous close 28,374.26 | Range 27,940.58 to 28,548.55
Outlook: Bias is lower on bounces with medium conviction. The Nasdaq 100 trades 28,440 after a swing from 27,941 to 28,549 as Nvidia fell about 5% to 6% on the Huang exit news, and the index remains under all three averages inside a falling channel from late September. Yields near 5% add pressure to long-duration tech.

Key levels
- Support 2
- 26,550
- Support 1
- 27,900
- Resistance 1
- 28,658
- Resistance 2
- 29,380
- Price (28,440.31) is under all three averages (28,658.06, 29,380.76 and 29,539.74) and about 1,900 points above the channel floor near 26,550. Catalysts: PPI at 13:30 GMT, the 14:30 GMT open and Nvidia headlines.
- RSI 46.55 over its 39.65 average: momentum is recovering but still below 50. A close under 27,900 targets 27,200; a close above 28,658 breaks the channel top and opens 29,380.
Setup: Short at 28,660, stop 29,050, targets 28,000, 27,200 and 26,550. Reward:risk 1.7 / 3.7 / 5.4, medium conviction. Cancel if a 4-hour close above 29,050, or if Nvidia stabilises and semiconductors lead a squeeze after the open. Cancel if unfilled by 21:00 GMT on Friday 13 Nov.
FTSE 100 (UKX) | FTSE chart feed, index points
FTSE 100 Analysis: Index Holds Above Its Averages Near 10,870 and Presses the Top of a Four-Month Wedge
10,867.29 +31.82 (+0.29%) on the chart feed Previous close 10,835.47 | Range 10,820.61 to 10,886.06
Outlook: Bias is higher on dips with medium conviction. The FTSE 100 closed at 10,867.29 with Europe at record highs as strong earnings, easing Middle East tension and a defensive, low-tech mix offset the Nvidia shock. The index is above the 10,754, 10,704 and 10,694 averages and trades under 1% from the 11,000 wedge top.

Key levels
- Support 2
- 10,480
- Support 1
- 10,750
- Resistance 1
- 10,950
- Resistance 2
- 11,000
- Price (10,867.29) is above the averages (10,753.54, 10,703.72 and 10,693.88) and 380 points above the wedge floor near 10,480. Catalysts: Eurozone GDP at 10:00 GMT, US PPI at 13:30 GMT and a firm dollar.
- RSI 57.90 over its 52.94 average: momentum is bullish and not stretched. A close above 11,000 breaks the wedge top; a close under 10,700 cancels the dip-buy and targets 10,480.
Setup: Long at 10,760, stop 10,670, targets 10,880, 10,950 and 11,000. Reward:risk 1.3 / 2.1 / 2.7, medium conviction. Cancel if a 4-hour close below 10,670, or if sterling spikes after the open. Cancel if unfilled by 21:00 GMT on Friday 13 Nov.
CAC 40 (PX1) | TVC chart feed, index points
CAC 40 Analysis: Breakout From the Falling Channel Carries Price to 8,361, but RSI 70 Calls for a Pullback Entry
8,361.37 +28.49 (+0.34%) on the chart feed Previous close 8,332.88 | Range 8,339.06 to 8,401.72
Outlook: Bias is higher on dips with medium conviction. The CAC 40 trades 8,361.37 after breaking out of the August to October falling channel, lifted by the European record-high session and strong earnings. RSI has reached 70.05, so chasing here is poor value and the plan is to buy a pullback toward the 8,241 average.

Key levels
- Support 2
- 8,025
- Support 1
- 8,240
- Resistance 1
- 8,400
- Resistance 2
- 8,600
- Price (8,361.37) is above all three averages (8,241.49, 8,027.02 and 8,026.82) and 120 points over the 100-day line. Catalysts: Eurozone GDP at 10:00 GMT, PPI at 13:30 GMT and the US open at 14:30 GMT.
- RSI 70.05 over its 58.24 average: momentum is strong and overbought, so a dip is likely before any push through 8,402. A close under 8,150 cancels the long and exposes 8,027.
Setup: Long at 8,245, stop 8,150, targets 8,400, 8,500 and 8,600. Reward:risk 1.6 / 2.7 / 3.7, medium conviction. Cancel if a 4-hour close below 8,150, or if unfilled by 21:00 GMT. Cancel if unfilled by 21:00 GMT on Friday 13 Nov.
Hang Seng Index (HSI) | HSI chart feed, index points
Hang Seng Analysis: Index Clings to 24,000 After a Fourth Straight Loss as Alibaba’s 6.7% Slide and a 5% US Yield Hit Tech
24,008.55 −307.37 (−1.26%) on the chart feed Previous close 24,315.92 | Range 23,942.74 to 24,132.20
Outlook: Bias is lower on bounces with medium conviction. The Hang Seng closed at 24,008.55, down 1.26% for a fourth straight loss and just above 24,000, with the Hang Seng Tech Index down 2.36% to 3,931.93. Alibaba fell about 6.7% and Tencent 2.6% on fears that Washington could curb Chinese access to offshore datacentres with advanced Nvidia chips.

Key levels
- Support 2
- 23,000
- Support 1
- 23,740
- Resistance 1
- 24,320
- Resistance 2
- 24,600
- Price (24,008.55) is under two averages (24,316.15 and 24,597.29) and 266 points above the 23,742 line. Catalysts: the 01:30 GMT Hong Kong open, Nvidia and US-China chip headlines and US PPI at 13:30 GMT.
- RSI 49.57 over its 46.27 average: momentum is neutral but rolling over. A close under 23,740 opens 23,000; a close above 24,600 breaks the downtrend and targets the 24,900 spike high.
Setup: Short at 24,320, stop 24,650, targets 23,740, 23,400 and 23,000. Reward:risk 1.8 / 2.8 / 4.0, medium conviction. Cancel if a 4-hour close above 24,650, or if US chip curbs are ruled out. Cancel if unfilled by 21:00 GMT on Friday 13 Nov.
Conclusion
Tech weakness, a 5% US yield and a strong dollar favor selling bounces in the S&P 500 near 7,672 (medium conviction), the Nasdaq 100 near 28,660 (medium) and the Hang Seng near 24,320 (medium). Europe’s defensive record-high rally favors buying dips in the FTSE 100 near 10,760 and the CAC 40 near 8,245, both medium conviction. The session risks are US PPI at 13:30 GMT, the 14:30 GMT US open and Daly at 17:00 GMT. A 4-hour close above 7,730 in the S&P 500 or under 8,150 in the CAC 40 would change the picture.
Trade the S&P 500, Nasdaq 100, FTSE 100, CAC 40 and Hang Seng with Capital Street FX.
Frequently Asked Questions
What is the index outlook right now?
Tech indices (Nasdaq 100, Hang Seng) are under pressure from Nvidia’s leadership crisis and a 5% US yield, the S&P 500 is at a decision zone on its averages, and the FTSE 100 and CAC 40 trade near records. US PPI at 13:30 GMT is the key scheduled test.
Which index trade ideas are live for Friday?
Short the S&P 500 near 7,672, short the Nasdaq 100 near 28,660, long the FTSE 100 near 10,760, long the CAC 40 near 8,245 and short the Hang Seng near 24,320, each with a stop and three targets valid until 21:00 GMT.
What time are the key events in GMT?
The Hong Kong open is at 01:30 GMT, Europe opens at 08:00, Eurozone Q3 GDP is at 10:00, US PPI at 13:30, Collins at 14:10, the US open at 14:30, Bowman at 15:50 and Daly at 17:00 GMT. Setups expire at 21:00 GMT and daily candles close at 22:00 GMT.
Why is the Hang Seng falling?
It closed down 1.26% at 24,008.55 for a fourth straight loss as Alibaba fell about 6.7% and Tencent 2.6% on fears of US curbs on offshore datacentre chip access, and as Nvidia’s CEO turmoil and 5% US yields hit tech.
Why are European indices near records?
Strong earnings, easing Middle East tension and a defensive, low-AI sector mix kept the STOXX 600 at a record high on Thursday while Nvidia’s crisis weighed on tech elsewhere.