Week Ahead: Fed Minutes, US Retail Sales and Nvidia Earnings Test the S&P 500 at 7,562 as the Hang Seng Sits on Triangle Support | Technical Analysis – Index Report | 14 Nov 2026
Indices Week Ahead | 16–20 November 2026
Week Ahead: Fed Minutes, US Retail Sales and Nvidia Earnings Test the S&P 500 at 7,562 as the Hang Seng Sits on Triangle Support
- Weekly bias
- Cautiously bullish, fragile
- First weekly gain since October for the S&P 500; Hang Seng the exception; December Fed hike fully priced
- Expected volatility
- High
- China data, US retail sales, Nvidia, UK CPI, FOMC minutes and the Anthropic IPO between Monday 02:00 GMT and Thursday
- Key event
- FOMC minutes
- Wednesday 18 Nov, 19:00 GMT; US retail sales Tuesday 13:30 GMT; Nvidia Tuesday about 21:20 GMT
- Key pivot level
- 7,422
- S&P 500 weekly low; Dow 51,648, FTSE 10,720, DAX 25,793 and Hang Seng 23,595 are the other floors
Market Overview
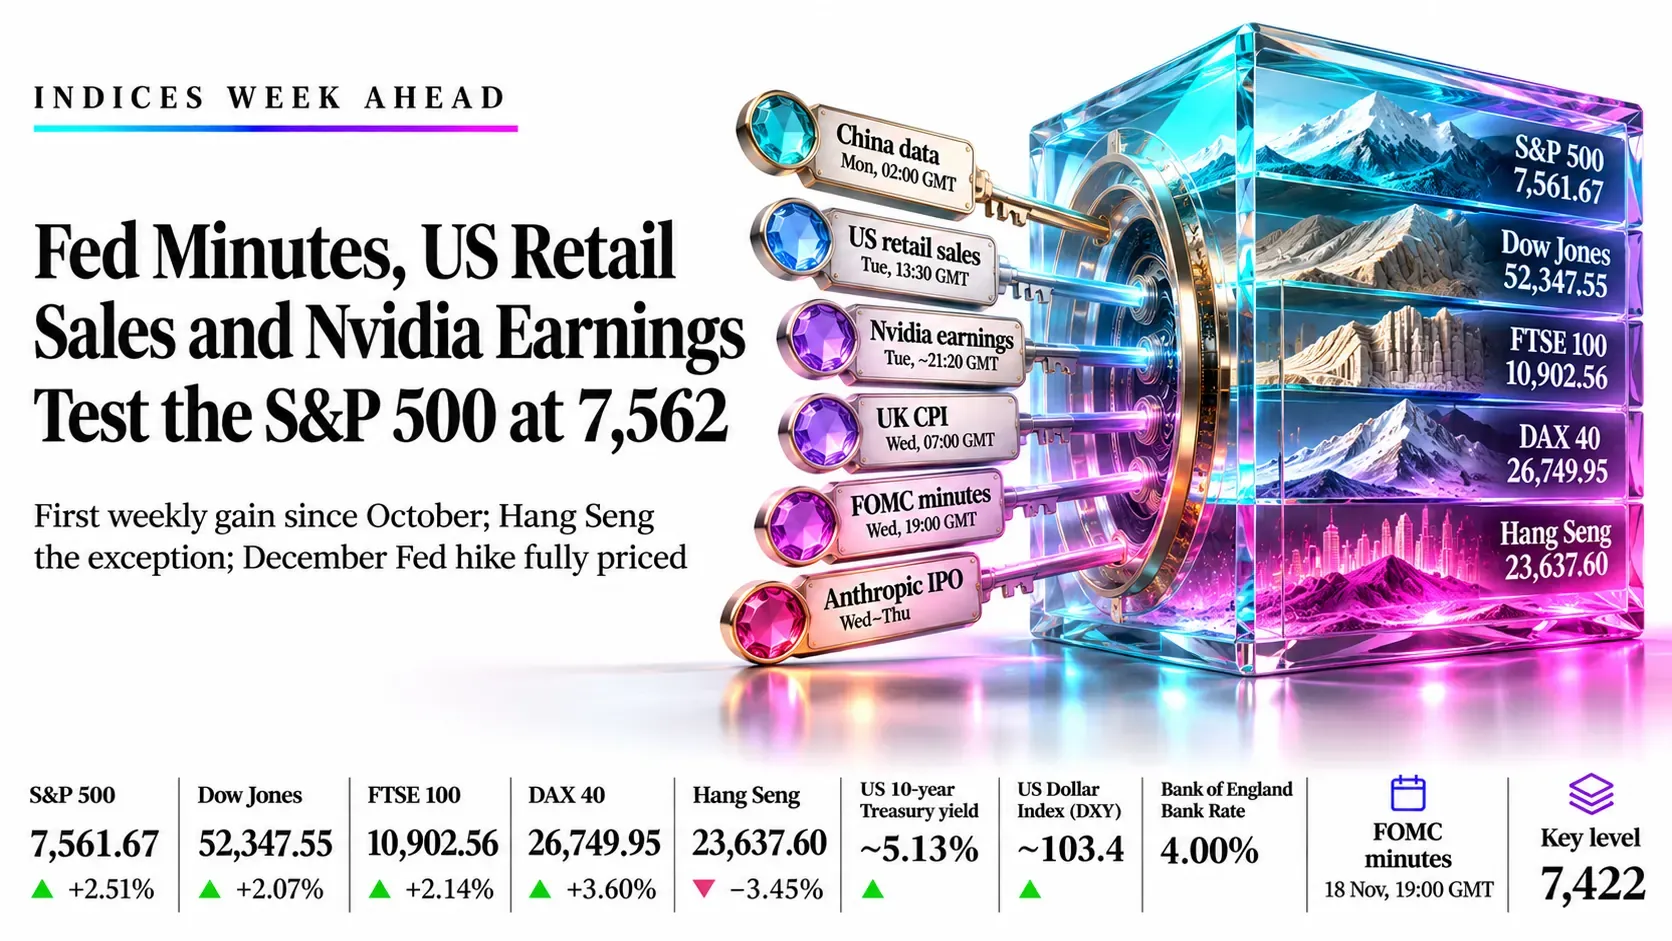
What we expect this week. Event risk will dominate. China’s October data on Monday at 02:00 GMT will set the Asian tone, US retail sales on Tuesday at 13:30 GMT will test Fed hike pricing, Nvidia will report on Tuesday at about 21:20 GMT, UK CPI will land on Wednesday at 07:00 GMT and the FOMC minutes will follow at 19:00 GMT. Anthropic is expected to price its IPO on Wednesday and list on the Nasdaq on Thursday. Fed Chair Warsh and Williams will speak on Monday. If the data run hot, we expect US indices to give back part of last week’s rebound; if they soften, we expect them to extend toward their weekly highs.
Where we expect the indices to trade. The S&P 500 will likely hold 7,422–7,653, the Dow will respect its triangle, the DAX will consolidate under its 27,002 record and the FTSE 100 will test 11,050. The Hang Seng will be the most exposed to technology and chip headlines and to the China data, and we expect it to stay under its 24,497 average.
Where the market stands now. The S&P 500 closed Friday at 7,562, the Dow at 52,348, the DAX at 26,750, the FTSE 100 at 10,903 and the Hang Seng at 23,638. The 10-year Treasury yield is near 5.13%, the dollar index is near a 19-month high and a December Fed hike is fully priced.
What happened last week. The S&P 500 gained 2.51%, the Dow 2.07%, the DAX 3.60% and the FTSE 100 2.14%, while the Hang Seng fell 3.45%. Hot October CPI lifted hike bets, and Nvidia’s CEO Jensen Huang resigned on Thursday, leaving the stock about 12% lower on the week.
We favour four buy-the-dip setups in the US, UK and German indices and one short in the Hang Seng. Because the four longs share the same Fed and Nvidia risk, we advise sizing them as one position.
Key highlights
- S&P 500: Will test the 7,623 average from below; 7,422 is the weekly low that must hold and a hawkish minutes tone would target 7,256.
- Dow Jones: Will trade inside a triangle between about 51,250 and 53,600; a pullback to 51,650 supports a low-conviction long.
- FTSE 100: Will test the 11,050 triangle roof after a three-month closing high; UK CPI on Wednesday is the catalyst.
- DAX 40: Will consolidate under the 27,002 record; 25,686 is the average that must hold.
- Hang Seng: Will stay under the 24,497 average; 23,595 is the weekly low and a close under it opens 22,518.
Market Snapshot: Friday 13 November 2026 Close
S&P 500 SPX
7,561.67
+184.81+2.51% week
Range 7,422–7,653
7,2567,819
Buy near 7,420Dow Jones DJI
52,347.55
+1,061.82+2.07% week
Range 51,648–52,756
50,38453,600
Buy near 51,650FTSE 100 UKX
10,902.56
+228.62+2.14% week
Range 10,654–10,911
10,45011,050
Buy near 10,600DAX 40 DAX
26,749.95
+929.59+3.60% week
Range 25,793–27,002
25,40027,500
Buy near 26,100Hang Seng HSI
23,637.60
-844.26-3.45% week
Range 23,595–24,739
22,51825,300
Sell near 24,500- US 10-year Treasury yield
- ~5.13%
- Highest weekly close since October
- Fed December hike odds
- 100%
- ~85–89% for 25 bp, 11–15% for 50 bp
- US Dollar Index (DXY)
- ~103.4
- 19-month high
- Bank of England Bank Rate
- 4.00%
- Raised 8-1 on 5 Nov; next decision 17 Dec
Trade Setups for the Week
| Instrument | Direction | Entry | Stop | Target 1 | Target 2 | Reward:risk | Conviction |
|---|---|---|---|---|---|---|---|
| S&P 500 | Long | 7,420 | 7,250 | 7,653 | 7,819 | 1.4 / 2.3 | Low |
| Dow Jones | Long | 51,650 | 50,800 | 52,756 | 53,600 | 1.3 / 2.3 | Low |
| FTSE 100 | Long | 10,600 | 10,400 | 10,910 | 11,050 | 1.6 / 2.3 | Low |
| DAX 40 | Long | 26,100 | 25,650 | 27,000 | 27,500 | 2.0 / 3.1 | Medium |
| Hang Seng | Short | 24,500 | 25,000 | 23,600 | 22,550 | 1.8 / 3.9 | Medium |
Reward:risk is the distance from entry to target 1 and target 2, divided by the distance from entry to the stop. All levels are index points. Levels are conditional technical references, not recommendations.
Key Market Drivers
The Fed’s hike path and 5% yields
Hot October CPI (0.4% on the month), a December hike fully priced and a 10-year yield near 5.13% raised the cost of capital. Governor Waller said a 50 bp move should be considered and Dallas Fed’s Logan backed at least two more hikes.
Key events: Monday 16 November, Williams at 14:05 GMT and Warsh at about 17:00 GMT; Tuesday 17 November, retail sales at 13:30 GMT; Wednesday 18 November, FOMC minutes at 19:00 GMT.
Nvidia, the AI trade and the Anthropic IPO
Nvidia fell about 12% on the week after Jensen Huang resigned and reports fiscal Q3 under interim CEO Colette Kress; consensus is about $108.8 billion of revenue. Anthropic is expected to price its IPO at $70–$78 a share on Wednesday and list on the Nasdaq on Thursday, a test of appetite for AI.
Key events: Tuesday 17 November, results at about 21:20 GMT and call at 22:00 GMT; Wednesday 18 November, IPO pricing expected; Thursday 19 November, first trade.
UK inflation and the Bank of England
The Bank of England lifted Bank Rate to 4.00% on 5 November and sees inflation near 5% by mid-2027. September CPI was 3.5%, and October’s figure is the first to capture the Ofgem price cap rise, so Wednesday’s print shapes the 17 December decision.
Key events: Tuesday 17 November, UK labour data at 07:00 GMT; Wednesday 18 November, CPI at 07:00 GMT; Friday 20 November, UK retail sales at 07:00 GMT.
China data and Hong Kong technology
China reports October activity on Monday with retail sales forecast at 0.8% and industrial output at 5.3%. The Hang Seng Tech Index lost 3.02% on Friday and Baidu and Alibaba report this week, while chip export-control worries weigh on the sector.
Key events: Monday 16 November, China data at 02:00 GMT; Thursday 19 November, Alibaba results; Friday 20 November, loan prime rates at 01:00 GMT.
The S&P 500 at 7,422, the DAX at 25,793 and the Hang Seng at 23,595 mark the floors most exposed to the retail sales, Nvidia and minutes sequence. A weekly close beneath any of them would change the picture.
US Data Scenario Analysis
Consensus is for October retail sales of +0.2% (control group +0.4%) on Tuesday at 13:30 GMT, with Nvidia results the same evening and the FOMC minutes on Wednesday at 19:00 GMT. The minutes pre-date the hot CPI report, so live Fed speakers and the retail print carry more weight.
Hawkish: strong retail sales and a hawkish minutes tone lift yields
Higher yields and a larger December hike pressure valuations and push the indices to their weekly lows.
- S&P 5007,422, then 7,256
- Dow Jones51,648, then 50,384
- FTSE 10010,720, then 10,450
- DAX 4025,793, then 25,400
- Hang Seng23,595, then 22,518
Softer: weak retail sales or strong Nvidia guidance trigger a relief rally
Lower yield expectations and a firm AI read allow indices to extend toward the first resistance levels.
- S&P 5007,653, then 7,819
- Dow Jones52,756, then 53,600
- FTSE 10010,911, then 11,050
- DAX 4027,002, then 27,500
- Hang Seng24,497, then 25,300
S&P 500 | SPX
S&P 500 Outlook: Best Week Since August Leaves the Index Under Its 7,623 Average as Hike Bets Cap the Rebound
7,561.67 +184.81 (+2.51%) week Range 7,422–7,653
Outlook: The S&P 500 will trade between 7,422 and 7,653 while US yields stay above 5%, and retail sales, Nvidia and the FOMC minutes will decide which side breaks. A hawkish minutes tone will test 7,422 and then 7,256, while softer data and a solid Nvidia guide will lift it toward the 7,623 average and 7,653. A weekly close above 7,653 will reopen the 7,819 record close. The index closed Friday at 7,561.67 after a 2.51% weekly gain, its first since early October and about 3% below its record.

Key levels
- Support 2
- 7,256
- Support 1
- 7,422
- Resistance 1
- 7,653
- Resistance 2
- 7,819
Weekly chart structure
- Structure: a rising channel since the March low; price has bounced off the lower line near 7,300 and is in the lower half of the channel.
- Averages: 7,622.65 sits just above price and acts as first resistance; 7,255.81 and 6,698.31 sit below and mark the next supports.
- Candle: bullish, opened 7,422.24, ranged 7,422.24–7,652.76 and closed 2.51% higher, near the upper half of the range.
- Momentum: weekly RSI 52.44 sits under its 59.84 signal line, neutral and not yet confirming the rebound.
Key technical levels
7,422 is the weekly open and low; below it, 7,256 combines the average with the channel floor. On the upside, 7,623 is the average, 7,653 the weekly high and 7,819 the 6 October record close; a weekly close under 7,256 would end the bullish case.
Fundamental drivers
Fed hikes and yields
The 10-year Treasury yield is near 5.13% and a December Fed hike is fully priced on CME FedWatch, with about 85–89% odds of 25 bp and 11–15% of 50 bp. October CPI rose 0.4% on the month, and Waller and Logan have argued for more tightening.
Technology and breadth
Technology fell for a second day on Friday as Nvidia lost another 2% after CEO Jensen Huang resigned, yet more than 60% of S&P 500 stocks rose. Energy, industrials and communications led all eleven sectors higher on the week.
S&P 500 trade setup
LongLow conviction- Entry
- 7,420
- Stop loss
- 7,250
- Target 1
- 7,653
- Target 2
- 7,819
Risk 170 points. Reward:risk 1.4 to target 1, 2.3 to target 2.
Rationale: A weekly open and channel-floor zone with all eleven sectors higher on the week offers a defined-risk dip entry; the stop sits under the 7,256 average and the channel floor.
Invalidation: A daily close below 7,250. A hawkish FOMC minutes tone, strong retail sales lifting the 10-year above 5.2%, or a weak Nvidia guide would favour a retest of 7,256.
Dow Jones | DJI
Dow Jones Outlook: Dow Rallies 2% Inside a Narrowing Triangle as Rotation Out of Technology Keeps the Blue Chips Afloat
52,347.55 +1,061.82 (+2.07%) week Range 51,648–52,756
Outlook: The Dow will trade inside its triangle between about 51,250 and 53,600, and retail sales, retail earnings and the FOMC minutes will decide the breakout. A pullback into 51,650 will offer a better entry than the close, and a hold there will aim at 52,756 and 53,600. Because the triangle is untested, we rate the idea low conviction. The Dow closed Friday at 52,347.55 after a 2.07% weekly gain, edging up 0.1% on Friday while the Nasdaq fell 0.9% on rotation out of technology.

Key levels
- Support 2
- 50,384
- Support 1
- 51,648
- Resistance 1
- 52,756
- Resistance 2
- 53,600
Weekly chart structure
- Structure: a symmetrical triangle between a falling line from the August high above 54,000 and a rising line from the March low; the lower line is near 51,250 and the upper near 53,600.
- Averages: 52,438.89 sits just above price; 50,383.89 and 47,114.20 sit below and mark deeper supports.
- Candle: bullish, opened 51,648.16, ranged 51,648.16–52,756.28 and closed 2.07% higher, with a long upper wick.
- Momentum: weekly RSI 55.65 sits under its 57.13 signal line, neutral with a slightly rising slope.
Key technical levels
51,648 is the weekly open and low, just above the lower triangle line near 51,250; 50,384 is the average below it. On the upside, 52,756 is the weekly high and 53,600 the triangle roof; a break above the roof would aim at the 54,000 area first reached on 4 August.
Fundamental drivers
Rotation and breadth
Industrials, energy and defensives led the week while chipmakers sold off on Nvidia’s leadership crisis. The Dow’s lower weighting in technology made it the steadier index, and it gained more than 1,000 points on the week.
Retail earnings and rates
Home Depot reports on Tuesday, Lowe’s and TJX on Wednesday and Walmart on Thursday, all before the US open. A 10-year yield above 5% and a December Fed hike raise the cost of capital for the index’s cyclical members.
Dow Jones trade setup
LongLow conviction- Entry
- 51,650
- Stop loss
- 50,800
- Target 1
- 52,756
- Target 2
- 53,600
Risk 850 points. Reward:risk 1.3 to target 1, 2.3 to target 2.
Rationale: A pullback to the weekly low and triangle floor offers the tightest risk in the index; the stop sits under the lower triangle line and the 50,800 area.
Invalidation: A daily close below 50,800. Hot retail sales, a hawkish minutes tone or weak retail earnings would favour a break of the triangle floor toward 50,384.
FTSE 100 | UKX
FTSE 100 Outlook: Three-Month High Meets the Roof of a Flat-Topped Triangle Ahead of UK Inflation and Jobs Data
10,902.56 +228.62 (+2.14%) week Range 10,654–10,911
Outlook: The FTSE 100 will test the roof of its triangle near 11,050, and UK jobs data on Tuesday and October CPI on Wednesday will decide whether it breaks. Hot CPI will firm Bank of England hike pricing for 17 December and could lift sterling, which will weigh on the index; a pullback toward 10,600 will offer a better entry than the close. Because the roof has capped rallies since February, we rate the idea low conviction. The index closed Friday at 10,902.56 after a 2.14% weekly gain, its highest close since early August, lifted by energy, healthcare and utilities.

Key levels
- Support 2
- 10,450
- Support 1
- 10,720
- Resistance 1
- 10,911
- Resistance 2
- 11,050
Weekly chart structure
- Structure: a triangle with a flat roof near 11,050 and a rising floor from the March low near 10,540; price is in the upper half.
- Averages: 10,720.07 and 10,449.42 sit below price and 9,666.37 further down, all rising.
- Candle: bullish, opened 10,673.36, ranged 10,654.32–10,910.59 and closed 2.14% higher, near the high.
- Momentum: weekly RSI 58.69 sits above its 55.85 signal line, a constructive but not overbought reading.
Key technical levels
10,720 is the first support, the average; 10,450 combines the second average with the triangle floor. On the upside, 10,911 is the weekly high and 11,050 the triangle roof; a weekly close above 11,050 would target new highs.
Fundamental drivers
Energy, defensives and sterling
BP and Shell gained about 1.5% each on Friday as crude rose after Houthi strikes on Saudi infrastructure and tanker attacks. AstraZeneca, GSK and utilities rose as investors moved away from technology. A firm pound would trim overseas earnings.
Bank of England path
The Bank of England raised Bank Rate to 4.00% on 5 November (8-1 vote). A Reuters poll shows most economists expect a hold on 17 December, while markets price a hike; CPI of 3.5% in September makes Wednesday’s print the test.
FTSE 100 trade setup
LongLow conviction- Entry
- 10,600
- Stop loss
- 10,400
- Target 1
- 10,910
- Target 2
- 11,050
Risk 200 points. Reward:risk 1.6 to target 1, 2.3 to target 2.
Rationale: A pullback to the 10,600–10,720 band offers a defined-risk entry above the rising average with the triangle floor close by; the stop sits under 10,449.
Invalidation: A daily close below 10,400. Hot UK CPI that lifts sterling, a sharper oil fall or a rotation back into technology would favour a test of the 10,450 floor.
DAX 40 | DAX
DAX 40 Outlook: Record 27,002 Intraday High Leaves Frankfurt Stretched Ahead of ZEW and Nvidia Results
26,749.95 +929.59 (+3.60%) week Range 25,793–27,002
Outlook: The DAX will consolidate below its 27,001.67 record before the next push, with Tuesday’s ZEW survey and Nvidia’s results setting the tone. A pullback toward 26,100 will offer a better entry than the close, and a weekly close above 27,002 will target 27,500. A close under the 25,686 average will end the bullish case. The index closed Friday at 26,749.95 after a 3.60% weekly gain, its best since late June, having set the record on Thursday before profit-taking.

Key levels
- Support 2
- 25,400
- Support 1
- 25,793
- Resistance 1
- 27,002
- Resistance 2
- 27,500
Weekly chart structure
- Structure: a rising channel since the March low; price is in the upper half with the record high at the top of the range.
- Averages: 25,685.54, 24,888.43 and 23,930.41 sit below price and slope up, the 25,686 average being first support.
- Candle: strongly bullish, opened 25,815.30, ranged 25,793.06–27,001.67 and closed 3.60% higher with a long upper wick.
- Momentum: weekly RSI 62.45 sits above its 55.62 signal line, firm but short of overbought.
Key technical levels
25,793 is the weekly low and 25,686 the average; the channel floor is near 25,400. On the upside, 27,002 is the record high and 27,500 a round-number projection; a weekly close under 25,686 would end the bullish case.
Fundamental drivers
Earnings and growth upgrades
Siemens reported record profit on data-centre demand and Infineon gave strong results. Germany’s economic advisers raised their 2026 growth forecast to 1.3%. Falling oil prices earlier in the week supported the advance.
ECB and technology risk
Eurozone inflation keeps an ECB hike in the debate ahead of Lagarde’s speeches on Thursday and Friday. Infineon fell 4.3% on Friday on the chip sell-off, so Nvidia’s results are the main outside risk.
DAX 40 trade setup
LongMedium conviction- Entry
- 26,100
- Stop loss
- 25,650
- Target 1
- 27,000
- Target 2
- 27,500
Risk 450 points. Reward:risk 2.0 to target 1, 3.1 to target 2.
Rationale: A pullback into the 26,100 area keeps price above the rising 25,686 average, and the 3.6% weekly gain sits inside an intact channel; the stop is under that average.
Invalidation: A daily close below 25,650. A hawkish Fed minutes tone, weak Nvidia guidance or a soft ZEW reading would favour a retest of the 25,400 channel floor.
Hang Seng | HSI
Hang Seng Outlook: Third Straight Daily Loss Leaves the Index Under Its Averages and Above a Rising Triangle Floor
23,637.60 -844.26 (-3.45%) week Range 23,595–24,739
Outlook: The Hang Seng will stay biased lower while the 24,497 average caps rallies, with China’s October data on Monday and Alibaba’s results on Thursday driving the move. A bounce toward 24,500 will meet sellers, and a weekly close under 23,595 will open the 22,518 low, while a strong China print or a technology rebound will squeeze it toward 25,300. The index closed Friday at 23,637.60 after a 3.45% weekly loss and a third straight daily fall, as the Hang Seng Tech Index fell 3.02% on Nvidia’s leadership turmoil and export-control worries.

Key levels
- Support 2
- 22,518
- Support 1
- 23,595
- Resistance 1
- 24,497
- Resistance 2
- 25,300
Weekly chart structure
- Structure: a symmetrical triangle between a falling line from the January high near 28,000 and a rising line from the 2024 low; the lower line is near 23,250 and the upper near 25,250.
- Averages: 24,496.83 and 24,595.46 sit just above price and 25,300.04 further up, capping rallies.
- Candle: bearish, opened 24,625.71, ranged 23,595.36–24,738.88 and closed 3.45% lower, near the low.
- Momentum: weekly RSI 42.87 sits under its 45.78 signal line, weak but not oversold.
Key technical levels
23,595 is the weekly low and 22,518 the 52-week low, with the lower triangle line near 23,250 between them. On the upside, 24,497 is the average, 24,739 the weekly high and 25,300 the upper average; a weekly close above 25,300 would end the bearish case.
Fundamental drivers
Technology and chip policy
The Hang Seng Tech Index fell 3.02% on Friday. Nvidia’s leadership scandal revived worries about tighter US export controls on advanced chips for Chinese AI developers, and the index extended losses to a third daily fall.
China data and rates
Forecasts are for October retail sales of 0.8% (1.1% before) and industrial output of 5.3%. China’s trade surplus narrowed in October and the loan prime rates, due Friday, are expected to stay at 3.0% and 3.5%. A US 10-year yield above 5.1% adds pressure.
Hang Seng trade setup
ShortMedium conviction- Entry
- 24,500
- Stop loss
- 25,000
- Target 1
- 23,600
- Target 2
- 22,550
Risk 500 points. Reward:risk 1.8 to target 1, 3.9 to target 2.
Rationale: Price under three averages, a failed rally to 24,739 and weak technology favour selling bounces; the 24,500–25,000 band defines the risk.
Invalidation: A daily close above 25,000. Strong China activity data, new stimulus, a strong Alibaba result or a clean Nvidia print would favour a squeeze toward 25,300.
Economic Calendar: 16–20 November 2026
| Date | Event | Market | Impact | Context |
|---|---|---|---|---|
| 23:50 GMT | Japan GDP, preliminary Q3 | Hang Seng | Med | Asian growth and yen read ahead of Monday’s Asia open |
| 02:00 GMT | China activity data (October): retail sales 0.8%, industrial output 5.3% | Hang Seng | High | Sets the Asia tone at the weekly open; weak data adds to technology pressure |
| 13:30 GMT | US Empire State manufacturing (November) | S&P 500, Dow | Low | Early read on US factory demand |
| 14:05 GMT | Fed’s Williams gives opening remarks | S&P 500, Dow | Med | Follows hot October CPI; Fed Chair Warsh also speaks at about 17:00 GMT |
| 07:00 GMT | UK labour market report | FTSE 100 | Med | Wage growth feeds Bank of England hike pricing for 17 December |
| 10:00 GMT | German ZEW economic sentiment (November), previous 28.1 | DAX 40 | Med | Consensus near 27–29; a drop would test a stretched DAX |
| 13:30 GMT | US retail sales (October), forecast +0.2%, control group +0.4% | All five | High | A beat keeps December hike odds at 100% and pressures indices |
| 21:20 GMT | Nvidia Q3 FY2027 results; call at 22:00 GMT | S&P 500, DAX, Hang Seng | High | First report under interim CEO Kress; consensus about $108.8bn revenue; options imply a move of 8–9% |
| 07:00 GMT | UK CPI (October), previous 3.5% | FTSE 100 | High | First print to capture the Ofgem price cap rise; shapes the 17 December Bank of England decision |
| 19:00 GMT | FOMC minutes (October meeting) | All five | High | Hawkish tone would test 7,422 for the S&P 500; minutes pre-date the hot CPI report |
| Evening | Anthropic IPO pricing expected, range $70–$78; Palo Alto Networks results | S&P 500, Dow | Med | Pricing is expected rather than confirmed; trading expected on the Nasdaq on Thursday |
| 13:30 GMT | US jobless claims; Philadelphia Fed index | S&P 500, Dow | Med | Labour data feed Fed hike odds and the dollar |
| Pre-market | Walmart results; Alibaba results; Anthropic expected first trade | Dow, Hang Seng, S&P 500 | High | Walmart before the US open; Alibaba sets the Hong Kong technology tone |
| 01:00 GMT | China loan prime rates | Hang Seng | Low | 1-year and 5-year rates expected to stay at 3.0% and 3.5% |
| 07:00 GMT | UK retail sales (October) | FTSE 100 | Med | Consumer read ahead of Christmas trading |
All times GMT. Consensus figures from Newsquawk, FXStreet, Kiplinger and Trading Economics; Nvidia timing from the company’s announcement; Williams and Warsh times approximate; Anthropic pricing and trading dates are reported expectations.
Conclusion
One idea links the week: the Fed is closer to a December hike, possibly 50 bp, than markets thought a month ago, and that lifts yields and the dollar against equities while Nvidia’s leadership crisis weighs on technology. US retail sales, Nvidia, UK CPI and the FOMC minutes test it.
On conviction, the DAX rates medium because price sits above a rising average inside an intact channel, and the Hang Seng rates medium because price is under key averages after a failed rally. The S&P 500, Dow and FTSE 100 rate low because each sits near a resistance line ahead of binary headlines.
We treat every level as conditional, let the event windows pass before adding exposure and size the four long ideas as one position because they share the same macro risk. Spreads can widen sharply around retail sales, Nvidia and the minutes, and indices gap at the open after weekend news.
| Instrument | Bias | Key level | Targets | Invalidation | Principal risk |
|---|---|---|---|---|---|
| S&P 500 | Buy near 7,420 | 7,422 | 7,653 / 7,819 | Below 7,250 | Hold of the 7,623 average and a dovish surprise |
| Dow Jones | Buy near 51,650 | 51,648 | 52,756 / 53,600 | Below 50,800 | Break of the triangle roof on weak yields |
| FTSE 100 | Buy near 10,600 | 10,720 | 10,910 / 11,050 | Below 10,400 | Hot UK CPI lifting sterling |
| DAX 40 | Buy near 26,100 | 25,793 | 27,000 / 27,500 | Below 25,650 | Break of the 27,002 record on a strong Nvidia print |
| Hang Seng | Sell near 24,500 | 23,595 | 23,600 / 22,550 | Above 25,000 | Strong China data and technology rebound |
Trade the S&P 500, Dow Jones, FTSE 100, DAX 40 and Hang Seng with Capital Street FX.
Frequently Asked Questions
Which events decide indices this week?
US retail sales on Tuesday at 13:30 GMT, Nvidia results on Tuesday at about 21:20 GMT, UK CPI on Wednesday at 07:00 GMT and the FOMC minutes on Wednesday at 19:00 GMT set the tone. China data on Monday at 02:00 GMT and the Anthropic IPO add to it.
Why did the Hang Seng fall while other indices rose?
The Hang Seng lost 3.45% on the week and fell for a third straight day on Friday as the Hang Seng Tech Index dropped 3.02% on Nvidia’s leadership turmoil and chip export-control worries, while US, UK and German indices gained 2.1–3.6%.
Is a Fed hike in December certain?
CME FedWatch prices a December hike at 100%, with about 85–89% for 25 bp and 11–15% for 50 bp. The 9 December meeting decides it, and the FOMC minutes and retail sales shift the balance between the two sizes.
How could UK CPI move the FTSE 100?
Hot CPI above September’s 3.5% would firm Bank of England hike pricing for 17 December and could lift sterling, which usually weighs on the FTSE 100’s overseas earners; softer CPI would do the opposite.
How can traders manage risk in an event-heavy week?
Reduce size before major releases, avoid new entries in the minutes around them and allow for wider spreads. Treat the four long setups as one position because they share Fed and Nvidia risk, and allow for gaps at the Monday open.