Gold Hits a One-Year Low at $3,855, Silver Collapses 2.8% and Copper Breaks Down as the Dollar Surges Into Warsh, While WTI Defends $88 | Technical Analysis – Commodity Report | 16 Nov 2026
LIVE Commodities | Monday 16 November 2026 | 09:47 GMT live snapshot, London morning ahead of the US open | Fed Chair Warsh is due to speak at 17:00 GMT
Gold Hits a One-Year Low at $3,855, Silver Collapses 2.8% and Copper Breaks Down as the Dollar Surges Into Warsh, While WTI Defends $88
Market Overview
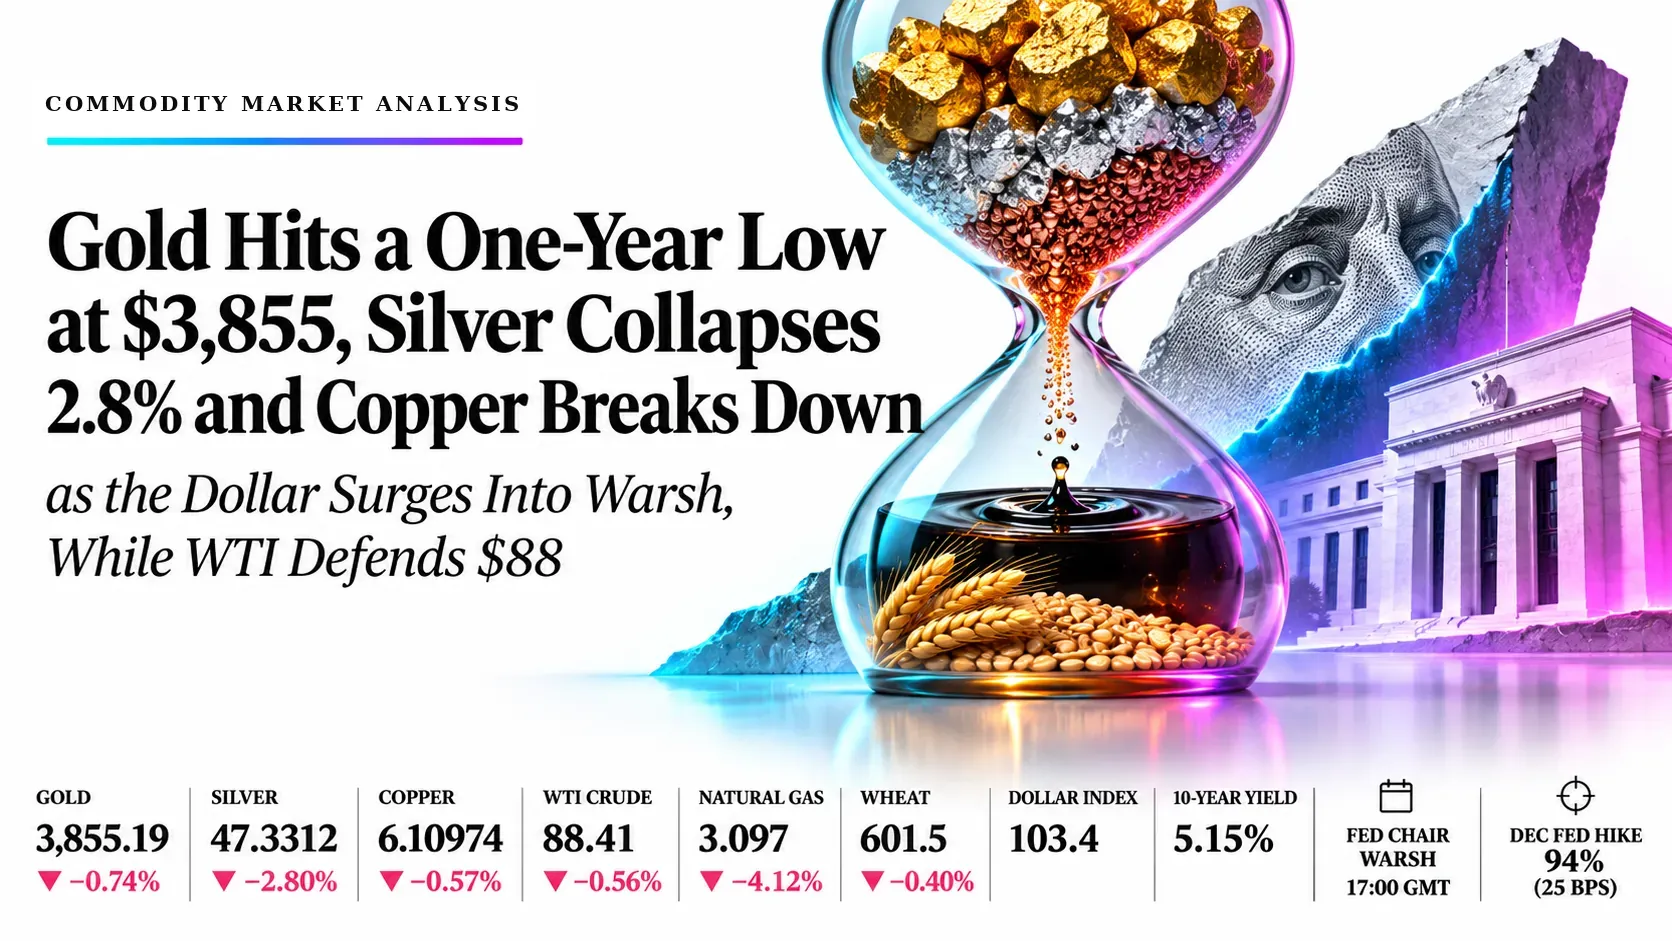
A near-certain December Fed hike has pushed the dollar to a 19-month high and is crushing commodities, so the play into Warsh at 17:00 GMT is to sell every bounce in gold, silver, copper, natural gas and wheat, and to fade oil strength while the IEA surplus forecast caps it. At the 09:47 GMT live snapshot gold was at $3,855.19 (−0.74%), a more-than-one-year low after a 4.5% drop last week, silver at $47.3312 (−2.80%), its weakest in over a year, copper at $6.10974 per lb (−0.57%) after breaking its rising channel, WTI crude at $88.41 (−0.56%), natural gas at $3.097 (−4.12%) and wheat at 601.5 cents per bushel (−0.40%). CME FedWatch shows a 94% chance of a 25 basis point hike on 9 December and 6% for 50 basis points, the dollar index is near 103.4, and the 10-year Treasury yield closed last week near 5.15% after the biggest annual rise in US producer prices in four years.
Four of the six markets are already near oversold, so this is a sell-the-bounce day and not a chase-the-low day, with the risk window running from Williams at 14:05 GMT through the US open at 14:30 GMT to Warsh at 17:00 GMT. RSI readings of 36.13 (gold), 30.07 (silver), 31.62 (copper) and 34.44 (wheat) say bounces are likely and the idea is to use them, while WTI (40.98) and natural gas (52.00) are mid-range. Oil is the one two-way market: Hormuz mine reports and a reported drone attack on a US base in Bahrain against an IEA fourth-quarter surplus forecast. Nvidia results on Tuesday and FOMC minutes on Wednesday keep the risk-off tone in play. This is a 09:47 GMT snapshot, the US session has not opened, and every level below is built for what happens next.
Key highlights
- Gold: Price 3,855.19 (−0.74%); 3,900 caps and 3,830 supports.
- Silver: Price 47.3312 (−2.80%); 48.50 caps and 46.50 supports.
- Copper: Price 6.10974 (−0.57%); 6.20 caps and 6.00 supports.
- Crude Oil: Price 88.41 (−0.56%); 90.00 caps and 87.90 supports.
- Natural Gas: Price 3.097 (−4.12%); 3.18 caps and 3.01 supports.
- Wheat: Price 601.5 (−0.40%); 614.0 caps and 598.0 supports.
What’s Moving Commodities Today
Dollar index holds near 103.4, a 19-month high, as a December Fed hike is priced almost in full, with Warsh due to speak at 17:00 GMT
The dollar index rose 0.25% on Friday to 103.43 and held at 103.42 in Asia, its highest since April 2025, after the 10-year Treasury yield jumped 29 basis points last week to about 5.15%. The fed funds range is 3.75% to 4.00%, CME FedWatch shows a 94% chance of a 25 basis point hike on 9 December and about 6% for 50 basis points, after the largest annual rise in US producer prices in four years. Fed Chair Warsh is due to give opening remarks at 17:00 GMT, and Barr (10:00 GMT), Williams (14:05 GMT) and Hammack (19:15 GMT) are also due to speak.
Source: Newsquawk, Saxo Markets, Thoughts for the Day, Investing.com, 14 to 16 Nov 2026
Gold slides to $3,855, its lowest since October 2025, as hawkish Fed pricing and a strong dollar outweigh safe-haven demand
Spot gold traded between about $3,833 and $3,901 and was down roughly 0.7% to 1.1% on the day, a more-than-one-year low, after a 4.5% drop last week and a loss of about 7% over four weeks. KCM Trade’s Tim Waterer calls gold neutral to mildly bearish against a stronger dollar and elevated yields. Hot October inflation, strong payrolls and the Fed’s hiking bias have driven the slide, and Goldman Sachs has cut its end-2026 gold target to $4,150. MCX gold in India fell about ₹900 to ₹1,35,850 per 10 grams.
Source: Trading Economics, Kitco, Goodreturns, BigGo Finance, 13 to 16 Nov 2026
Silver falls 2.8% to $47.33 and breaks below its early-November low, hit by the metals sell-off
Silver fell more than gold as industrial metals weakened on soft Chinese activity data and a stronger dollar. Comex silver was down 3.8% at 08:42 GMT, spot silver was at its lowest in over a year, and MCX silver dropped more than 3% to below ₹1.71 lakh per kilogram. Research published Friday forecast a 5% fall in global silver demand in 2026 on weaker jewellery and solar use.
Source: Comex Live, Goodreturns, Kitco, 16 Nov 2026
Oil holds $88 WTI and $96 Brent as Hormuz mine reports and a Bahrain attack meet an IEA surplus forecast
Brent rebounded to about $96.6 after a low of $94.32 as the Revolutionary Guards said two tankers hit mines in the Strait of Hormuz and Iran was reported to have attacked a US base in Bahrain. The IEA said the market is on course for a surplus this quarter for the first time since the war began, Hormuz shipments are nearly back to pre-war levels, and China’s October refinery throughput fell 2% from September. Brent made a second weekly loss last week and settled at $95.84, with WTI at $88.56.
Source: Investing.com, Saxo Markets, Business Recorder (Reuters), Rigzone, 13 to 16 Nov 2026
Copper falls to a four-month low as China’s October output misses and the dollar climbs
China’s industrial output rose 4.8% year on year in October, below the 5.3% forecast, and copper broke under its 200-day average, per FXEmpire. LME three-month copper closed Friday at $13,351 a tonne, down 1.87%. Tight physical supply in China, including record Yangshan premiums and very low Shanghai stocks, is the main support.
Source: FXEmpire, Shanghai Metals Market, Mining.com, 13 to 16 Nov 2026
Natural gas falls 4% to $3.10 as the EIA trims its winter price outlook and the storage surplus widens
December Henry Hub futures settled at about $3.23 on Friday after a 61 Bcf injection that was 21 Bcf above normal, leaving storage 54 Bcf above the five-year average. The EIA’s November outlook cut its winter Henry Hub forecast 16% to $2.87, and record LNG feedgas is the main offset. The next EIA storage report is on Thursday.
Source: Business Recorder (Reuters), Finimize, TradingNews, Premier Energy, 11 to 16 Nov 2026
Wheat sits near multi-month lows on harvest pressure in Australia and Argentina and a firmer dollar
The most-traded CBOT contract was down 1% at $5.87½ at 04:04 GMT, close to Friday’s low of $5.82, the weakest since June, and is about 26% below the early-September high. US export sales were well below expectations, while Black Sea disruption and a large fund short keep the risk of a bounce alive.
Source: Business Recorder (Reuters), Grain Central, CMB News, 16 Nov 2026
Key Drivers for the Rest of Today
Six things that set direction for the rest of the session in gold, silver, copper, WTI crude, natural gas and wheat. All times are GMT.
- Iran and Hormuz headlines
- Live
- Mon 16 Nov, all session
- Mine and attack reports move oil first, then gold and the dollar
- US Empire State index
- 13:30
- Mon 16 Nov, 13:30 GMT
- November reading is due against a prior 25.5; a strong print would lift yields and weigh on metals
- Williams and US open
- 14:05
- Mon 16 Nov, 14:05 and 14:30 GMT
- NY Fed’s Williams is due to speak, then Wall Street opens; equity tone will steer copper
- Fed Chair Warsh speaks
- 17:00
- Mon 16 Nov, 17:00 GMT
- Any hint on December or a 50 basis point hike would move the dollar, gold and silver
- Hammack and CBOT close
- 19:15
- Mon 16 Nov, 19:15 and 19:20 GMT
- Cleveland Fed’s Hammack is due to speak and Chicago grains are due to settle
- Setup expiry and daily close
- 21:00
- Mon 16 Nov, 21:00 and 22:00 GMT
- Unfilled ideas lapse at 21:00 GMT and daily candles close at 22:00 GMT; US retail sales follow tomorrow
Swipe the strip to see every driver.
Trade Setups for Today
Ranked in the order gold, silver, copper, WTI crude, natural gas and wheat, valid until 21:00 GMT today. A 4-hour close beyond the stop cancels the idea.
| Instrument | Direction | Entry | Stop | Target 1 | Target 2 | Reward:risk | Conviction |
|---|---|---|---|---|---|---|---|
| Gold (XAUUSD) | Short | 3,890 | 3,925 | 3,840 | 3,800 | 1.4 / 2.6 | Medium |
| Silver (XAGUSD) | Short | 48.60 | 49.60 | 47.30 | 46.50 | 1.3 / 2.1 | Low |
| Copper (XCUUSD) | Short | 6.20 | 6.29 | 6.05 | 5.95 | 1.7 / 2.8 | Medium |
| Crude Oil (WTI) | Short | 90.50 | 92.20 | 88.00 | 86.00 | 1.5 / 2.6 | Low |
| Natural Gas (NG) | Short | 3.18 | 3.27 | 3.01 | 2.95 | 1.9 / 2.6 | Medium |
| Wheat (Wheat) | Short | 614.0 | 626.0 | 598.0 | 588.0 | 1.3 / 2.2 | Low |
Reward:risk is the distance from entry to each target divided by the distance from entry to the stop. A third target for each instrument is in its section below. Units: gold and silver in US dollars per ounce, copper in dollars per pound, WTI in dollars per barrel, natural gas in dollars per MMBtu and wheat in US cents per bushel. Levels come from the daily charts captured at 09:45 to 09:47 GMT (TVC feed for gold, silver and WTI; Capital.com for copper; NYMEX December contract for natural gas; Pepperstone cash contract for wheat) and can differ from Investing.com quotes by a few ticks, and by more in copper and wheat, whose contracts differ by feed. Every entry sits away from the current price and needs a bounce to trigger, and Fed headlines or Hormuz news can gap prices through them. All six ideas are shorts, so a dovish Warsh or a rebound in risk assets would hit them together. Levels are conditional technical references, not recommendations.
Risk Scenario Analysis
Warsh’s tone and Hormuz headlines are the swing factors for the rest of today.
If Warsh keeps a December hike on the table and yields rise, metals and grains break lower
A stronger dollar pushes gold, silver and copper toward their channel floors, while oil and natural gas fall on weaker demand and mild weather.
- Gold3,830, then 3,800
- Silver46.50, then 45.50
- Copper6.00, then 5.90
- Crude Oil87.90, then 86.00
- Natural Gas3.01, then 2.95
- Wheat598.0, then 588.0
If Warsh sounds less hawkish or Hormuz risk flares, the oversold metals bounce and oil jumps
A softer dollar lets gold, silver and copper retest their overhead resistance, while a confirmed Hormuz disruption would lift WTI toward the upper end of its range.
- Gold3,900, then 3,960
- Silver48.50, then 49.60
- Copper6.20, then 6.28
- Crude Oil90.00, then 91.50
- Natural Gas3.18, then 3.23
- Wheat614.0, then 625.0
Gold (XAU/USD) | Investing.com quote, TVC chart feed
Gold Analysis: Price Sinks Toward the Channel Floor at $3,855, Its Lowest Since October 2025, With RSI 36.13 Near Oversold and Warsh Due at 17:00 GMT
3,855.19 −28.75 (−0.74%) on the chart feed Previous close 3,883.94 | Open 3,883.89 | Range 3,832.54 to 3,901.23 | Kitco spot 3,845 at 05:50 GMT, Trading Economics 3,837.73 | MCX gold ₹1,35,850 per 10 g
Outlook: Bias is lower on bounces with medium conviction while 3,925 caps. Gold has lost about 7% in four weeks as a December Fed hike is almost fully priced, Treasury yields sit near 5% and the dollar index is at a 19-month high. Goldman Sachs has cut its end-2026 target to $4,150. RSI is near oversold, so the idea sells a bounce toward 3,890 rather than the low, with Fed Chair Warsh’s 17:00 GMT speech the main trigger.

Key levels
- Support 2
- 3,800
- Support 1
- 3,830
- Resistance 1
- 3,900
- Resistance 2
- 3,960
- Price (3,855.19) is under the 4,009.67, 4,143.44 and 4,190.57 averages. Main catalysts: Williams at 14:05 GMT, the US open at 14:30 GMT and Warsh at 17:00 GMT. Today’s low of 3,832.54 is the first support.
- RSI 36.13 under its 41.42 average: momentum is weak and near oversold. A close under 3,830 targets 3,800 and the channel floor; a close above 3,960 would end the bearish view.
Setup: Short at 3,890, stop 3,925, targets 3,840, 3,800 and 3,750. Reward:risk 1.4 / 2.6 / 4.0, medium conviction. Cancel if a 4-hour close above 3,925, or if Warsh sounds clearly dovish and yields drop. Cancel if unfilled by 21:00 GMT today.
Silver (XAG/USD) | Investing.com quote, TVC chart feed
Silver Analysis: Price Falls 2.8% to $47.33 and Breaks Under the Early-November Low as Industrial Metals Weaken, With RSI 30.07 at Oversold
47.3312 −1.3658 (−2.80%) on the chart feed Previous close 48.6970 | Open 48.6970 | Range 47.1460 to 49.0700 | Comex silver 47.255 (−3.8%) at 08:42 GMT
Outlook: Bias is lower on bounces with low conviction while 49.60 caps. Silver is falling harder than gold because it trades as both a rate-sensitive metal and an industrial one, and copper’s drop on weak China data adds to the pressure. RSI sits right at oversold, so a relief bounce is likely and the idea waits for it near 48.60 rather than selling the low.

Key levels
- Support 2
- 45.50
- Support 1
- 46.50
- Resistance 1
- 48.50
- Resistance 2
- 49.60
- Price (47.3312) is under the 52.3412, 58.1456 and 60.0209 averages. Main catalysts: gold’s direction, the dollar index near 103.4 and Warsh at 17:00 GMT. The early-November swing low near 48.50 is now resistance.
- RSI 30.07 under its 34.27 average: momentum is oversold. A close under 46.50 opens 45.50 and the channel floor near 44.50; a close above 49.60 would end the slide for now.
Setup: Short at 48.60, stop 49.60, targets 47.30, 46.50 and 45.50. Reward:risk 1.3 / 2.1 / 3.1, low conviction. Cancel if a 4-hour close above 49.60, or if gold reclaims 3,960. Cancel if unfilled by 21:00 GMT today.
Copper (XCU/USD, $ per lb) | Investing.com quote, Capital.com chart feed
Copper Analysis: Price Drops Through the Rising Channel Floor at $6.11 to a Four-Month Low on Weak China Data, With RSI 31.62 Near Oversold
6.10974 −0.03500 (−0.57%) on the chart feed Previous close 6.14474 | Open 6.13824 | Range 6.08174 to 6.17099 | Other feeds were lower: Comex 6.03 (08:42 GMT), FXEmpire spot 5.999 (09:16 GMT), LME 3-month closed Friday at $13,351 a tonne (−1.87%)
Outlook: Bias is lower on bounces with medium conviction while 6.29 caps. China’s October industrial output rose 4.8% (forecast 5.3%), the dollar is strong and tech stocks are weak ahead of Nvidia results on Tuesday, and together they pushed copper through its 200-day average to a four-month low. FXEmpire flags that a break under $6 can open $5.00 to $5.20. Tight physical supply in China is the main support.

Key levels
- Support 2
- 5.90
- Support 1
- 6.00
- Resistance 1
- 6.20
- Resistance 2
- 6.28
- Price (6.10974) is under the 6.4799, 6.5580 and 6.6019 averages and below the broken channel floor near 6.25. Main catalysts: the dollar index, China demand headlines, the US open at 14:30 GMT and Warsh at 17:00 GMT.
- RSI 31.62 under its 41.36 average: momentum is weak and near oversold. A close under 6.00 opens 5.90; a close back above 6.28 would put the channel floor back in play.
Setup: Short at 6.20, stop 6.29, targets 6.05, 5.95 and 5.85. Reward:risk 1.7 / 2.8 / 3.9, medium conviction. Cancel if a 4-hour close above 6.29, or if China announces new stimulus. Levels use the Capital.com feed, which ran about 0.07 above Comex this morning, so adjust for your own feed. Cancel if unfilled by 21:00 GMT today.
WTI Crude Oil | Investing.com quote, TVC chart feed
WTI Crude Oil Analysis: Price Holds $88.41 on the 200-Day Support as Hormuz Mine Reports Collide With an IEA Surplus Forecast
88.41 −0.50 (−0.56%) on the chart feed Previous close 88.91 | Open 88.65 | Range 87.59 to 89.49 | Friday settlement 88.56 | Brent about 96.6 after a low of 94.32
Outlook: Bias is lower on bounces with low conviction while 92.20 caps. The Revolutionary Guards said two tankers hit mines in the Strait of Hormuz and reports mentioned an Iranian drone attack on a US base in Bahrain, which lifted Brent from a low of 94.32. Against that, the IEA expects a fourth-quarter surplus for the first time since the war began, Hormuz flows are close to pre-war levels and China’s October refinery runs fell 2% from September. Headline risk cuts both ways, so the idea sells a bounce rather than the low.

Key levels
- Support 2
- 86.00
- Support 1
- 87.90
- Resistance 1
- 90.00
- Resistance 2
- 91.50
- Price (88.41) is just above the 87.91 average and under the 94.77 and 94.87 averages. Main catalysts: Hormuz and Iran headlines, the dollar, and weekly US stock data on Wednesday. Goldman sees Brent averaging $88 in 2027.
- RSI 40.98 under its 45.78 average: momentum is soft. A close under 87.90 opens 86.00; a close above 92.20 would point to a retest of the 94.80 averages.
Setup: Short at 90.50, stop 92.20, targets 88.00, 86.00 and 84.00. Reward:risk 1.5 / 2.6 / 3.8, low conviction. Cancel if a 4-hour close above 92.20, or on a confirmed Hormuz closure or new strikes on Gulf supply. Cancel if unfilled by 21:00 GMT today.
Natural Gas Futures (December) | Investing.com quote, NYMEX chart feed
Natural Gas Analysis: Price Slides 4% to $3.097 Onto the Rising Wedge Trendline as Mild Weather and a Storage Surplus Weigh
3.097 −0.133 (−4.12%) on the chart feed Previous close 3.230 | Open 3.180 | Range 3.089 to 3.180 | Friday settlement about 3.23 after a 3.337 Thursday settle
Outlook: Bias is lower on bounces with medium conviction while 3.27 caps. December gas fell 3.2% on Friday after a 61 Bcf storage build that was 21 Bcf above normal and left stocks 54 Bcf above the five-year average. The EIA also cut its November to March Henry Hub forecast to $2.87, and production is recovering toward 113 Bcf/d. Record LNG feedgas limits the downside, but the rally looks like a short-covering move.

Key levels
- Support 2
- 2.95
- Support 1
- 3.01
- Resistance 1
- 3.18
- Resistance 2
- 3.23
- Price (3.097) is just above the 3.012, 2.971 and 2.950 averages and on the rising trendline. Main catalysts: weather model runs, LNG feedgas and the EIA storage report on Thursday 19 November.
- RSI 52.00 under its 53.95 average: momentum is neutral. A close under 3.01 breaks the wedge and targets 2.95; a close above 3.23 would reopen 3.34 and the 3.40 wedge top.
Setup: Short at 3.18, stop 3.27, targets 3.01, 2.95 and 2.85. Reward:risk 1.9 / 2.6 / 3.7, medium conviction. Cancel if a 4-hour close above 3.27, or if weather models turn sharply colder. Cancel if unfilled by 21:00 GMT today.
Wheat Cash Contract (¢ per bushel) | Investing.com quote, Pepperstone chart feed
Wheat Analysis: Price Eases to 601.5 Near the Channel Floor as Southern Hemisphere Harvests and a Firm Dollar Keep CBOT at Multi-Month Lows
601.5 −2.4 (−0.40%) on the chart feed Previous close 603.9 | Open 607.2 | Range 598.1 to 607.2 | CBOT most-traded wheat about 587.5 at 04:04 GMT, near Friday’s low of 582
Outlook: Bias is lower on bounces with low conviction while 626 caps. CBOT wheat is near its weakest since June and down about 26% from the early-September high, pressured by larger-than-expected Australian and Argentine harvests, weak US export sales and a firm dollar. Black Sea disruption and a large fund short are the risk, because they can fuel a sharp short-covering bounce. RSI is rising off oversold, so the idea sells strength near the 20-day average.

Key levels
- Support 2
- 588.0
- Support 1
- 598.0
- Resistance 1
- 614.0
- Resistance 2
- 625.0
- Price (601.5) is under the 613.8, 667.9 and 671.4 averages. Main catalysts: the dollar, Black Sea headlines, Southern Hemisphere harvest progress and the CBOT close at 19:20 GMT.
- RSI 34.44 over its 26.84 average: momentum is weak but turning up from oversold. A close under 598 opens 588 and the channel floor near 575; a close above 625 would end the bearish view.
Setup: Short at 614.0, stop 626.0, targets 598.0, 588.0 and 576.0. Reward:risk 1.3 / 2.2 / 3.2, low conviction. Cancel if a 4-hour close above 626, or on a Black Sea escalation that hits exports. Cancel if unfilled by 21:00 GMT today.
Conclusion
The dollar is at a 19-month high on Fed hike bets, so we prefer selling bounces in gold near 3,890, silver near 48.60, copper near 6.20, WTI crude near 90.50, natural gas near 3.18 and wheat near 614. Conviction is medium for gold, copper and natural gas and low for silver, WTI and wheat. The session risks are the Empire State index (13:30 GMT), Williams (14:05), the US open (14:30), Warsh (17:00) and Hammack (19:15), all still ahead. A 4-hour close above 3,925 in gold or above 6.29 in copper would change the picture.
Trade gold, silver, copper, oil, natural gas and wheat with Capital Street FX.
Frequently Asked Questions
What is the commodity outlook for today?
The dollar index is at a 19-month high on Fed hike bets, gold is at its lowest since October 2025, silver and copper are breaking lower, oil is split between Hormuz risk and a surplus forecast, and wheat is near multi-month lows. Fed Chair Warsh at 17:00 GMT is the main scheduled event.
Which commodity trade ideas are live today?
Short gold, silver, copper, WTI crude, natural gas and wheat on bounces, each with a stop and three targets valid until 21:00 GMT. Gold, copper and natural gas carry medium conviction and the other three low.
What time are the key events in GMT?
Empire State manufacturing is due at 13:30 GMT, Williams at 14:05, Warsh at 17:00 and Hammack at 19:15. The US open is at 14:30, the CBOT close at 19:20, setups expire at 21:00 and daily candles close at 22:00 GMT.
Why is gold falling?
A near-fully priced December Fed hike, Treasury yields near 5% and a dollar at a 19-month high raise the cost of holding gold, and strong US data has kept hike bets alive. Gold fell 4.5% last week and about 7% over four weeks, and sits at a more-than-one-year low.
Why is oil holding near $88 WTI?
Hormuz mine and attack reports are adding a risk premium, while the IEA’s fourth-quarter surplus forecast, near-normal Hormuz flows and weaker Chinese refinery demand are capping prices.