Trade FX, CFD, Stocks, BTC, Indices, Gold & Oil – 1:1000 Leverage & Bonus – CSFX

Mobile Header & Menu

Bitcoin at the Crossroads: Why $70,500 Is the Only Number That Matters When War Meets the Federal Reserve | The Capital Dispatch

March 9, 2026
CSFXadmin
Bitcoin at the Crossroads: Why $70,500 Is the Only Number That Matters When War Meets the Federal Reserve | The Capital Dispatch
Capital Street FX · CapitalStreetFX.com · Weekly Report Series
The Capital Dispatch
Week of March 9–15, 2026  ·  Crypto Edition  ·  Report 03 of 04
BITCOIN $68,800 · KEY LEVEL $70,500 · DO NOT TRADE ALTCOINS BELOW THIS LINE ETHEREUM $2,070 · FALLING WEDGE REVERSAL · BUY $2,020–2,050 · TP $2,380 KRAKEN APPLIES FOR FED MASTER ACCOUNT · BIGGEST CRYPTO REGULATORY SHIFT IN YEARS XRP $1.42 · CAUTIOUS LONG · TP $1.967 · SEC CASE RESOLVED 2025 SOLANA $88 · STRONG ECOSYSTEM · BUY $83–86 · TP $100+ LITECOIN $83 · HALVING CYCLE INTACT · BUY $80–83 · TP $95 ⚡ CRYPTO PIVOT: US CPI WEDNESDAY MARCH 11 · HOT = RISK-OFF · SOFT = RISK-ON SURGE COINCODEX BTC RANGE $70,350–$79,539 MARCH 2026 · CURRENT PRICE BELOW FORECAST BAND
Crypto Weekly · Report 03 · March 9–15, 2026

Bitcoin at the Crossroads:
Why $70,500 Is the Only
Number That Matters When
War Meets the Federal Reserve.

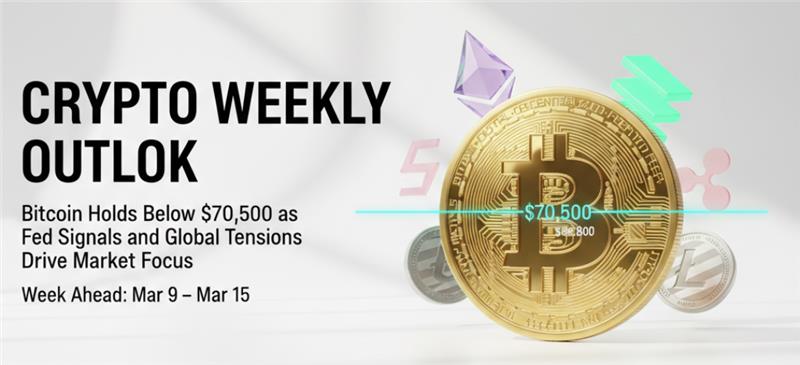
Bitcoin at $68,800 is sitting just below the structural key level that separates cautious optimism from confirmed bull continuation. Ethereum is tracing a falling wedge reversal. Kraken just applied for a Federal Reserve master account — the single most important regulatory development in crypto since the ETF approvals. Five assets, five setups, one macro framework that governs everything. This is the crypto playbook for the most complex week of Q1 2026.

■ Digital Assets By the Numbers — Friday March 7 Close
$68,800
Bitcoin BTC
Below Key $70,500 Level
$2,070
Ethereum ETH
Falling Wedge Reversal
$1.42
XRP
Cautious Long Setup
$88
Solana SOL
Buy $83–86 · TP $100
$83
Litecoin LTC
Halving Cycle Tailwind
$70,500
BTC Key Level
The Line Everything Depends On

The crypto market in the week of March 9–15, 2026 is operating under a three-way tension that has no clean resolution until Wednesday’s CPI print. Bitcoin is in a war premium tug-of-war — caught between safe-haven demand from the Iran conflict and risk-off selling pressure from a stagflation macro. Ethereum is forming one of the cleaner reversal setups it has produced in six months. And the Kraken Federal Reserve master account application is the regulatory event that every serious crypto participant should understand deeply, because it changes the structural landscape for the industry permanently.

Three rules govern every crypto trade this week, and if you cannot honestly answer yes to all three before entering any position, the correct answer is to wait. Bitcoin must be above $70,500 before any meaningful altcoin long is justified — this is not superstition, it is the consistent historical pattern of how capital flows through the crypto ecosystem. Standard position size should be reduced 30–50% until CPI resolves the macro ambiguity on Wednesday. And Wednesday’s CPI is not just an event to survive — it is the event that determines whether the risk-on trade is open or closed for the remainder of the week. These three rules are not suggestions. They are the structural architecture of professional crypto risk management in a binary-event environment.

■ Three Rules for the Week of March 9–15
1
BTC must clear $70,500 before any meaningful altcoin longs. Below this level, Bitcoin is not in confirmed bull continuation mode. Capital does not flow into altcoins while BTC is uncertain. Chasing XRP, SOL, or ETH while BTC sits below its key resistance is swimming upstream against the tide of how crypto liquidity actually moves.
2
Size down 30–50% on all positions until after Wednesday CPI. Binary macro events create non-linear price moves. A hot CPI can send BTC from $68,800 to $62,000 in a single session. A soft CPI can send it from $68,800 to $74,000+. Neither scenario is safe to be fully sized into before the number drops.
3
Wednesday’s CPI is the week’s only real decision. Every other analysis in this report tells you what to do after you know the CPI number. Pre-CPI, the trade is patience. Post-CPI, the playbook activates. Write your reaction plan before 8:30 AM ET Wednesday and commit to it.

Chapter 01 — Bitcoin BTC The $70,500 Line: Structural Gateway or Week-Long Ceiling?

Bitcoin at $68,800 is in a position that rewards patience and punishes impatience with unusual clarity this week. The $70,500 level is not arbitrary — it is the confluence of the prior range high that capped BTC in October 2025, the 50-day moving average on the daily chart, and the psychological significance of the $70,000 round number. Markets respect price levels that are simultaneously technically significant AND psychologically meaningful. $70,500 is both. What makes the current setup particularly important is that CoinCodex’s March 2026 forecast band of $70,350–$79,539 sits almost entirely above the current price — suggesting the market’s consensus expectation is for a breakout above this key level, while the actual price is testing the base of that forecast range.

The macro context creates the ambiguity. Bitcoin’s relationship with the Iran war is genuinely contested among serious analysts. The “digital gold” narrative — that Bitcoin is a safe-haven asset that benefits from geopolitical stress and dollar debasement — would argue for BTC to surge alongside physical gold’s 12% move since Operation Epic Fury. The reality so far has been more nuanced: BTC initially rallied approximately 8% in the days following the February 28 strikes, but has since given back most of those gains as the stagflation narrative — amplified by the −92,000 NFP print — reasserted risk-off pressure. Bitcoin in 2025 demonstrated increasingly consistent correlation with risk assets (Nasdaq, tech stocks) in the short term, which means a stagflation-confirming CPI print this week applies negative pressure through the risk-off channel, even if the inflation narrative is simultaneously positive for the longer-term “hard money” BTC thesis.

“Bitcoin’s CoinCodex forecast range of $70,350–$79,539 for March 2026 implies the current price of $68,800 represents a discount to the consensus expectation — but discounts to consensus only become trades when catalysts align. Wednesday’s CPI is that catalyst.”— CoinCodex March 2026 Model, via Capital Dispatch synthesis
Bitcoin (BTC/USD) — Technical Levels, Week of March 9–15
Current: $68,800 · Bias: Cautious Bull · Key Level: $70,500 must break for confirmation
$79,539 · CoinCodex Top
CoinCodex March Forecast High
$75,000 · Prior ATH Zone
TP2 · Strong Resistance
$72,500 · Next Resistance
TP1 Post-Breakout
$70,500 · THE KEY LEVEL ★
BREAKOUT TRIGGER — Watch this
$68,800 · Current Price
CURRENT — Below key level
$67,500–68,500 · Entry Zone
Buy-the-Dip Zone (cautious)
$65,000 · Stop Loss
Hard Stop — Below = Bearish
$62,000 · Hot CPI Scenario
Risk-Off Flush Target

◆ Trade Setup: BUY pullback $67,500–68,500 · SL $65,000 · TP1 $72,500 · TP2 $75,000 · Size at 50% normal pre-CPI · Scale in to full size on confirmed break above $70,500 with volume. Alternative: WAIT for $70,500 breakout then buy the first retest of that level as support.

🏦 Kraken + Federal Reserve — The Week’s Biggest Structural Story

Kraken’s application for a Federal Reserve master account — confirmed by multiple sources this week — is the single most consequential regulatory development in crypto since the Bitcoin and Ethereum ETF approvals. A Federal Reserve master account would allow Kraken to hold reserves directly at the Fed (rather than through a commercial bank intermediary), access the Fed’s payment systems in real time, and potentially offer crypto and fiat products with the same tier-one banking infrastructure as JPMorgan or Citibank. The strategic implications are profound: if granted, it normalises crypto exchanges as legitimate financial infrastructure at the highest regulatory level. Watch the reaction from traditional banking lobbyists — they will fight this vigorously, because a master account for Kraken is the beginning of the end of their monopoly on Federal Reserve access.

Chapter 02 — Ethereum ETH The Falling Wedge That Points Higher — If BTC Cooperates

Ethereum at $2,070 is forming what technical analysts classify as a falling wedge — one of the most reliably bullish reversal patterns in any asset class when it forms after a sustained downtrend. The anatomy of the pattern in ETH: from its December 2025 high of approximately $2,650, Ethereum has declined in a pattern where both the highs and the lows are declining, but the lows are declining more slowly than the highs. This creates a converging channel that slopes downward — the falling wedge. The pattern resolves when price breaks above the upper trendline of the wedge, typically with a surge of volume that represents buyers overpowering the gradually weakening selling pressure.

The fundamental case for Ethereum’s recovery complements the technical setup. The Pectra upgrade, deployed in Q4 2025, significantly increased the efficiency of ETH staking and reduced validator queue times — making staking yields more predictable and attracting institutional allocators. ETH staking yields of approximately 4.2% annually now compare favourably with US 10-year Treasury yields in a falling rate environment, a dynamic that was not available to institutional allocators during previous ETH cycles. Net ETH supply has been deflationary since the Merge in September 2022, and while EIP-1559 fee burns slowed during the lower-activity period of late 2025, the structural supply dynamic remains positive at higher network utilisation levels.

Ethereum (ETH/USD) — Falling Wedge Reversal Setup
Current: $2,070 · Pattern: Falling Wedge · Breakout target: $2,380+ · Condition: BTC above $70,500
$2,650 · Dec 2025 High
Prior Cycle High · TP3
$2,380 · Measured Move
Wedge Breakout Target · TP2
$2,200 · Upper Wedge
TP1 · Wedge Trendline Resistance
$2,070 · Current Price
CURRENT — Inside Wedge
$2,020–2,050 · Entry Zone
Buy the Wedge Low
$1,920 · Stop Loss
Hard Stop — Pattern Fails Here
$1,780 · Hot CPI Scenario
Risk-Off Flush

◆ Trade Setup: BUY $2,020–2,050 (wedge lower boundary) · SL $1,920 · TP1 $2,200 · TP2 $2,380 · TP3 $2,650 · Risk ~$130/ETH · Reward $150–600/ETH · R:R 1.2:1 to 4.6:1 · CONDITION: Only enter if BTC is above $70,500. At 40% normal size pre-CPI.

Chapter 03 — XRP Post-SEC Relief Meets a Macro Crossroads — Playing the Range

XRP enters the week of March 9 in a structurally cleaner position than it has occupied for years. The resolution of the SEC lawsuit in 2025 — with the court’s final ruling that XRP token sales on exchanges did not constitute securities transactions — removed the regulatory overhang that had suppressed XRP’s price relative to its actual utility metrics for more than three years. Since the ruling, Ripple’s institutional cross-border payment network has added 12 new central bank digital currency partnerships and expanded its RippleNet to cover 47 additional currency corridors.

The short-term technical picture is a range trade. XRP is consolidating between $1.37 support (the lower boundary of the post-SEC consolidation range) and $1.70 resistance (the upper boundary tested twice in January 2026 without a clean breakout). At $1.42, it sits in the lower third of that range — making it a cautious long rather than a high-conviction directional trade. The key for XRP is what happens to BTC and the broad crypto risk sentiment after Wednesday’s CPI. XRP behaves as a high-beta risk asset in short-term market moves — meaning it falls harder than BTC in a risk-off move and rises faster in a risk-on surge. The $1.967 psychological level (the prior year high) represents the medium-term bull target if the broader risk-on environment is confirmed.

XRP/USD — Technical Levels, Week of March 9–15
Current: $1.42 · Bias: Neutral / Cautious Long · Condition: BTC above $70,500 required
$1.967 · Year High · TP2
Prior Year High · Medium-Term Target
$1.70 · Range Top · TP1
Resistance Tested Twice
$1.60 · First TP
Initial Target
$1.42 · Current Price
CURRENT — Lower Range
$1.37–1.42 · Entry Zone
Buy Range Support
$1.28 · Stop Loss
Below Range Support = Exit

◆ Trade Setup: BUY $1.37–1.42 · SL $1.28 · TP1 $1.60 · TP2 $1.967 · Risk ~$0.14 · Reward $0.18–$0.55 · R:R 1.3:1 to 3.9:1 · CONDITION: BTC above $70,500. Size at 30% of normal — XRP carries 3–4× BTC’s volatility in short-term moves.

Chapter 04 — Solana & Litecoin Two Different Stories, One Shared Requirement: Bitcoin Above $70,500

Solana enters the week at $88 with one of the stronger fundamental backdrops in the altcoin complex. The Solana ecosystem’s daily active address count reached a new all-time high in February 2026, driven by the continued growth of its DeFi protocol suite (particularly Jito, Raydium, and Drift), a surge in new token launches on its launchpad infrastructure, and the network’s ability to sustain sub-second finality at scale without the congestion issues that plagued it in 2023. Institutional interest in Solana-based products has grown substantially following the approval of several spot Solana ETF applications in late 2025. The technical setup mirrors the fundamental strength: Solana is consolidating in a healthy base structure between $80 and $95, with the $83–86 zone representing the intersection of the 50-day MA and a prior breakout level that has held as support on three separate tests.

Litecoin at $83 is a different kind of trade — driven more by cycle mechanics than ecosystem fundamentals. The LTC halving cycle (the automatic reduction in miner rewards that occurs every four years) historically produces a price surge 6–12 months ahead of the halving event as the market begins pricing the reduced supply issuance. The most recent LTC halving occurred in August 2023, and the 2027 halving is beginning to appear on the medium-term horizon. At $83, LTC is consolidating in the $75–92 range with the $80–83 zone representing solid structural support. The trade thesis is simple: halving mechanics + BTC-correlated beta + any risk-on catalyst from Wednesday’s CPI. The trade does not require a fundamental narrative beyond the cycle dynamic.

Bitcoin BTC
● Cautious Bull
Buy $67,500–68,500 · SL $65,000 · TP $72,500/$75,000. Scale to full size only on $70,500 breakout. 50% size pre-CPI.
Ethereum ETH
● Neutral / Reversal Watch
Buy falling wedge $2,020–2,050 · SL $1,920 · TP $2,200/$2,380. Conditional on BTC above $70,500. 40% size pre-CPI.
XRP
● Cautious Long
Buy $1.37–1.42 · SL $1.28 · TP $1.60/$1.967. High-beta — 3–4× BTC vol. 30% size. BTC above $70,500 required.
Solana SOL
● Cautious Bull
Buy $83–86 · SL $78.50 · TP $100/$112. Strong ecosystem fundamentals. Wait for BTC confirmation before full-size entry.
Litecoin LTC
● Cautious Bull
Buy $80–83 · SL $75 · TP $95/$108. Halving cycle tailwind. Simple mechanics trade. BTC must cooperate.
Altcoin Season
● Not Yet
No broad altcoin season while BTC is below $70,500. Wait for confirmed BTC breakout, then rotate into ETH, SOL, XRP in that order.

Four Scenarios.
One Binary Event.
Wednesday, 8:30 AM ET.

The crypto market’s direction for the remainder of the week — and potentially for the balance of Q1 2026 — is contingent on a single data point. This is unusual clarity in what is usually a multi-variable analytical environment. Professional traders use binary-event environments to prepare, not to act impulsively. The four scenarios below should be written in your trading plan before Wednesday morning, not decided in the heat of the moment after the release.

40%
HOT CPI · +0.4%+ MoM · Risk-Off
Stagflation confirmed. Fed cannot cut. Risk-off selling hits crypto hard — BTC correlation with Nasdaq activates. DXY short squeeze amplifies crypto selling pressure. Fast, sharp, non-linear downmove.
BTC → $62,000–65,000
ETH → $1,780–1,900
XRP → $1.10–1.20
SOL → $72–75
LTC → $68–72
Action: REDUCE all positions immediately
35%
IN-LINE CPI · +0.3% · No Resolution
Market stays in holding pattern. BTC range-bound $67,000–$70,500. No altcoin season trigger. Eyes shift to FOMC March 18–19 as next potential catalyst. High volatility, no trend.
BTC → $67,000–70,500 range
ETH → $1,980–2,200 range
All pairs: two-way chop
Action: Maintain small positions, tight stops
15%
SOFT CPI · +0.2% or below · Risk-On
Rate cut narrative returns. Risk-on surge across all assets. BTC breaks $70,500 with conviction. Altcoin season conditions open. ETH falling wedge breaks upward. Highest-conviction crypto week of Q1.
BTC → $72,500–75,000
ETH → $2,200–2,380
XRP → $1.60–1.70
SOL → $100–108
LTC → $95–100
Action: Scale to full size, add altcoins
10%
IRAN ESCALATION · Gulf States · Chaos
Non-CPI risk. Oil spikes above $100. Emergency risk-off. BTC initially spikes as “digital gold” narrative activates, then reverses sharply as risk-off liquidity crisis overrides. Extreme volatility in both directions within hours.
BTC → +10% spike then −15% reversal
ETH → follows BTC but with amplification
Altcoins → avoid entirely
Action: No new positions. Protect capital.

Bitcoin Bull Case vs. Bear Case: Is the Crypto Market Ready for What Comes Next?

■ The Bitcoin Bull Case
Why BTC Breaks $70,500 and the Altcoin Season Opens
  • CoinCodex forecasts $70,350–$79,539 for March — current price is a discount to consensus expectation.
  • NFP −92,000 signals recession → Fed cuts → rate differentials compress → risk assets, including BTC, surge on lower rates.
  • Kraken Fed master account application begins a regulatory normalisation wave that reduces institutional risk premium on crypto allocation.
  • Bitcoin halving cycle is in the established bull phase — historically, BTC reaches its cycle peak 12–18 months after halving (April 2024 halving = peak late 2025 to mid-2026).
  • ETH/BTC ratio at historic lows → when BTC breaks up, ETH tends to outperform on the relative rotation.
  • On-chain data shows long-term holder (LTH) supply near cycle highs — patient money is not selling at these levels.
  • A soft CPI print (15% probability) produces the cleanest, strongest risk-on surge of Q1 — the asymmetric upside case.
■ The Bitcoin Bear Case
Why BTC Could Test $62,000 Before Any Recovery
  • BTC has failed to close above $70,500 for three consecutive weeks — repeated failure at the same resistance is a distribution signal, not accumulation.
  • NFP −92,000 is a recession signal — and in recessions, risk assets including crypto get sold for liquidity, not bought as alternatives.
  • Hot CPI (40% probability) triggers the most damaging scenario: Fed cannot cut, DXY short-squeezes, and crypto’s correlation with Nasdaq ensures it falls with tech.
  • BTC dominance remains elevated at 52% — altcoin season conditions are absent, suggesting weak market breadth and lack of conviction.
  • Iran war created a geopolitical risk premium, but BTC’s “digital gold” safe-haven narrative is not consistently supported by price action — it held in the 2022 Russia invasion episode, then reversed.
  • Spot Bitcoin ETF inflows have slowed materially from the peak levels of Q3 2025 — the institutional demand wave is not currently accelerating.
  • The most likely scenario (40% probability hot CPI) is the worst outcome for crypto — asymmetric downside in the base case.
■ The Capital Dispatch Analytical Verdict

The honest analytical assessment of the crypto market this week is that the base case probability-weighted outcome is slightly negative. The most likely single scenario (40% hot CPI) is also the worst for crypto. The second most likely (35% in-line) is range-bound and unresolved. The positive scenarios (15% soft CPI, which would be the best outcome) carry the least probability. This does not make crypto uninvestable this week — it makes position sizing and pre-defined stop losses the most critical variables, not which asset to buy.

The structural bull case for Bitcoin over the medium term (6–18 months) remains intact. The halving cycle, regulatory normalisation (Kraken master account being the latest signal), and the potential for 2–3 Fed cuts in 2026 are all genuinely positive for crypto. The problem is the short-term: the macro environment between now and the FOMC on March 18–19 is the most hostile it has been for risk assets in Q1. Stagflation does not create good conditions for speculative assets, regardless of the longer-term thesis.

The correct position for most traders: small long in BTC at $67,500–68,500 with a $65,000 stop. Prepare your altcoin shopping list. Wait for $70,500 to break on volume before executing any of it. Wednesday is not a day for bold positions. It is a day for patience and pre-prepared reaction plans.

Frequently Asked Crypto Questions

Six questions every experienced crypto trader is asking this week — answered in full.

Is Bitcoin genuinely a “safe haven” like gold, or does the Iran war actually hurt it? +
This is the most contested empirical question in the crypto analyst community right now, and the honest answer is that the evidence is genuinely mixed — not because analysts are hedging, but because Bitcoin’s behaviour across different crisis types has been inconsistent. The “digital gold” safe-haven narrative has the strongest support in two specific scenarios: (1) currency crises in emerging markets (Turkey, Argentina, Nigeria — in every case, local BTC adoption surged as citizens fled depreciating fiat), and (2) mild risk-off events where the dollar weakens, real yields fall, and investors look for non-sovereign stores of value. In these scenarios, BTC behaves like gold. The narrative has weaker support in two other scenarios: (1) acute liquidity crises (March 2020 COVID crash, November 2022 FTX collapse) where BTC was sold alongside equities as investors raised cash, and (2) stagflation environments where risk-asset correlation dominates the safe-haven narrative. The current Iran war + NFP miss environment is type 2 for short-term price action: acute risk-off pressure from stagflation concerns is temporarily dominating the longer-term hard-money narrative. The medium-term (3–6 month) case for BTC as a beneficiary of dollar debasement and Fed rate cuts is intact. The short-term (this week) case is contested. The practical implication: treat BTC as a risk asset for position sizing and stop-loss purposes this week, while maintaining the structural thesis for your long-term allocation.
Why does $70,500 specifically matter so much for altcoins — isn’t that somewhat arbitrary? +
The $70,500 level is not arbitrary — it is the product of three converging market structures that happen to cluster at the same price. First, it is the prior range high that capped BTC in October 2025 — in technical analysis, prior highs become resistance because that is the price at which the most recent wave of sellers entered the market. Until buyers can absorb all those sellers, the price cannot sustain above that level. Second, it is approximately where the 50-day moving average currently sits — a momentum indicator that institutional algorithmic trading systems use as a systematic entry and exit trigger. When price and MA levels converge with prior highs, you get triple-validated resistance. Third, it sits just above the $70,000 psychological level — and round numbers matter in markets because a significant proportion of limit orders are placed at them (buy orders below, sell orders above). The altcoin connection is empirical rather than theoretical: when you examine the historical data from the 2020–2021 bull cycle, the 2023–2024 cycle, and the early 2026 cycle, BTC dominance consistently falls (altcoins outperform) only after Bitcoin has convincingly broken its prior cycle resistance levels. Before that break, capital stays in BTC because institutional and sophisticated retail investors prioritise the more liquid, lower-volatility asset until the bull trend is confirmed. After the break, the “alt season rotation” occurs as the same participants take BTC profits and redeploy them into higher-risk, higher-upside altcoins. $70,500 is the door to that rotation — it is not open yet.
What exactly is Kraken’s Federal Reserve master account application and why does it matter for crypto prices? +
A Federal Reserve master account is the foundational infrastructure of the US banking system. Every FDIC-insured bank — JPMorgan, Bank of America, Wells Fargo — holds a master account at the Federal Reserve. This account allows them to: settle transactions directly in Fed funds (the most risk-free form of dollars in existence), access the Fed’s Fedwire system for same-day large-value transfers, participate in the Fed’s overnight repo and reverse repo operations, and receive Fed interest on excess reserves. Currently, crypto exchanges like Kraken must hold their customers’ dollar balances at commercial banks — introducing bank counterparty risk (as Silvergate, Signature, and Silicon Valley Bank’s failures demonstrated in 2023, when crypto firms lost access to their banking rails overnight). A Fed master account for Kraken would eliminate that intermediary. Kraken’s dollars would sit directly at the Fed — the safest possible counterparty. The price implications work through several channels. Direct: reduced counterparty risk in crypto infrastructure increases institutional confidence in holding large positions on exchanges, increasing market depth and potentially reducing liquidity premiums. Indirect: a granted master account represents the highest-level regulatory endorsement of a crypto exchange as legitimate financial infrastructure — the equivalent of a de facto banking licence at the Federal Reserve level. This signals to pension funds, sovereign wealth funds, and other regulated institutional investors that crypto exchange infrastructure now meets the same safety standard as the banks they already use. The practical near-term price effect is probably modest ($2,000–3,000 BTC positive on confirmation), but the medium-term structural significance is large — it normalises the infrastructure layer of the crypto economy permanently.
Why is Ethereum’s falling wedge considered bullish when the price has been declining? +
The falling wedge’s bullish interpretation is counterintuitive to traders who associate falling prices with bearishness — but the pattern is bullish precisely because of the nature of the decline it produces. The key characteristic of a falling wedge that distinguishes it from a straight downtrend is that each successive decline is smaller than the last. The lower trendline (support) is descending more slowly than the upper trendline (resistance). This converging structure tells you something important about market psychology: while sellers are still in control and pushing the price lower, they are becoming progressively weaker. Each new wave of selling produces a smaller price decline, requiring less buying pressure to halt it. Volume typically declines throughout the pattern as well — sellers are becoming exhausted. The pattern resolves when the final wave of selling fails to produce a new low and buyers, who have been absorbing the diminishing selling pressure throughout the pattern, finally overpower the remaining sellers and break above the upper trendline. This break is typically accompanied by a sharp volume surge — representing the release of pent-up demand that was building throughout the consolidation. For Ethereum specifically, the wedge formed over approximately 14 weeks from December 2025 through March 2026, declining from $2,650 to the current $2,070 — a 22% decline within the wedge. This produces a measured move target of approximately $2,380 (the height of the wedge added to the breakout point). The critical caveat: the wedge requires BTC above $70,500 to be a viable trade, because a BTC breakdown would invalidate the pattern regardless of its internal structure. A falling wedge in ETH within a BTC bear move is just a downtrend.
Should I be in Solana or Ethereum as my primary altcoin position, and what’s the deciding factor? +
The ETH vs SOL decision for the week of March 9–15 comes down to three distinct questions that determine which is right for your specific situation. The first question is time horizon. If your holding period is 2–4 weeks, Ethereum has the cleaner technical setup right now — the falling wedge gives you a defined entry ($2,020–2,050), a defined stop ($1,920), and a defined first target ($2,200). The setup is complete and executable. Solana’s setup is also valid (base structure $83–86 entry, $78.50 stop) but the pattern is less precisely defined and more dependent on general risk-on conditions without a specific reversal trigger. If your holding period is 3–12 months, Solana has arguably the stronger fundamental growth case — its daily active address count, DeFi TVL, and developer ecosystem metrics are all growing faster than Ethereum’s in absolute percentage terms, even if Ethereum retains the larger absolute base. The second question is volatility tolerance. Solana carries approximately 1.3–1.5× the volatility of Ethereum in equivalent market conditions. If you size both positions to the same dollar risk (as you should), this means your SOL position will be smaller in nominal token terms. The third question is ecosystem alignment. If you hold or plan to hold DeFi positions in Solana-native protocols (Jito, Raydium, Drift), an SOL position is a natural portfolio complement. If your broader portfolio is more Ethereum-aligned (staked ETH, L2 exposure, ETH-based DeFi), an ETH position adds less concentration risk. For most traders this week, the honest answer is: small positions in both, sized to the same dollar risk, conditional on BTC breaking $70,500, with no shame in holding neither until after CPI. The choice between ETH and SOL is less important than the discipline of not being oversized in either.
How should stagflation — high inflation plus slow growth — affect a long-term Bitcoin holder’s conviction? +
Stagflation is actually one of the most analytically interesting environments for long-term Bitcoin conviction, because the 1970s precedent — the only comparable episode in the modern era — produced the greatest bull market in the history of gold, which is the asset Bitcoin most directly positions itself as the digital successor to. The mechanism works as follows: stagflation erodes the purchasing power of cash and short-duration bonds (inflation is eating the nominal returns). It also erodes the value of long-duration bonds (rising inflation expectations push yields up, reducing bond prices). Equities suffer from margin compression (rising input costs + slowing demand) AND from rising discount rates applied to future earnings. Real estate is mixed — a partial hedge but illiquid and vulnerable to credit tightening. This systematic erosion of every traditional store of value is precisely the environment in which gold went from $35 in 1971 to $850 in 1980. Bitcoin, if the “digital hard money” thesis is correct, should perform analogously in the contemporary stagflation episode. The significant caveat for short-term traders: in the initial phase of a stagflation recognition (the phase we are in now), risk-asset correlation dominates. The market sells everything — including BTC — as the realisation of the macro environment causes position liquidation. The conviction case for long-term holders is that the liquidation phase is a buying opportunity, not a thesis invalidation. If you believe in BTC’s hard money properties over a 2–5 year horizon, a $62,000 BTC during a stagflation panic is a better entry, not a worse one. The challenge is psychological: when the price is falling and the macro news is bad, the conviction thesis feels weakest at precisely the moment it should feel strongest. That asymmetry between emotional experience and analytical reality is where long-term alpha is actually generated.

Conclusion: One Key Level. One Data Point. Five Trades That All Depend on the Same Answer.

The crypto market of March 9–15, 2026 is defined by an unusual analytical simplicity beneath the surface complexity. Everything — Bitcoin’s direction, Ethereum’s wedge resolution, XRP’s range break, Solana’s ecosystem momentum, Litecoin’s halving trade — depends on two sequentially linked answers. First: does BTC break $70,500 with conviction? Second, and prior to that: does Wednesday’s CPI give it permission to do so?

The structural bull case for Bitcoin over 6–18 months is intact. The halving cycle is in the established bull phase. Regulatory normalisation — exemplified by the Kraken master account application — is reducing the institutional risk premium on crypto allocation. The Fed is closer to cutting than hiking, and every cut compresses the opportunity cost that competing with Bitcoin’s non-yielding nature. These are not short-term trading narratives. They are structural forces that operate over quarters, not weeks.

The tactical picture this week is more challenging. The most likely single CPI outcome (40% hot) is the worst for crypto. BTC has failed to close above $70,500 for three consecutive weeks. Stagflation — the confirmed macro environment — is historically an environment where risk-asset correlations dominate the hard-money narrative in the short term, even while supporting it in the long term.

The correct response to this tension is not paralysis — it is precision. Small long in BTC. Prepare your altcoin list. Have your CPI reaction plan written before Wednesday morning. Size every position to survive the hot CPI scenario without a material account drawdown. The medium-term thesis will be right. This week, it is the risk management that determines whether you are still in the trade when it is.

In crypto, the difference between a good trader and a great one is rarely the thesis. It is almost always the position size and the stop loss on the three days the thesis is temporarily wrong.

Published March 9, 2026 by The Capital Dispatch at Capital Street FX (capitalstreetfx.com). For informational and educational purposes only. Not financial advice. Not investment guidance. Crypto assets are highly speculative and volatile. Sources: CoinCodex, CoinDesk, Glassnode, Delphi Digital, Bloomberg Crypto, Federal Reserve, Prime Market Terminal.

■ Key Takeaways

01
$70,500 is the gateway. BTC must close above it before any meaningful altcoin position is justified. Not a suggestion — a rule.
02
Size down 30–50% pre-CPI. Wednesday’s print can move BTC ±10% in a single session. Survive first, profit second.
03
ETH falling wedge is the cleanest altcoin setup — defined entry, stop, and target. Conditional on BTC cooperating.
04
Kraken’s Fed master account is the week’s most important structural story. Medium-term bullish for crypto infrastructure.
05
The base-case CPI outcome (40% hot) is the worst for crypto. Asymmetric downside risk demands conservative sizing.
06
SOL and LTC are valid setups — buy $83–86 and $80–83 respectively — but only after BTC breaks $70,500.
07
The medium-term BTC bull case is intact. Halving cycle + Fed cuts + regulatory normalisation. This week is about surviving to participate in it.
THE CAPITAL DISPATCH  ·  CAPITAL STREET FX  ·  capitalstreetfx.com  ·  All information for educational purposes only  ·  Not financial advice  ·  Not investment guidance  ·  March 9, 2026