Bitcoin: From $0.0008 to $126,198 — Complete History, Halving Cycles & 2026 Forecast | Capital Street FX
Long-Form · Bitcoin Special Edition
Bitcoin: $0.0008
to $126,198 —
What Comes Next.

In 17 years, Bitcoin went from a cryptography mailing list to a $1.35 trillion asset held by sovereign governments, BlackRock, JPMorgan, and the United States Treasury. It has crashed more than 80% four times. It has recovered to new all-time highs every single time. Now, at $67,500 — 47% below its October 2025 peak — the question is whether this is the dip before the next mountain, or the beginning of the last descent.
Oct 6, 2025
Mar 9, 2026
ATH
Mar 2026
Strategy (Saylor)
Strategic Reserve
Forever · 95% Mined
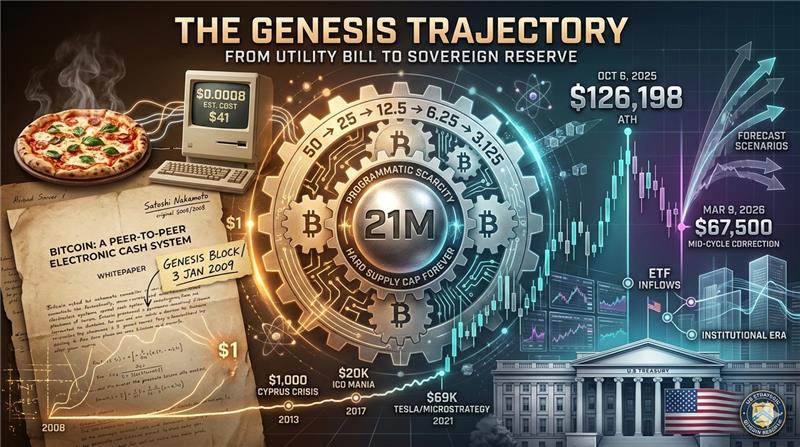
No financial asset in recorded history has produced returns like Bitcoin. From $0.0008 in October 2009 to $126,210 on October 6, 2025, that is a gain of 157,762,400%. And in that same journey, Bitcoin has suffered four separate crashes of more than 80%. It has been declared dead more than 400 times. Every time, it came back higher. This is the full story — and what traders need to know right now.
On October 31, 2008 — in the wreckage of the worst financial crisis since the Great Depression — an anonymous person or group calling themselves Satoshi Nakamoto published a nine-page whitepaper to a small cryptography mailing list. The title: “Bitcoin: A Peer-to-Peer Electronic Cash System.” Most readers dismissed it. A handful were curious. Fewer still understood that those nine pages contained the blueprint for the most consequential monetary experiment in five hundred years.
Satoshi’s genius was not purely technical. The genesis block — mined on January 3, 2009 — contained a hidden message: “The Times 03/Jan/2009 Chancellor on brink of second bailout for banks.” It was a timestamp, a mission statement, and a provocation. Bitcoin was built explicitly as an alternative to a financial system that had just revealed its catastrophic fragility. Every design choice — the 21 million supply cap, the halving schedule, the proof-of-work consensus — was a direct rebuke of the world Satoshi watched collapse in 2008.
Bitcoin (BTC) is a decentralised digital currency with a hard-capped supply of 21 million coins, secured by a proof-of-work blockchain, with no central issuer or controlling authority. Key properties: Fixed supply — unlike all fiat currencies, no one can create more Bitcoin beyond 21M. Decentralised — no government, bank, or company controls it. Programmatic scarcity — the halving mechanism reduces new supply every four years. Border-free — sent anywhere in minutes without a bank or permission. Often called “digital gold” — it combines gold’s scarcity with the portability of a text message.
When Bitcoin launched on January 9, 2009, it had no price. There was no exchange. There was no market. The first recorded price — $0.0008 per Bitcoin — was calculated by New Liberty Standard in October 2009 based purely on the electricity cost to mine one coin. Bitcoin’s first valuation was a utility bill.
The first real-world transaction happened on May 22, 2010. Florida programmer Laszlo Hanyecz paid 10,000 BTC for two Papa John’s pizzas — valued at approximately $41. At October 2025 peak prices, those 10,000 BTC would have been worth $1.26 billion. Bitcoin Pizza Day, commemorated every May 22nd, remains the most expensive lunch in human history. More importantly, it proved Bitcoin could buy real things — the moment that changed everything.
May 22, 2010: Laszlo Hanyecz posted on BitcoinTalk: “I’ll pay 10,000 bitcoins for a couple of pizzas.” Those coins — worth $41 at the time — would be worth approximately $670 million at current 2026 prices, and $1.26 billion at the October 2025 all-time high. The transaction established Bitcoin as a medium of exchange. Every subsequent Bitcoin transaction owes a conceptual debt to those two pizzas.
Bitcoin reached $1 per coin in February 2011. By June 2011, it surged to $31.91 on Mt. Gox. Then it collapsed 94% to approximately $2. Bitcoin’s first major bear market arrived — complete with its first wave of obituaries. The network ignored them all and kept producing blocks every ten minutes.
The single most important concept for any Bitcoin trader is the halving. Every 210,000 blocks — approximately every four years — the reward paid to miners for adding a block to the blockchain is cut in half. When Bitcoin launched in 2009, miners received 50 BTC per block. After the first halving in November 2012, that became 25. Then 12.5. Then 6.25. After April 2024, it became 3.125 BTC. The next halving, expected around 2028, will reduce it to 1.5625 BTC.
The economic logic is elegant: as daily issuance of new Bitcoin falls, and if demand remains constant or grows, price must rise to equilibrate. This is supply shock engineered in code — not decreed by a central bank. Bitcoin’s annual inflation rate after the 2024 halving dropped below 1% — lower than gold, lower than any fiat currency, and on a path toward zero. Every previous halving has been followed by a new all-time high within 12–18 months.
Halving
Date
Block Reward
BTC Price
Cycle Peak
Every serious Bitcoin trader must internalise one truth: Bitcoin can — and has — fallen more than 80% from its all-time high without dying. It has done this four times. And four times, it has recovered to set a new all-time high. Understanding the anatomy of these crashes is not pessimism. It is the price of admission for rational participation in this market.
| Bear Market | Peak | Bottom | Drawdown | Duration | Catalyst | Recovery ATH |
|---|---|---|---|---|---|---|
| Bear #1 — 2011 | $31.91 | $2.00 | –94% | 5 months | Mt. Gox hack; speculation implosion | $1,163 (2013) |
| Bear #2 — 2013–15 | $1,163 | $200 | –83% | ~18 months | China ban; Mt. Gox bankruptcy; Silk Road closure | $19,783 (2017) |
| Bear #3 — 2017–18 | $19,783 | $3,200 | –84% | ~12 months | ICO bubble; regulatory crackdowns; futures unwind | $68,789 (2021) |
| Bear #4 — 2021–22 | $68,789 | $15,479 | –77% | ~12 months | Luna/Terra collapse; FTX bankruptcy; Fed rate hikes | $126,210 (2025) |
| Bear #5 — 2025–26? ★ | $126,210 | ~$65K (so far) | –47% ongoing | 5 months (so far) | Post-ATH correction; Iran war; macro uncertainty; ETF outflows | $??? — TBD |
Risk Warning: Historical recovery from bear markets does not guarantee future performance. If the current correction follows the 2022 pattern, a further fall to $50,000–$60,000 remains possible before a bottom forms. Risk management and position sizing are essential. This is not financial advice.
The defining transformation of the 2024–2025 cycle was not the halving. It was the institutions. For Bitcoin’s first five cycles, price was driven overwhelmingly by retail speculation. The 2024–2026 cycle is different in kind, not just degree. For the first time, the entities driving price are sovereign governments, global asset managers, and publicly traded corporations with billions in mandated purchasing programmes.
The SEC’s approval of 11 spot Bitcoin ETFs was the most consequential regulatory event in cryptocurrency history. In the 12 months following approval, these ETFs absorbed over $50 billion in net inflows. BlackRock’s iShares Bitcoin Trust (IBIT) became the fastest ETF to reach $10 billion in assets in history. By February 2026, IBIT’s AUM stood at $54.12 billion. Wells Fargo now accepts BTC as Tier 1 collateral. The institutional era is not arriving. It has arrived.
Michael Saylor — executive chairman of Strategy (formerly MicroStrategy) — is the most consequential individual in Bitcoin’s institutional adoption story. As of February 2026, Strategy holds 714,644 BTC — acquired at an average cost of $76,056 per coin for a total outlay of approximately $54.4 billion. That represents over 3.4% of Bitcoin’s entire 21 million hard-capped supply.
On March 6, 2025, President Trump signed an executive order creating the US Strategic Bitcoin Reserve. The US holds approximately 328,372 BTC as of February 2026 — the largest known state holder globally. The reserve uses only forfeited/seized Bitcoin, not taxpayer funds. The government has explicitly committed to not selling these coins. Combined with Strategy’s 3.4%, that is nearly 5% of all Bitcoin permanently off the market.
Unlike traditional assets, Bitcoin’s blockchain is fully transparent. Every transaction, every wallet balance, every exchange inflow and outflow is recorded permanently and publicly. Experienced traders use on-chain data to read the behaviour of large holders, assess market sentiment, and identify accumulation or distribution phases.
Bitcoin vs Gold:
The Digital vs Physical Showdown
The “digital gold” narrative is Bitcoin’s most powerful marketing victory and its most contested claim. Bitcoin bulls argue it does everything gold does — better. Gold bulls argue Bitcoin lacks 6,000 years of trust, zero technology dependency, and physical permanence. The market treats them as complementary rather than competitive.
Bitcoin entered March 2026 at approximately $67,500 — down 47% from its October 2025 ATH of $126,210. The question consuming every professional trader, hedge fund, and retail investor: is this a mid-cycle correction before a renewed assault on $150,000+, or the beginning of a full 4-year bear cycle that sends Bitcoin back to $40,000 or below?
The answer depends critically on which historical analogue applies. If this cycle follows 2021’s pattern — where Bitcoin peaked in November, corrected 50%+ by May 2022, then crashed to $15K by November 2022 — the worst is still ahead. If it follows the 2019 mid-cycle correction — where Bitcoin peaked at $14K, corrected 56% to $6,500, then resumed its bull run to $69K in 2021 — then the bottom may already be in.
- Analogue A — 2019 Mid-Cycle: Peak → –56% → 3 months → New ATH within 18 months. Bullish. Implies ~$65K floor, $150K+ target by late 2026/early 2027.
- Analogue B — 2022 Full Bear: Peak → –77% over 12 months → 2-year recovery. Bearish. Implies potential fall to $40K–$55K before bottoming.
- Key differentiator: The 2022 bear was driven by fundamental systemic failure — Terra/Luna $60B implosion and FTX $8B fraud. The current correction has no comparable structural catalyst. Analogue A appears more likely — but Analogue B cannot be dismissed.
| Institution / Analyst | 2026 Target | Bull Case | Bear Floor | Thesis |
|---|---|---|---|---|
| J.P. Morgan Global Research | $170,000 | $266,000 | $78,500 | ETF penetration depth; Bitcoin-to-gold volatility ratio improving |
| Standard Chartered | $150,000 | $200,000 | $80,000 | Institutional capital now cycle-defining; corporate treasury adoption accelerating |
| Bernstein Research | $150,000 | $225,000 | $75,000 | Post-halving supply dynamics; ETF structural demand floor now established |
| Citibank | $143,000 | $189,000 | $78,500 | ETF capital influx; new regulatory frameworks reducing institutional friction |
| Tom Lee (Fundstrat) | $200,000–$250,000 | $500,000 | $75,000 | Expanding allocation channels (pensions, endowments, sovereign wealth funds) |
| Ark Invest (Cathie Wood) | $200,000+ | $1.5M (2030) | $70,000 | Global reserve asset thesis; “digital gold” reaching institutional saturation |
| Morgan Stanley | $60,000–$75,000 | $100,000 | $35,000 | “Autumn phase” of four-year cycle; cycle exhaustion; profit-lock advised |
| Fidelity Investments | $65,000–$90,000 | $120,000 | $40,000 | “Dormant year” thesis; 2025 met expectations; 2026 consolidation year |
| Arthur Hayes (BitMEX) | $124,000–$200,000 | $250,000+ | $60,000 | Fed money-printing directly fuels scarce assets; monetary debasement supercycle |
Three structural catalysts will define Bitcoin’s trajectory over the next four to five years — and none of them are speculative. They are arithmetic. (1) The 5th halving (~2028) will reduce daily issuance to ~225 BTC/day — a level at which even modest ETF demand would create severe supply scarcity. (2) The US $9T debt maturity wall in 2026 forces the Federal Reserve toward monetary accommodation, historically the single most bullish macro catalyst for Bitcoin. (3) The global pension allocation wave has barely started: if just 1% of the $50 trillion global pension market allocates to Bitcoin, that is $500 billion of structural demand entering an asset with 19.9 million coins and a hard cap of 21 million.
October 6, 2025
March 2026
Since Jan 2024
Fastest ETF Growth Ever
Post-4th Halving
in 2026
Forever — Unbreakable
Will Be Mined
Is $67K the Last Cheap Bitcoin You’ll Ever See — Or the Beginning of a Deeper Fall?
Here is what the data says — without the hype, without the fear. Bitcoin at $67,500 in March 2026 is sitting 47% below its all-time high. It is trading below Strategy’s average acquisition cost ($76,056). It has triggered “Extreme Fear” on sentiment indicators. Exchange reserves are at multi-year lows. Whales are accumulating. And the largest institutions on earth — JPMorgan, Citi, Standard Chartered — all have price targets above $140,000 for year-end 2026.
✓ Supply shock is mathematical: ETF daily demand (~1,500–3,000 BTC/day at peak flows) vs post-halving daily issuance (~450 BTC/day).
✓ Institutional mandate expanding: Pensions, endowments, sovereign wealth funds just beginning to allocate. Even 0.5% of global pension AUM ($50T) = $250B entering Bitcoin.
✓ US debt crisis = monetary easing: A $9T debt maturity wall forces the Fed toward accommodation. Every dollar of QE historically lifts Bitcoin.
✓ 5th halving approaching (~2028): Markets discount halvings in advance. Accumulation phase typically starts 18–24 months before.
✕ BlackRock systemic risk: The March 2026 BlackRock $1.2B liquidity crunch raised fears of forced IBIT liquidations. TradFi stress transmitting into crypto is a new risk vector.
✕ Cycle length exhaustion: Morgan Stanley’s “autumn cycle” thesis has historical support. The 2021–2022 peak-to-bottom lasted 12 months. The current correction is only 5 months old.
✕ Macro hard landing: February 2026 NFP came in at –92,000. A recession scenario could send Bitcoin to $45K–$55K before institutional dip-buyers materialise.
✕ The 1980 warning: Gold peaked in January 1980 and didn’t recover for 27 years. Complacency about recovery timelines is dangerous.
Frequently Asked Questions
Conclusion: The Most Volatile Asset in History — and the Most Resilient
In January 2009, Satoshi Nakamoto embedded a newspaper headline into Bitcoin’s first block: the Chancellor on the brink of a second bank bailout. Seventeen years later, that first block is still producing its scheduled outputs. The same cryptographic rules that governed it then govern it now. Not one character of code has been changed by force or fiat. No government has cancelled it. No central bank has controlled it. And its price — from $0.0008 to a peak of $126,210 — is the most extraordinary documented return in the history of capital markets.
But Bitcoin’s story is not a smooth ascent. It is a series of near-death experiences, each more dramatic than the last, each followed by a recovery that silenced the obituaries. The four bear markets — –94%, –83%, –84%, –77% — tested the conviction of even the most committed long-term holders. The crashes were real. The portfolios destroyed were real. And yet the network kept running. The halving kept happening. The supply kept tightening. The institutions kept coming.
As of March 2026, Bitcoin sits at $67,500. To some, this feels expensive. To others, it feels cheap — because if the institutional adoption thesis is correct, and Wall Street’s forecasts of $150,000–$250,000 for year-end 2026 are directionally right, then today’s price is the starting gun of the next phase, not the finish line of the last one.
The 2028 halving approaches. The US debt wall looms. The Federal Reserve faces impossible choices. Sovereign nations are quietly accumulating. The supply is almost entirely mined. And somewhere, in a cold wallet that has not moved since 2009, one million Bitcoins sit untouched — Satoshi’s silent, permanent statement about what money should be: finite, decentralised, and impossible to control.
Whatever happens to Bitcoin’s price in 2026, 2027, or 2030 — the network will keep producing blocks every ten minutes. It has done so 900,000+ times without missing a single one. That, more than any price target, is Bitcoin’s answer to every question about its future.
Published March 9, 2026 by The Capital Dispatch at Capital Street FX (capitalstreetfx.com). For informational and educational purposes only. Not financial advice. Sources: Coinbase, Fortune, Investing.com, InvestingHaven, CryptoOfficiel, Wikipedia, The Block, TradingKey, Changelly, StealthEX, Bitget Academy, VanEck, Bitcoin Suisse, LCX, AltcoinInvestor.
■ Key Takeaways
This report is produced for informational and educational purposes only. Nothing in this publication constitutes investment advice, a personal recommendation, or an offer or solicitation to buy or sell any financial instrument. Trading in Bitcoin, cryptocurrencies, CFDs, and leveraged products carries a high level of risk and may not be suitable for all investors. The value of investments can fall as well as rise, and you may lose more than your initial deposit. Past performance is not a reliable indicator of future results. You should seek independent financial advice before making any trading or investment decisions. All market data sourced from: Coinbase, Fortune, Investing.com, InvestingHaven, TradingKey, Wikipedia, The Block, Changelly, Bitget, VanEck, Bitcoin Suisse, Standard Chartered, J.P. Morgan, Ark Invest, Fidelity — data as of March 9, 2026.