Capital Street FX Crypto Market Analysis — March 31, 2026 | BTC, ETH, XRP, SOL
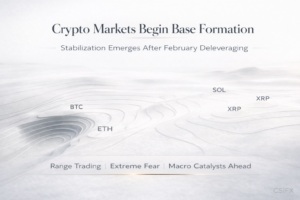
Crypto Daily Market Analysis
March 31, 2026
BTC/USD · ETH/USD · XRP/USD · SOL/USD · Tuesday, 31 March 2026
Live Price Snapshot
Price source: TradingView / CoinDesk · Prices as of 13:00 GMT, March 31, 2026. Chart data from CSFX TradingView workspace.
Fundamental Analysis
The Federal Reserve held the federal funds rate at 3.50%–3.75% at the March 18, 2026 FOMC meeting in an 11-to-1 vote, with only Governor Stephen Miran dissenting in favour of a 25bp cut. The March Summary of Economic Projections delivered one of the most significant upward inflation revisions in recent cycles — headline PCE was raised 30 basis points to 2.7% for 2026, while core PCE was revised up 20 basis points to 2.7%, largely reflecting oil-driven price pressures from the Strait of Hormuz supply disruption and persistent services inflation.
The median dot plot continues to project one 25bp cut in 2026 and one further cut in 2027, keeping the end-2026 target midpoint at 3.40%. Real GDP growth was nudged higher to 2.4% for 2026, and unemployment is expected to hold at 4.4% through year-end. The key implication for crypto markets is clear: the rate cut cycle that was widely anticipated to begin in Q1 2026 has now been pushed firmly into H2 2026. This higher-for-longer environment raises the opportunity cost of holding non-yielding assets and has been a primary driver of the sustained drawdown from Bitcoin’s $126,073 October 2025 ATH.
The 10-year Treasury yield sits at 4.27% as of March 18, with the 30-year at 4.88%. This yield structure continues to attract capital away from risk assets. However, a notable counternarrative is developing: with the stablecoin supply at a record $316 billion and Bitcoin exchange reserves at a seven-year low of 2.21 million BTC, the sideline capital sitting in the ecosystem is historically large — a precondition that has preceded major cycle reversals in late 2015, late 2018, and mid-2022. The NFP report on April 3 is the next major data point that could materially reprice the probability of a June or July cut.
Bitcoin enters the final day of Q1 2026 at $66,875, representing a 47% drawdown from the October 2025 ATH of $126,073. The asset has printed six consecutive red monthly candles since that peak, yet several structural factors complicate a straightforward bearish read. US-listed spot Bitcoin ETFs hold approximately $86.9 billion in AUM, roughly 6% of the total circulating supply — a meaningful institutional floor. However, the past week saw approximately $2.8 billion in net ETF outflows, snapping a four-week inflow streak and signalling a shift back into distribution mode.
Strategy Inc. (formerly MicroStrategy) continues to hold 738,731+ BTC accumulated near the $70,946 average price, reinforcing a structural support narrative. David Bailey’s Nakamoto recently sold approximately 284 BTC, representing roughly 5% of its holdings — a minor liquidity-driven move, but notable as a signal of pressure on corporate treasury strategies at current price levels. On-chain metrics paint a more constructive picture: Bitcoin exchange reserves have fallen to a seven-year low of 2.21 million BTC, meaning available supply for immediate selling on exchanges continues to shrink even as price drifts lower. Realised profit across the network has collapsed 96% from its July 2025 peak — historically a sign of late-stage seller exhaustion.
The positive catalyst that briefly lifted BTC above $67,600 on March 30 was President Trump’s statement that the US is in “serious discussions” with a new Iranian regime to end military conflict and reopen the Strait of Hormuz. This relief-rally impulse pushed BTC up 1.3% intraday but failed to generate follow-through, with price retracing to the $66,800 zone. The broader trend remains corrective, and without a definitive macro catalyst — ceasefire confirmation, a below-consensus NFP print, or a Fed pivot signal — momentum remains structurally bearish above $65,994 daily support.
Ethereum trades at $2,052.98, up 1.63% on the day and attempting to hold the 0.236 Fibonacci support at $2,044. The asset has experienced an unprecedented six consecutive red monthly candles from the Q4 2025 high, a streak that has no precedent in Ethereum’s post-merge history. Despite the relentless price decline, the fundamental structure is more nuanced. US-listed spot Ethereum ETFs carry $13 billion in AUM with BlackRock’s ETHA fund continuing to attract periodic inflows. Ethereum futures open interest has risen to 13.41 million ETH — the highest since January 31 — suggesting that rising OI with stabilising price may reflect accumulation rather than new short positions.
The primary Ethereum upgrade catalyst for 2026 is the Glamsterdam hard fork, targeting H1 2026. The upgrade introduces ePBS (Enshrined Proposer-Builder Separation), which moves the MEV-Boost validator/builder relationship on-chain, reducing centralisation risk and improving censorship resistance. Parallel to this, Verkle Trees form part of the broader “Verge” roadmap phase that begins transitioning Ethereum towards nearly stateless nodes — a foundational improvement for institutional validators. These are medium-to-long-term structural positives that have been partially priced in, providing a technical floor narrative without acting as an immediate price catalyst in the current risk-off environment.
The ETH/BTC cross sits at approximately 0.02996 — a multi-year low — signalling that Ethereum is significantly underperforming Bitcoin on a relative basis. This ratio compression is consistent with periods when macro risk-off conditions are dominant and Bitcoin absorbs capital as the crypto store-of-value asset before it flows to higher-beta altcoins. The critical technical threshold for ETH is a confirmed daily close above $2,089 (today’s high), which would place the asset decisively above the 0.236 Fib level. Until that occurs, the path of least resistance remains toward the $1,735 base support.
XRP is trading at $1.314, down 0.93% on the day and pressing toward the $1.303 daily low. The pair peaked at approximately $2.28 in early January 2026 and has been in a controlled descending channel since — a 42% drawdown. The 0.236 Fibonacci level at $1.369 has acted as a hard ceiling throughout March, with every attempt to reclaim it met by immediate selling. The daily chart shows a pattern of lower highs that is unambiguous: RSI at approximately 40 is in a neutral-to-bearish zone, and MACD is hovering near the zero line with no momentum crossover signal visible.
The dominant fundamental catalyst for XRP remains the US Digital Asset Market Clarity (CLARITY) Act. This legislation defines the jurisdictional boundary between the SEC and CFTC for digital assets and, for XRP specifically, would remove the longstanding regulatory overhang that has constrained exchange listings and institutional allocations since the original SEC lawsuit in 2020. The CLARITY Act has been advancing through Congress throughout Q1 2026 and its passage — or material legislative progress — would represent the single largest potential XRP repricing catalyst. Without it, the fundamental narrative lacks a near-term trigger.
On a more constructive note, on-chain data shows that XRP exchange balances have declined by 57% — a signal that long-term holders continue to withdraw tokens from exchanges, removing them from the immediate sell-side pool. US-listed XRP spot ETFs have accumulated over $1.3 billion in inflows since their launch, providing an institutional demand floor. The pair’s base support at $1.1156 (the 0.000 Fibonacci level) represents the ultimate structural floor. Between current price and that level, the $1.25 zone is the next significant horizontal support where demand historically emerged in Q1 2026.
Solana is the session’s most significant underperformer, trading at $80.713 with a daily decline of 2.15%. The asset now sits below the 0.236 Fibonacci retracement at $86.775 and is pressing toward the 0.000 base support at $67.554 — a level not revisited since late 2024. The RSI oscillator displayed on the daily chart reads approximately 39, the most oversold of the four pairs covered, though not yet at the extreme sub-30 levels that historically produced strong bounce conditions. The stochastic RSI sub-indicator printed at 46.77 and 39.14 respectively — both below 50, confirming bearish momentum on the daily timeframe.
The primary Solana fundamental catalyst is the Alpenglow upgrade, a consensus and finality mechanism overhaul that targets sub-second transaction finality. The upgrade was approved by 98.27% of stakers in a validator vote and mainnet deployment is targeted for H1 2026. Alpenglow would resolve the latency concerns that have historically deterred high-frequency and algorithmic trading operations from deploying on Solana — a meaningful institutional adoption signal. Network revenue has fallen sharply in 2026, with daily transactions declining and active addresses dropping approximately 11% over the past month, reflecting the memecoin ecosystem collapse that drove much of Solana’s 2025 activity.
Despite the deteriorating on-chain activity data, dedicated Solana investment products have continued to attract net positive ETF flows for multiple consecutive weeks, suggesting that institutional buyers are treating the price decline as a medium-term entry point ahead of the Alpenglow catalyst. The $80 support zone has been tested multiple times in recent sessions, and each test has been absorbed without a clean break. A confirmed daily close below $80.160 (today’s low) would open the path toward $75 and ultimately the $67.554 Fibonacci base. The moving average structure remains entirely bearish — three declining MAs (104.425, 87.947, 85.735) are stacked in descending order above price.
Geopolitical risk remains the dominant macro overlay for all four crypto pairs entering April 2026. The US-Israel military campaign against Iranian nuclear and energy infrastructure, which commenced on February 28, 2026, has produced the largest oil supply disruption on record, with the Strait of Hormuz — through which approximately 20% of global oil trade transits — subject to operational disruption risk. WTI crude surged over 60% from January levels, peaking above $110/barrel in early March. The oil premium has fed directly into US inflation expectations, which contributed to the FOMC’s upward revision of the 2026 PCE forecast to 2.7%.
On March 30, President Trump stated the US is in “serious discussions” with a new Iranian government regarding a ceasefire and the reopening of the Strait of Hormuz, threatening to destroy Iranian energy infrastructure if talks fail. This announcement produced a short-duration risk-on impulse across markets — BTC briefly traded above $67,600 — but the follow-through was limited and price has since retraced. Professional market participants are treating the ceasefire signal as tentative rather than definitive, maintaining elevated geopolitical risk premiums until a formal agreement is signed and oil supply visibly normalises.
The broader macro picture is also shaped by the EU’s MiCA regulation, which enters full enforcement on July 1, 2026. Every crypto exchange, broker, and service provider seeking to serve EU clients must hold a MiCA license. This creates both a structural tailwind — a fully regulated European crypto market — and near-term uncertainty for market makers adjusting their EU operations. Additionally, the SEC’s cluster of 91 pending crypto ETF decisions, with the final 240-day review window having passed March 27, is producing ongoing regulatory noise specifically affecting XRP, SOL, and other altcoin ETF applicants. The CLARITY Act’s progression through Congress remains the single most consequential regulatory catalyst for the entire US crypto market in Q2 2026.
Today’s Key Economic Events — Tuesday, 31 March 2026
| Time (GMT) | Event | Currency | Impact | Crypto Implication |
|---|---|---|---|---|
| 12:30 | US Personal Income & Spending (Feb) | USD | HIGH | A stronger-than-expected spending print reinforces sticky inflation, reducing probability of June Fed cut and adding downward pressure on BTC and ETH. |
| 12:30 | US PCE Price Index (Feb) — Core m/m & y/y | USD | HIGH | The Fed’s preferred inflation gauge; a reading at or above the 2.7% consensus would confirm the March FOMC upward revision and extend BTC’s consolidation below $68,970 resistance. |
| 14:00 | US Chicago PMI (March) | USD | MEDIUM | An above-50 print signals US manufacturing expansion, strengthening the USD and acting as a short-term headwind for crypto’s risk-on positioning ahead of NFP. |
| 14:00 | US CB Consumer Confidence (March) | USD | HIGH | A deterioration in consumer confidence — consistent with oil-price and geopolitical fears — could revive rate-cut expectations and provide a short-term risk-on tailwind for BTC above $66,875. |
| All Day | US Q4 2025 GDP Final Revision | USD | HIGH | Any downward revision to Q4 GDP — amplifying stagflation concerns — would pressure both equities and crypto by reinforcing a risk-off regime without delivering the rate-cut comfort traders need. |
| Preview | April 3 — March Non-Farm Payrolls (12:30 GMT) | USD | HIGH | This week’s primary catalyst: a strong NFP print tightens the rate-cut timeline and pressures BTC toward $65,994 support, while a miss below consensus could spark a risk-on relief rally above $68,970. |
Trade the $66,875 BTC Range Break with Precision
— Capital Street FX
Today’s market presents defined setups across all four pairs. Here’s how Capital Street FX gives active traders the edge to execute them.
Technical Analysis — All Four Pairs

Bitcoin’s daily chart presents a textbook corrective structure. Price is currently trading at $66,875, sitting within the 0.236–0.000 Fibonacci band — the lowest zone of the retracement drawn from the $98,769 swing high to the $59,764 swing low. The 0.236 level at $68,970 has acted as a consistent rejection ceiling throughout March, with every intraday rally into this zone absorbed by sellers. The descending dashed trendline visible on the chart, running from the January 2026 high, captures the sequence of lower highs that defines the current corrective phase. Price has not traded above this trendline since early January.
The 5-day SMA at approximately $66,117 is currently acting as minor dynamic support, while the 50-day SMA at $69,090 sits above price alongside the 200-day SMA at $70,281 — both bearish reference points that would need to be reclaimed for any medium-term bullish shift. RSI at 24.3 is in deeply oversold territory, below the 30 threshold, which historically has coincided with periods of either capitulatory bottoming or extended sideways accumulation. MACD at −934 with a bearish signal confirms that the intermediate trend remains negative. The Fibonacci pivot value sits at $65,949 — marginally below today’s low at $65,994, making that zone a critical intraday support cluster. A daily close below $65,949 opens the path to retest the $59,764 base support.
| Indicator | Value | Signal |
|---|---|---|
| Overall Daily Signal | — | Strong Sell |
| MA Alignment | 0 Buy / 12 Sell | Strong Sell |
| RSI (14) | 24.33 | Oversold |
| MACD | −934.45 | Sell |
| 5-Day SMA | $66,117 | Buy |
| 50-Day SMA | $69,090 | Sell |
| 200-Day SMA | $70,281 | Sell |
| Fibonacci Pivot | $65,949 | Watch |
| Fib Level | Price |
|---|---|
| 1.000 (Swing High) | $98,769.33 |
| 0.786 | $90,422.39 |
| 0.618 | $83,869.66 |
| 0.500 | $79,267.15 |
| 0.382 | $74,664.64 |
| 0.236 | $68,970.00 |
| ► Current Price | $66,875.25 |
| 0.000 (Base Support) | $59,764.98 |
Trade Setup — BTC/USD
SHORT
Ethereum is trading at $2,052.98, attempting to hold above the 0.236 Fibonacci retracement level at $2,044.28. The current price action is positioned directly on this critical line — the 1.63% daily gain brings ETH to within $36 of today’s high at $2,089.26, which sits just above the 0.236 level. The Fibonacci retracement is drawn from the swing high at $3,045.15 (the 1.000 level) down to the swing low at $1,735.12 (the 0.000 level). At the current price of $2,052.98, ETH is barely above the 0.236 line and the chart structure confirms this as a decision point — hold here and stage a recovery toward $2,235 (0.382 level), or roll over and target the $1,735 base.
The descending dashed trendline from the January 2026 high maintains downward pressure on price, and the fact that the 0.786 level at $2,764.79 and every Fibonacci band above it have been surrendered without meaningful recovery attempts reinforces the bearish intermediate structure. No moving average crossover or RSI divergence is yet visible that would define an imminent trend reversal. The 0.382 Fibonacci level at $2,235.54 represents the first meaningful resistance above current price — a break and hold there would be required before any bullish thesis becomes technically viable. Until then, the path structure remains: test $2,044 support, and on failure, target the $1,735.12 cycle low.
| Indicator | Value | Signal |
|---|---|---|
| Overall Daily Signal | — | Strong Sell |
| MA Alignment | 0 Buy / 12 Sell | Strong Sell |
| RSI (14) | ~36 | Weak / Bearish |
| MACD | Negative | Sell |
| 5-Day SMA | ~$2,030 | Buy |
| 50-Day SMA | ~$2,180 | Sell |
| ETH/BTC Ratio | 0.02996 | Multi-yr Low |
| Fibonacci Pivot | ~$2,008 | Watch |
| Fib Level | Price |
|---|---|
| 1.000 (Swing High) | $3,045.15 |
| 0.786 | $2,764.79 |
| 0.618 | $2,544.71 |
| 0.500 | $2,390.13 |
| 0.382 | $2,235.54 |
| 0.236 | $2,044.28 |
| ► Current Price | $2,052.98 |
| 0.000 (Base Support) | $1,735.12 |
Trade Setup — ETH/USD
SHORT
XRP/USD is trading at $1.314, sitting below the 0.236 Fibonacci level at $1.3694. The retracement is drawn from the January 2026 swing high at $2.197 (1.000 level) down to the $1.1156 base (0.000 level). Current price at $1.314 positions XRP just 1.8% above today’s low of $1.3027, within the $1.10–$1.37 lower band of the retracement. The 0.236 level at $1.3694 has been tested and rejected multiple times throughout March, making it the single most critical technical threshold for this pair. A daily close above $1.3694 would be the first meaningful technical shift in the bearish structure. A daily close below $1.3027 would open the path toward $1.25 and eventually the $1.1156 base.
The descending dashed trendline from the January high maintains steady downward pressure. Each Fibonacci zone above — 0.382 at $1.5263, 0.500 at $1.6532, 0.618 at $1.7800 — represents a progressively distant overhead resistance cluster. The RSI at approximately 40 remains in the neutral-to-bearish zone without reaching the sub-30 oversold levels that would signal a structural bottom. MACD is hovering near the zero line, confirming the market is in equilibrium but with a slight bearish lean. Volume has been contracting during the recent consolidation between $1.30–$1.37, which is typical before a directional expansion — the breakout direction will likely be defined by the macro catalyst of the week: PCE today, NFP Friday, or any CLARITY Act news from Washington.
| Indicator | Value | Signal |
|---|---|---|
| Overall Daily Signal | — | Strong Sell |
| MA Alignment | 0 Buy / 12 Sell | Strong Sell |
| RSI (14) | ~40 | Neutral–Bearish |
| MACD | Near Zero | Neutral |
| 5-Day SMA | ~$1.330 | Buy |
| 50-Day SMA | ~$1.430 | Sell |
| Exchange Balances | −57% | Bullish LT |
| Fibonacci Pivot | ~$1.303 | Watch |
| Fib Level | Price |
|---|---|
| 1.000 (Swing High) | $2.1970 |
| 0.786 | $1.9606 |
| 0.618 | $1.7800 |
| 0.500 | $1.6532 |
| 0.382 | $1.5263 |
| 0.236 | $1.3694 |
| ► Current Price | $1.3140 |
| 0.000 (Base Support) | $1.1156 |
Trade Setup — XRP/USD
SHORT
Solana presents the most structurally bearish chart of the four pairs covered today. At $80.713, SOL has broken below the 0.236 Fibonacci level at $86.775 and is now trading between that level and the 0.000 base support at $67.554. Three declining moving averages are stacked above price in descending order — the orange MA cluster at approximately $104.425, $87.947, and $85.735 — all pointing lower, with price having crossed beneath all of them weeks ago. This multi-MA bearish alignment is one of the most reliable technical signals for continued downside pressure. The RSI sub-chart at the bottom of the screen reads approximately 46.77 and 39.14 for the two oscillator components — below the 50 midline, confirming the bearish momentum on the daily timeframe.
The SOL chart’s Fibonacci structure operates differently from the other three pairs: the reference levels are drawn using a base at $67.554 (0.000) with extension levels at 0.236 ($86.775), 0.382 ($98.666), 0.500 ($108.276), 0.618 ($117.887), 0.786 ($131.569), 1.000 ($148.998), 1.618 ($199.331), and 2.618 ($280.775). This extension structure shows that the current price at $80.713 has retreated all the way back from the 1.000 level ($148.998) — which was the January 2026 high — through every retracement level and is now sitting just $13.16 above the absolute 0.000 base at $67.554. The pace of deterioration is significant: from the $148.998 swing high in January to $80.71 today represents a 45.8% decline in under 90 days. A confirmed daily close below $80.16 (today’s low) increases the probability of reaching $75 before the $67.554 floor is tested.
| Indicator | Value | Signal |
|---|---|---|
| Overall Daily Signal | — | Strong Sell |
| MA Alignment | 0 Buy / 12 Sell | Strong Sell |
| RSI (14) — Stoch | 46.77 / 39.14 | Bearish |
| MACD | Negative | Sell |
| MA1 (Short) | $85.735 | Sell |
| MA2 (Mid) | $87.947 | Sell |
| MA3 (Long) | $104.425 | Sell |
| Fibonacci Pivot | $67.554 | Key Floor |
| Fib Level | Price |
|---|---|
| 2.618 Extension | $280.775 |
| 1.618 Extension | $199.331 |
| 1.000 (Jan High) | $148.998 |
| 0.786 | $131.569 |
| 0.618 | $117.887 |
| 0.500 | $108.276 |
| 0.382 | $98.666 |
| 0.236 | $86.775 |
| ► Current Price | $80.713 |
| 0.000 (Base Support) | $67.554 |
Trade Setup — SOL/USD
SHORTSession Conclusion
All four pairs covered in today’s report carry a Strong Sell signal on the daily timeframe, with zero MA buy signals across any of the four assets. This uniform bearish alignment has not been a temporary aberration — it reflects a sustained macro and technical regime that has dominated Q1 2026. The Federal Reserve’s 3.50–3.75% rate hold, PCE inflation revised up to 2.7%, and $2.8 billion in weekly Bitcoin ETF outflows collectively form a macro ceiling that has suppressed every recovery attempt since the October 2025 ATH. The geopolitical variable — an active US-Iran military conflict and Strait of Hormuz supply disruption — is the wildcard that could shift this framework rapidly in either direction depending on ceasefire developments.
Technically, each pair is at a structural inflection point as Q1 2026 closes. Bitcoin sits between the Fibonacci pivot at $65,949 and the 0.236 resistance at $68,970 — a $3,000 decision band. Ethereum is perched on the 0.236 Fibonacci support at $2,044 with the $1,735 base directly below. XRP is consolidating below the 0.236 rejection at $1.3694 with volume contracting ahead of a binary breakout. Solana has breached every Fibonacci retracement level from its January high and is now within $13 of the absolute $67.554 base. The macro and technical setup across all four pairs converges on a consistent message: Q1 closes bearish, and Q2 direction will be determined by the April 3 NFP print, any Iran ceasefire confirmation, and the progression of the CLARITY Act through Congress.
The risk event concentration over the next five trading days — PCE today at 12:30 GMT, ISM Manufacturing on April 1, ADP payrolls on April 2, and NFP on April 3 — represents the highest macro event density of the past month. Active traders are advised to reduce position size ahead of each print and await directional confirmation via candle closes rather than anticipating the outcome. The stablecoin supply at a record $316 billion and Bitcoin exchange reserves at seven-year lows suggest that significant capital is positioned on the sidelines — when the macro catalyst aligns, the move is likely to be swift and sustained.
Session Summary Card
All pairs confirm uniform bearish structure. PCE today and NFP April 3 are the week’s primary macro inflection points.