CAPITAL STREET FX | DAILY CRYPTO ANALYSIS
MARKET SNAPSHOT
Cryptocurrency markets are trading under sustained bearish pressure as hawkish FOMC signals, rising geopolitical tensions between the US and Iran, and fading risk appetite are dragging digital assets lower. Bitcoin is slipping below key moving averages, Ethereum is struggling at the $2,000 psychological level, XRP is extending its decline below $1.45, and Dogecoin is defending the critical $0.10 support. The entire complex is underperforming global equities and lagging gold — a sign that crypto is not currently benefiting from macro uncertainty flows.
⚡ KEY CATALYSTS DRIVING CRYPTO TODAY
• FOMC Minutes (Hawkish Tone): Several Fed officials opposing rate cuts — raising the opportunity cost of holding non-yielding assets like crypto
• US-Iran Geopolitical Tensions: Escalating risk aversion is hitting high-beta assets hardest
• USD Strength: DXY climbing toward one-week high — a headwind for BTC/USD and ETH/USD
• Friday PCE Data: Next major macro catalyst that could determine crypto’s near-term direction
• Initial Jobless Claims (19:00 GMT) — Forecast 223K vs. Prior 227K
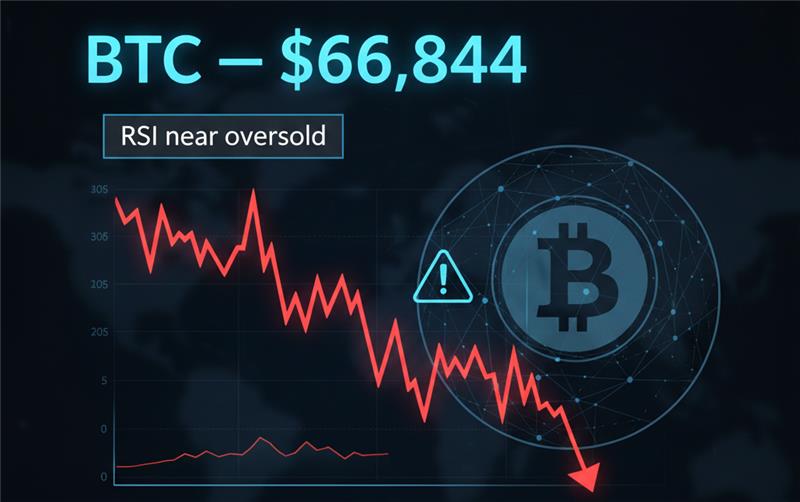
BITCOIN (BTC/USD) — EXTENDING DECLINE BELOW $67,000
Bitcoin is currently trading below the $67,000 threshold, extending its recent losing streak as the hawkish FOMC minutes are depriving risk assets of bullish catalysts. The Fed’s January meeting minutes are revealing deep internal divisions over rate cut timing, with several members expressing willingness to hike again if inflation stays elevated. This is sustaining downward pressure on BTC. Crypto is also lagging the global tech equity rally — historically a negative divergence signal — while gold is absorbing the safe-haven flows that might otherwise have benefited Bitcoin. All EMA and SMA crossovers are registering as bearish, the RSI is sitting at 34.76 (near oversold territory but not yet confirming a reversal), and the Stochastic Oscillator is hovering near neutral at 50.36. The nearest meaningful support sits at $70,329 (S2), while any recovery is facing immediate resistance at $92,551 (R1).
📌 TRADER INSIGHT: BTC is approaching historically significant oversold RSI levels (sub-35). While the primary trend remains bearish, contrarian traders should monitor for a Stochastic bullish crossover near these levels as an early reversal signal. Do not attempt to catch a falling knife without confirmation.
Technical Indicators
| TYPE | PERIOD | VALUE | SIGNAL |
| EMA | 10 | 68,465.40 | Bearish |
| EMA | 20 | 71,623.93 | Bearish |
| EMA | 50 | 79,115.94 | Bearish |
| SMA | 10 | 67,928.03 | Bearish |
| SMA | 20 | 70,260.45 | Bearish |
| SMA | 50 | 82,637.68 | Bearish |
RSI (14): 34.76 — Sell Zone (Approaching Oversold) | Stochastic: 50.36 — Neutral Zone
Key Price Levels
| RESISTANCE 1 | RESISTANCE 2 | SUPPORT 1 | SUPPORT 2 |
| $92,551.74 | $97,796.13 | $75,574.13 | $70,329.74 |
OVERALL SENTIMENT: BEARISH | DIRECTION: SELL
Trade Suggestion
| ENTRY PRICE $68,055 (Limit Buy) | TAKE PROFIT $65,031 | STOP LOSS $70,030 |
Risk/Reward Ratio: ~1.5:1 | Note: Counter-trend play — use conservative position sizing
ETHEREUM (ETH/USD) — RESISTANCE AT $2,000 CAPS RECOVERY
Ethereum is currently consolidating near $1,963 following a brief bounce from the $1,922 support zone, but the recovery is stalling decisively at the $2,000 psychological resistance level. ETH is trading below the 100-hour SMA and beneath a developing bearish trend line, with the $2,000 level now functioning as a formidable ceiling. All 6 moving average readings are showing negative crossovers, and the RSI at 34.60 is echoing Bitcoin’s near-oversold signal. A clean break below $1,925 would accelerate selling pressure toward $1,880, and subsequently the $1,820 demand zone. A breakout above $2,000 on meaningful volume is the only factor that would shift the near-term bias to neutral-bullish.
Technical Indicators
| TYPE | PERIOD | VALUE | SIGNAL |
| EMA | 10 | 2,018.74 | Bearish |
| EMA | 20 | 2,159.22 | Bearish |
| EMA | 50 | 2,512.69 | Bearish |
| SMA | 10 | 1,993.10 | Bearish |
| SMA | 20 | 2,077.13 | Bearish |
| SMA | 50 | 2,684.75 | Bearish |
RSI (14): 34.60 — Sell Zone | Stochastic: 49.35 — Neutral Zone
Key Price Levels
| RESISTANCE 1 | RESISTANCE 2 | SUPPORT 1 | SUPPORT 2 |
| $3,137.11 | $3,408.47 | $2,258.62 | $1,987.26 |
OVERALL SENTIMENT: BEARISH | DIRECTION: SELL
Trade Suggestion
| ENTRY PRICE $2,034.50 (Limit Sell) | TAKE PROFIT $1,895.00 | STOP LOSS $2,110.70 |
Risk/Reward Ratio: ~1.8:1 | Invalidation: Sustained hourly close above $2,050
XRP/USD — ACCELERATING DECLINE BELOW $1.45
XRP is extending its bearish slide, currently trading below $1.45 and below the 100-hour SMA after failing to sustain any meaningful recovery above $1.480. Selling pressure drove the token to a session low near $1.4102, and while there has been modest stabilization, the near-term bias is clearly pointing lower. The recovery path requires a sustained reclaim of $1.480, followed by a break above the stronger ceiling at $1.5250 before bulls can claim any structural advantage. On the downside, a break below $1.410 would expose $1.385, with extended weakness potentially reaching the $1.35 zone. RSI at 39.25 is bearish and has room to deteriorate further before reaching oversold territory.
Technical Indicators
| TYPE | PERIOD | VALUE | SIGNAL |
| EMA | 10 | 1.4512 | Bearish |
| EMA | 20 | 1.5123 | Bearish |
| EMA | 50 | 1.6998 | Bearish |
| SMA | 10 | 1.4331 | Bearish |
| SMA | 20 | 1.4624 | Bearish |
| SMA | 50 | 1.7931 | Bearish |
RSI (14): 39.25 — Sell Zone | Stochastic: 57.90 — Neutral Zone
Key Price Levels
| RESISTANCE 1 | RESISTANCE 2 | SUPPORT 1 | SUPPORT 2 |
| $2.2032 | $2.4187 | $1.5057 | $1.2902 |
OVERALL SENTIMENT: BEARISH | DIRECTION: SELL
Trade Suggestion
| ENTRY PRICE $1.4900 (Limit Sell) | TAKE PROFIT $1.3300 | STOP LOSS $1.6000 |
Risk/Reward Ratio: ~1.5:1 | Watch for acceleration on break below $1.41
DOGECOIN (DOGE/USD) — DEFENDING $0.10 CRITICAL SUPPORT
Dogecoin is currently trading just above the critical $0.10 support level — a psychologically and technically significant threshold. The recent pullback began after DOGE failed to clear $0.1175, and sellers are dragging the price through $0.1120, $0.1080, and below the 50% Fibonacci retracement of the $0.0878–$0.1175 rally. DOGE is currently sitting near the 100-hour SMA, which is aligning with the rising trend line support around $0.10. A sustained loss of $0.10 would be technically damaging and could open the path to $0.0950 (S1) and ultimately $0.0804 (S2). Any recovery requires DOGE to reclaim $0.1060 to neutralise immediate pressure, followed by $0.1085 and $0.1120 before trend reversal can be confirmed. RSI at 41.40 is in neutral-to-bearish territory.
Technical Indicators
| TYPE | PERIOD | VALUE | SIGNAL |
| EMA | 10 | 0.0996 | Bearish |
| EMA | 20 | 0.1029 | Bearish |
| EMA | 50 | 0.1152 | Bearish |
| SMA | 10 | 0.0984 | Bearish |
| SMA | 20 | 0.0994 | Bearish |
| SMA | 50 | 0.1203 | Bearish |
RSI (14): 41.40 — Neutral Zone | Stochastic: 50.20 — Neutral Zone
Key Price Levels
| RESISTANCE 1 | RESISTANCE 2 | SUPPORT 1 | SUPPORT 2 |
| $0.1420 | $0.1566 | $0.0950 | $0.0804 |
OVERALL SENTIMENT: BEARISH | DIRECTION: SELL
Trade Suggestion
| ENTRY PRICE $0.1030 (Limit Sell) | TAKE PROFIT $0.0870 | STOP LOSS $0.1160 |
Risk/Reward Ratio: ~1.2:1 | Key invalidation: Reclaim and hold above $0.1085
CRYPTO MARKET SNAPSHOT
BTC +0.63% → $66,844 | ETH +0.45% → $1,963.46 | LTC -0.64% → $52.79 | SOL +0.45% → $85.39 | DOGE +0.77% → $0.1003
RISK DISCLAIMER: This report is produced by Capital Street FX for informational purposes only and does not constitute financial advice. Crypto assets are highly volatile and involve significant risk of loss. Always manage your risk appropriately. Visit capitalstreetfx.com for full risk disclosures.