CAPITAL STREET FX | DAILY FX ANALYSIS
MARKET SNAPSHOT
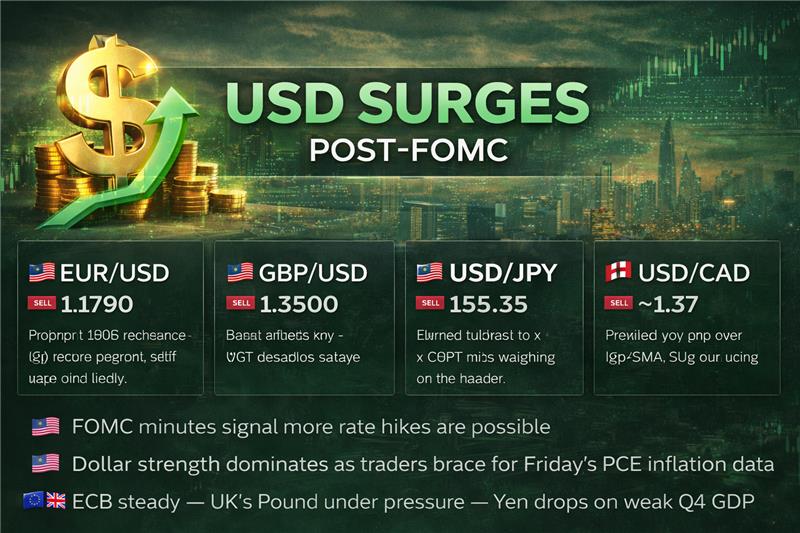
Global currency markets are navigating a complex macro landscape as hawkish FOMC minutes continue to reshape rate-cut expectations. The U.S. Dollar is gaining ground, the British Pound is facing dual headwinds from weak domestic data, the Japanese Yen is under fiscal pressure, and USD/CAD is consolidating near a two-week high. Traders are positioning carefully ahead of Friday’s PCE inflation release — the next major catalyst for USD direction.
⚡ KEY EVENTS TODAY
• USD Initial Jobless Claims — Forecast: 223K, Prior: 227K (19:00 GMT)
• USD Philadelphia Fed Manufacturing Index — Forecast: 7.5
• Fed Speakers: Kashkari, Bostic, Bowman — Post-FOMC commentary closely watched
• Friday Catalyst: US PCE Price Index + Japan CPI — Major volatility trigger
EUR/USD — PROBING 1.1800 RESISTANCE
EUR/USD is currently trading near 1.1790, recovering from a three-session losing streak but facing stiff resistance at the psychological 1.1800 mark. The 14-day RSI is registering at 48.63 — sitting in neutral territory just below the 50 threshold — which is signalling that bullish conviction is fading. The 50-day EMA at 1.1774 is providing immediate support, while the 9-day EMA has levelled off near 1.1833, acting as dynamic overhead resistance. The pair’s inability to post a daily close above 1.1800 is keeping the short-term bias cautiously bearish. A sustained break above 1.1833 would revive upside momentum toward 1.2082 — the highest print since June 2021. Conversely, a breach of 1.1774 exposes the January 19 low at 1.1578.
Technical Indicators
| TYPE | PERIOD | VALUE | SIGNAL |
| EMA | 10 | 1.1835 | Bearish |
| EMA | 20 | 1.1826 | Bearish |
| EMA | 50 | 1.1774 | Bullish |
| SMA | 10 | 1.1852 | Bearish |
| SMA | 20 | 1.1861 | Bearish |
| SMA | 50 | 1.1771 | Bullish |
| OSCILLATOR | VALUE | ZONE | SIGNAL |
| RSI (14) | 48.6347 | Neutral | |
| Stochastic | 20.7359 | Neutral |
Key Price Levels
| RESISTANCE 1 | RESISTANCE 2 | SUPPORT 1 | SUPPORT 2 |
| 1.2030 | 1.2150 | 1.1640 | 1.1520 |
OVERALL SENTIMENT: NEUTRAL | DIRECTION: SELL
Trade Suggestion
| ENTRY PRICE 1.1821 (Limit Sell) | TAKE PROFIT 1.1760 | STOP LOSS 1.1861 |
Risk/Reward Ratio: ~1.6:1 | Invalidation level: Daily close above 1.1861
GBP/USD — STRUGGLING AT 1.3500
GBP/USD is currently trading cautiously around the 1.3500 handle — hovering near a four-week low — as a combination of deteriorating domestic fundamentals and a resurgent U.S. Dollar is keeping sellers in control. UK unemployment is climbing, registering at 5.2% (ILO basis, 3 months to December) — the highest reading in five years. CPI inflation is easing to 3.0% YoY in January, down from 3.4% in December, reinforcing the case for Bank of England rate cuts. The FOMC minutes are adding USD tailwinds by signalling that the Fed is in no rush to ease. All moving averages are showing negative crossovers, with the RSI at 44.08 confirming underlying bearish pressure. Traders are now watching Friday’s UK Retail Sales and flash PMI data for near-term direction.
📌 TRADER INSIGHT: The ‘Volatility Compression Pattern’ (VCP) that was forming on the GBP/USD daily chart has broken down, confirming continuation selling pressure. Watch for a close below 1.3432 (S1) to trigger momentum acceleration toward 1.3308.
Technical Indicators
| TYPE | PERIOD | VALUE | SIGNAL |
| EMA | 10 | 1.3583 | Bearish |
| EMA | 20 | 1.3590 | Bearish |
| EMA | 50 | 1.3527 | Bearish |
| SMA | 10 | 1.3603 | Bearish |
| SMA | 20 | 1.3650 | Bearish |
| SMA | 50 | 1.3527 | Bearish |
| OSCILLATOR | VALUE | ZONE | SIGNAL |
| RSI (14) | 44.0790 | Neutral | |
| Stochastic | 9.4777 | Neutral |
Key Price Levels
| RESISTANCE 1 | RESISTANCE 2 | SUPPORT 1 | SUPPORT 2 |
| 1.3832 | 1.3956 | 1.3432 | 1.3308 |
OVERALL SENTIMENT: BEARISH | DIRECTION: SELL
Trade Suggestion
| ENTRY PRICE 1.3556 (Limit Sell) | TAKE PROFIT 1.3452 | STOP LOSS 1.3618 |
Risk/Reward Ratio: ~1.7:1 | Invalidation level: Daily close above 1.3618
USD/JPY — ONE-WEEK HIGH ON FISCAL CONCERNS
USD/JPY is extending its advance for a second consecutive session, currently trading near 155.35 — a level not seen in over a week. Japan’s disappointing Q4 GDP reading is weighing on the Yen as it is increasing expectations for fiscal stimulus from PM Takaichi, raising debt sustainability concerns flagged by the IMF. The USD is finding support from less-dovish FOMC minutes, with the DXY climbing to a one-week high. The RSI at 49.65 sits just below neutral, while the 50-day EMA at 155.28 is capping short-term upside. Friday’s Japanese CPI and US PCE data are set to be major directional catalysts. A close above 155.40 opens the path toward 158.25 (R1).
Technical Indicators
| TYPE | PERIOD | VALUE | SIGNAL |
| EMA | 10 | 154.3651 | Bullish |
| EMA | 20 | 154.8507 | Bullish |
| EMA | 50 | 155.2842 | Bearish |
| SMA | 10 | 154.2686 | Bullish |
| SMA | 20 | 154.5545 | Bullish |
| SMA | 50 | 155.9839 | Bearish |
| OSCILLATOR | VALUE | ZONE | SIGNAL |
| RSI (14) | 49.6460 | Neutral | |
| Stochastic | 38.7349 | Neutral |
Key Price Levels
| RESISTANCE 1 | RESISTANCE 2 | SUPPORT 1 | SUPPORT 2 |
| 158.2468 | 159.9835 | 152.6245 | 150.8878 |
OVERALL SENTIMENT: NEUTRAL | DIRECTION: SELL
Trade Suggestion
| ENTRY PRICE 155.34 (Limit Sell) | TAKE PROFIT 152.96 | STOP LOSS 156.89 |
Risk/Reward Ratio: ~1.5:1 | Invalidation level: Daily close above 156.89
USD/CAD — CONSOLIDATING NEAR TWO-WEEK HIGH
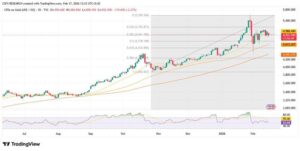
USD/CAD is printing near a two-week high during early trading as the USD maintains its post-FOMC bid. The pair is holding above the 4-hour 100-period SMA — a level that has acted as resistance since January 22 — now flipped to support. MACD histogram is staying positive and edging higher, confirming strengthening upside momentum. RSI at 50.58 provides room for further gains before reaching overbought territory. The critical bull/bear line sits at 1.3700: a sustained break and daily close above this level would open the door toward 1.3845 (R1). Oil price dynamics and Canadian data will remain secondary near-term drivers.
Technical Indicators
| TYPE | PERIOD | VALUE | SIGNAL |
| EMA | 10 | 1.3644 | Bullish |
| EMA | 20 | 1.3659 | Bullish |
| EMA | 50 | 1.3727 | Bearish |
| SMA | 10 | 1.3621 | Bullish |
| SMA | 20 | 1.3626 | Bullish |
| SMA | 50 | 1.3723 | Bearish |
| OSCILLATOR | VALUE | ZONE | SIGNAL |
| RSI (14) | 50.5751 | Bullish | |
| Stochastic | 76.3047 | Neutral |
Key Price Levels
| RESISTANCE 1 | RESISTANCE 2 | SUPPORT 1 | SUPPORT 2 |
| 1.3845 | 1.3950 | 1.3503 | 1.3398 |
OVERALL SENTIMENT: BEARISH | DIRECTION: SELL
Trade Suggestion
| ENTRY PRICE 1.3702 (Limit Sell) | TAKE PROFIT 1.3649 | STOP LOSS 1.3732 |
Risk/Reward Ratio: ~1.8:1 | Watch for break above 1.3700 as bull trigger
CROSS-RATE SNAPSHOT
USD/JPY +0.09% → 154.96 | AUD/USD +0.42% → 0.7072 | EUR/GBP +0.10% → 0.8734 | EUR/AUD -0.28% → 1.6731 | AUD/NZD +0.01% → 1.1718 | USD/CNY -0.01% → 6.9097 | AUD/SEK -0.05% → 6.3519
RISK DISCLAIMER: This report is produced by Capital Street FX for informational purposes only and does not constitute financial advice. Trading foreign exchange and CFDs involves significant risk of loss. Past performance is not indicative of future results. Always manage your risk appropriately. Visit capitalstreetfx.com for full risk disclosures.