Commodities Weekly Report – Gold, Silver, Crude Oil, Natural Gas | April 4, 2026 | Capital Street FX
Hormuz Shock Sends Oil Above 12 — Gold Retreats to Key Fibonacci as Markets Price a Ceasefire
Weekly analysis covering Gold (XAU/USD) · Silver (XAG/USD) · WTI Crude Oil · Natural Gas — April 4, 2026
This Week’s Commodity Opportunities
What You Need to Know Before You Trade This Week
The Iran–Strait of Hormuz crisis that erupted on March 4 remains the dominant macro driver across global commodities. WTI crude spiked to an intraday high of 13.97 this week before pulling back as diplomatic signals from Washington emerged, creating a volatile two-way tape. Gold has corrected sharply from its February all-time high of ,594.56, finding support near the 0.618 Fibonacci level at ,542.51 and attempting to stabilize around ,676. Silver has broken its bullish structure decisively and is trading below all key moving averages at 3.01. Natural Gas sits at the 100% Fibonacci base of .780, with EIA storage dynamics and mild spring temperatures keeping the bears in control.
- ▼Gold (XAU/USD): Sell into rallies — bearish corrective sequence from ,594 ATH intact; 0.5 Fib at ,743 is the critical near-term cap.
- ▼Silver (XAG/USD): Strongly bearish — below all EMAs, RSI oversold but momentum confirming downtrend continuation toward 4.30.
- ▲WTI Crude Oil: Structurally bullish on Hormuz supply shock; buy dips to the 0.382 Fibonacci at 5.25 while conflict persists.
- ▼Natural Gas: Downtrend intact from January spike highs; short bounces below .024 EMA resistance.
Live Commodities Prices — April 4, 2026
Weekly Fundamental Analysis
The Strait of Hormuz crisis, which began with joint US-Israeli strikes on Iranian infrastructure on February 28, 2026, continues to serve as the single most powerful macro driver across the commodities complex. Iran’s Revolutionary Guard Corps effectively closed the strait to commercial transit on March 4, cutting off approximately 20% of the world’s daily seaborne oil supply. Insurance companies have withdrawn war-risk coverage for vessels attempting passage, creating a commercial blockade that has pushed WTI crude from pre-conflict levels near 2 to a weekly high of 13.97 — a 84% surge in five weeks. The EIA now forecasts Brent to remain above 5/barrel through the next two months, with WTI following closely given the structural inversion of the global benchmark spread.
The Federal Reserve’s response to this energy-price shock has taken on a decisively hawkish tilt. March NFP data released Friday printed at 228,000 — well above consensus — while energy-driven CPI pressures are keeping the Fed on hold. The CME FedWatch tool currently assigns 0% probability to a rate cut in April. Elevated US Treasury yields and a firm dollar are creating a structural headwind for gold and silver, even as geopolitical safe-haven demand provides a partial offset. This creates a tug-of-war in precious metals, with neither bulls nor bears achieving decisive control at current levels.
Gold’s fundamental picture is bifurcated. On one hand, central bank purchasing remains a structural tailwind — China extended its reserves accumulation programme through February, and countries including Malaysia and South Korea resumed buying after extended pauses. On the other hand, the World Gold Council data shows a slowdown in monthly central bank purchases to just 5 tonnes in January 2026 versus a 27-tonne monthly average in 2025. With the Fed unlikely to cut until at least June or July, the path of least resistance for gold remains lower toward the 0.618 Fibonacci retracement at ,542.51 unless the Hormuz situation escalates further.
Silver occupies its characteristic dual role, but neither the monetary nor the industrial demand pillar is providing sufficient support at current levels. Industrial consumption from solar panels, EVs, and electronics manufacturing had provided a structural bid through 2025, creating physical supply deficits. However, global recession fears triggered by the energy shock and US-China trade tensions are now weighing on industrial demand expectations. Silver’s premium collapse relative to gold — the gold-silver ratio expanding sharply — confirms the market is pricing silver more as an industrial metal than a monetary refuge right now.
Natural gas has decoupled from crude oil’s crisis-driven rally. Despite the Hormuz disruption affecting LNG flows in Europe and Asia, US Henry Hub prices remain structurally weak. The EIA projects Henry Hub to average .80/MMBtu through 2026, down from earlier forecasts, as milder-than-expected February temperatures left storage inventories above seasonal norms. Associated gas production from the oil-price-driven drilling boom is adding further supply-side pressure. The 2026 downtrend from the January spike high near .50 remains completely intact.
The forward catalyst that matters most across all four commodities in the next 48–72 hours is the EIA Short-Term Energy Outlook, due Monday April 7, which will contain updated assumptions about Hormuz transit disruption timelines and their impact on global crude, LNG, and natural gas supply chains. Any signal that diplomatic resolution is imminent could trigger a 10–15% pullback in WTI, while a more hawkish assessment of the conflict’s duration would likely retest the 13.97 weekly high. Gold and silver will trade in direct response to this catalyst.
Gold entered the week on the back foot despite elevated geopolitical risk. The primary constraint is the Federal Reserve’s refusal to pivot, with March NFP at 228,000 reinforcing a hold stance and pushing real yields higher. Gold, a non-yielding asset, loses its relative appeal in a higher-for-longer rate environment, explaining the ongoing corrective sequence from the February all-time high of ,594.56.
Central bank demand remains a structural support. China’s PBoC extended its gold purchases for the 15th consecutive month in early 2026, and the trend of reserve diversification away from dollar assets continues broadly. However, the pace has slowed materially, and speculative positioning — as measured by COT data — shows net longs being pared back from multi-year highs, adding selling pressure to the technical correction.
Safe-haven demand from the Iran war provides periodic bursts of buying, but each rally is being faded at Fibonacci resistance. The weekly close below the 0.5 retracement at ,743.39 is technically significant and keeps the bearish corrective bias intact heading into next week. A diplomatic resolution to the Hormuz crisis would likely accelerate gold’s decline toward the 0.618 Fib at ,542.51.
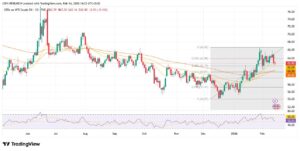
The daily chart shows Gold in a well-defined corrective structure from the ,594.56 all-time high reached in late January 2026. Price has retraced through the 0.236 Fib (,192.81) and 0.382 Fib (,944.27) without any meaningful recovery, and is now testing the area between the 0.5 (,743.39) and 0.618 (,542.51) retracement levels. The current price of ,676.86 sits directly in the middle of this corrective zone.
All three EMAs (20, 50, 200) are positioned above price on the daily timeframe and are beginning to converge bearishly — a structural sign that the trend remains downward. RSI (14) is at 38–40 range, showing bearish momentum without yet reaching extreme oversold territory, which means there is room to run lower before a significant technical bounce. MACD is in negative territory with the histogram declining.
The 4H chart shows a series of lower highs from the ,000+ range, with each rally attempt being capped below declining EMAs. The Bollinger Bands are expanding to the downside, confirming momentum is with sellers. A retest of the 0.618 Fib at ,542.51 is the primary target for bears; a break below that level opens the path to ,258 (0.786 Fib).

A Dark Cloud Cover formation appeared on the weekly chart around the ,261–,597 zone in late January/early February, which historically signals a high-probability reversal at cyclical peaks. This was confirmed by a Bearish Engulfing candle on the daily chart that closed below the ,000 psychological support, which had held since early February. The descending channel from the ATH remains structurally intact, with each corrective rally being rejected at the upper channel line.
Confirmation of further downside would require a daily close below the ,542.51 (0.618 Fib) level with rising volume. Bulls would need to see a daily close above ,800.46 (this week’s high) to signal any meaningful structural shift. The current inside bar pattern on the 4H chart suggests a short-term consolidation before the next directional move — traders should watch for a break of Friday’s range (,553–,800) for the next catalyst.
| Level Type | Price | Basis | Significance |
|---|---|---|---|
| Strong Resistance | 5,192.81 | 0.236 Fibonacci | First major Fib from ATH — now overhead resistance |
| Resistance Zone | 4,944.27 | 0.382 Fibonacci | Prior support now flipped to resistance on retest |
| Immediate Resistance | 4,800.46 | Weekly High / EMA 20 | This week’s high — must break to shift short-term bias |
| Immediate Resistance | 4,743.39 | 0.5 Fibonacci | Mid-point retracement — critical pivot for bulls/bears |
| Current Price | 4,676.86 | Daily Close | Closing price — between 0.5 and 0.618 Fib |
| Key Support | 4,542.51 | 0.618 Fibonacci | Golden ratio support — primary bear target |
| Major Support | 4,258.22 | 0.786 Fibonacci | Deep retracement level — secondary bear target |
| Psychological | 4,000.00 | Round Number | Major psychological level — extreme bear scenario |
Gold’s bearish correction from the ,594.56 all-time high remains structurally intact. The descending channel, bearish EMA alignment, and MACD in negative territory all confirm downward momentum. Sell on any rally toward the 0.5 Fibonacci resistance at ,743–,800 zone with a stop above the week’s high. Target is the 0.618 Fib at ,542.51 for a risk/reward of approximately 2.2:1. Consider taking partial profit (50%) at ,632 (mid-point) and running the remainder to the full target.
Silver’s dual identity as both a monetary metal and an industrial commodity is working against it in the current environment. While gold benefits from safe-haven buying flows during the Hormuz crisis, silver’s industrial demand profile — exposed to global manufacturing, solar, and EV sectors — is being discounted by recession risk. The gold-silver ratio has expanded sharply, confirming the market is treating silver as an industrial cyclical rather than a monetary refuge.
Physical supply deficits that characterised 2025 are expected to persist through 2026, driven by solar panel manufacturing growth. However, the forward demand signal from slowing Chinese industrial activity and US tariff uncertainty is undermining spot buying. Silver imports into China — the world’s largest industrial silver consumer — have shown month-on-month weakness, removing a key pillar of support.
The technical damage to silver is more severe than gold. Silver has lost over 39% from its January high of approximately 21.86 (the 0% Fibonacci level on the chart) to current levels near 3. This magnitude of correction reflects genuine structural selling, not a temporary flush — traders should respect the trend and seek short entries on bounces rather than trying to catch a bottom.
The daily chart shows Silver in a major corrective downtrend from the January 2026 high near 21.86. Price has breached below the 0.618 Fibonacci retracement level at 6.60 and is now trading at 3.01, below all three EMAs. The 0.786 Fib at 4.29 is the next major structural support and likely primary target for bears in the coming weeks.
RSI (14) sits at 40.49 on the daily chart — technically oversold but not at extreme levels that would force a significant bounce. The 2025 bull run saw silver sustain RSI in the 40-50 range during consolidations, meaning current readings are consistent with a downtrend pause rather than a reversal. MACD remains in negative territory, and the histogram is declining, confirming ongoing bearish momentum.
The convergence of all three EMAs (20, 50, 200) above price — with the 200 EMA at approximately 3.23 representing a massive overhead barrier — creates a classic bearish EMA stack. Any rally toward the 6–78 resistance zone (0.618 Fib + EMA cluster) should be treated as a shorting opportunity. Volume on down days has been consistently higher than on up days throughout the corrective sequence.

Silver formed a textbook Bearish Engulfing candle on the daily chart in February 2026 around the 19–21 zone — immediately below the all-time high — signalling a high-conviction reversal. This was followed by a rapid break below the 3.88 (0.382 Fib) and 5.24 (0.5 Fib) levels without meaningful support, indicating intense selling pressure. The descending triangle pattern that formed through March and into April has now resolved to the downside, with the breakdown below 6.60 (0.618 Fib) being the key technical signal.
A hammer wick appeared at the March low of approximately 2, suggesting a brief pause in selling, but price recovered only partially before resuming the downtrend. For bulls to regain control, silver needs a weekly close above 6.60 — the broken 0.618 Fib level — ideally with strong volume. Until that occurs, all bounces should be treated as shorting opportunities.
| Level Type | Price | Basis | Significance |
|---|---|---|---|
| Strong Resistance | 104.58 | 0.236 Fibonacci | Major overhead resistance from January ATH range |
| Resistance Zone | 93.88 | 0.382 Fibonacci | Former support — now strong resistance on retest |
| EMA 200 Resistance | 83.23 | 200-day EMA | Long-term trend average — major barrier for any recovery |
| Immediate Resistance | 76.60 | 0.618 Fibonacci | Broken support — critical flip level for short entries |
| Current Price | 73.013 | Daily Close | Below all Fib levels and EMAs — bearish |
| Key Support | 64.29 | 0.786 Fibonacci | Primary bear target — major structural support |
| Major Support | 62.00 | March Low / Structure | March 2026 swing low — significant historical floor |
| Psychological | 50.00 | Round Number | Extreme bear scenario — deep Fibonacci extension |
Silver’s bearish engulfing breakdown from January highs and confirmed break below the 0.618 Fibonacci at 6.60 make this the highest-conviction setup in the commodities complex this week. The descending triangle breakout has been confirmed, and the EMA death cross (20 below 50) adds structural weight to the short thesis. Enter on a rally toward the 4–75 zone (minor bounce off oversold conditions), stop above the broken 0.618 Fib at 8.00, and target the 0.786 Fib at 4.29. Risk/Reward: 2.9:1. Take 50% profit at 9.00.
WTI crude is the clearest expression of the Hormuz crisis in the commodities market. The structural supply shock — with approximately 20 million barrels per day of seaborne oil at risk from Iran’s effective closure of the strait — has been the dominant driver since early March. WTI surged from pre-conflict levels near 2 to a weekly high of 13.97 this week, before pulling back on diplomatic signals from Washington indicating President Trump has informed advisers of a willingness to end the confrontation.
The EIA’s March 10 STEO projected Brent to remain above 5/barrel over the next two months, before falling below 0 in Q3 2026 as transit through the Strait gradually resumes. This creates a compelling “buy the dip” framework for WTI in the near term — Fibonacci retracements on the current rally offer strategic entry points for long positions, with the geopolitical premium still very much embedded in prices. The Baker Hughes rig count rose this week to 548 active rigs, with higher oil prices incentivising US shale producers to expand, though production response typically lags price by 3–6 months.
Near-term, the key fundamental catalysts are ceasefire news and the EIA Weekly Petroleum Status Report. Any signal of Hormuz reopening would likely see a rapid 0–15 de-risking selloff. Conversely, Iranian escalation or additional production shut-ins would push WTI back toward 15–120. Traders must maintain tight risk management given the binary event-driven nature of price action.
The WTI daily chart shows one of the most powerful uptrends in commodities markets this year. Price launched from the 1.0 Fibonacci level (complete retracement) at 5.24 in late 2025 and has rallied aggressively through all retracement levels. The current price of 12.05 is testing the 0% Fibonacci extension level at 19.99, which represents the measured move target from the entire 2025 base and is the first major structural resistance since the rally began.
All three EMAs are positioned far below current price — EMA 20 at approximately 5.49, EMA 50 at 7.54, EMA 200 at 8.07 — reflecting the extraordinary velocity of the Hormuz-driven rally. RSI (14) reads 70.11 on the daily chart, entering overbought territory, which warns that a pullback toward the EMAs is overdue. However, in crisis-driven markets, overbought indicators can persist for extended periods.
The 0.382 Fibonacci retracement at 5.25 aligns almost perfectly with the EMA 20, creating a high-confluence support zone for buy-on-dips strategies. A pullback to this zone (3–97) would be technically healthy and offer a structured long entry with a clearly defined stop below the 0.5 Fib at 7.61. A decisive break above 19.99 would signal further extension toward 30.

WTI’s rally from 5.24 has been characterised by multiple bullish Marubozu candles — large-bodied candles with little to no wicks — indicating overwhelming buy-side conviction on the back of the Hormuz crisis. The ascending channel from the February 2026 lows is well-defined, with price making consistent higher highs and higher lows. The channel midline sits near 5–97, reinforcing the buy zone identified in the technical analysis.
Caution is warranted at the 19.99 Fibonacci resistance level. A Doji or shooting star candle at this level would signal potential exhaustion and a pullback toward 5. Confirmation of continued upside would require a daily close above 20 with volume, which would open the path to 30+. Traders should be alert to geopolitical headlines as the primary candle-formation driver at this juncture.
| Level Type | Price | Basis | Significance |
|---|---|---|---|
| Major Resistance | 119.99 | 0% Fibonacci / ATH zone | Measured move target — primary resistance for this rally |
| Weekly High | 113.97 | Intraday Spike High | This week’s high — resistance until definitively broken |
| Current Price | 112.05 | Daily Close | Strong close — near 3-year highs |
| Immediate Support | 104.70 | 0.236 Fibonacci | First Fib pullback support on any correction |
| Key Support | 95.25 | 0.382 Fib / EMA 20 | High-confluence buy zone — EMA 20 aligns here |
| Major Support | 87.61 | 0.5 Fibonacci | Mid-point of the rally — psychological and technical floor |
| Deep Support | 79.97 | 0.618 Fibonacci | Golden ratio support — stop-loss zone for long positions |
| Psychological | 100.00 | Round Number | 00/barrel — major psychological support on pullbacks |
WTI’s Hormuz-driven uptrend is structurally bullish with ADX at 45, confirming a very strong trend. The overbought RSI at 70+ and the 19.99 Fibonacci resistance overhead increase the likelihood of a short-term pullback toward the 0.382 Fib / EMA 20 confluence at 5–97 before the next leg higher. Buy the dip at 7 with a stop below the 0.5 Fib at 0. Target 13 (previous week’s high) for R/R of 2.3:1. Ceasefire headlines are the key risk — maintain smaller position sizing than usual given event-driven binary risk.
Natural Gas has decoupled entirely from the crude oil rally, demonstrating a fundamentally different supply/demand dynamic. Despite the Hormuz crisis affecting global LNG flows, US Henry Hub prices remain suppressed by above-seasonal storage levels. Mild February and early March temperatures across the major US heating regions left storage inventories well above the five-year seasonal average, reducing winter demand drawdowns that would typically support prices.
The EIA’s March STEO projects Henry Hub to average .80/MMBtu through 2026 — down 13% from previous forecasts — citing both the warmer-than-expected winter and the anticipated surge in associated natural gas production as higher oil prices drive increased US shale drilling activity. Each new oil well drilled in the Permian Basin produces associated gas, which adds to the domestic supply glut without any market-responsive drilling decision.
The next directional catalyst for natural gas is the weekly EIA Natural Gas Storage Report. The market needs to see a storage withdrawal larger than seasonal expectations to shift sentiment. Spring shoulder season — April through May — is traditionally the weakest demand period for natural gas, making a meaningful price recovery unlikely in the near term without a significant weather shock or unexpected LNG export demand.
The Natural Gas daily chart presents one of the most defined downtrends of any commodity. From the January 2026 spike high near .50 (the 1.0 Fibonacci level), price has retraced the entire move and is now sitting at .800 — exactly at the 0% Fibonacci base of .780. This level represents the 2025 base from which the entire winter rally launched, making it the most critical structural support on the chart.
RSI (14) reads 39.60 on the daily chart — approaching oversold territory but not yet at an extreme. EMA alignment is decisively bearish: EMA 20 (.024), EMA 50 (.357), and EMA 200 (.771) are all stacked above price and declining in a classic bearish formation. Any bounce is likely to be capped at the EMA 20 at .024, which represents the first meaningful resistance level on the chart.
The price action since February shows a clean descending channel with consistent lower highs and lower lows. Volume has been declining on rally days and increasing on down days — a textbook bearish volume profile. A daily close below .780 (the Fibonacci base) would signal a fresh leg lower toward .65–2.50, the next structural support area from 2024 price action.

The Natural Gas chart features an Evening Star candlestick formation at the January 2026 peak — a classic three-candle reversal pattern consisting of a large bullish candle, a small-bodied star, and a bearish engulfing close. This formation at the .499 Fibonacci peak was the trigger for the entire corrective downtrend. The subsequent price action has been remarkably clean, with the descending channel from January showing no signs of structural exhaustion at the time of writing.
The .780 Fibonacci base is the one level where a reversal candle would carry significance. A bullish hammer or morning star formation at this level — ideally with a RSI divergence (price makes new low but RSI does not) — would be the technical trigger for a potential mean-reversion bounce toward .024 (EMA 20). However, confirmation requires a close back above .024 to shift the short-term bias. Until then, treat any bounce as a selling opportunity.
| Level Type | Price | Basis | Significance |
|---|---|---|---|
| Strong Resistance | 4.582 | 0.382 Fibonacci | Mid-range Fibonacci resistance — distant target on any bounce |
| EMA 200 Resistance | 3.771 | 200-day EMA | Long-term average — major overhead barrier |
| EMA 50 Resistance | 3.357 | 50-day EMA | Mid-term trend — key cap for any bear-market rally |
| Immediate Resistance | 3.024 | EMA 20 | Short-term trend average — first target on any bounce |
| Current Price | 2.800 | Daily Close | At major Fibonacci base support — critical decision zone |
| Key Support | 2.780 | 0% Fibonacci Base | 2025 launch base — most critical support on chart |
| Major Support | 2.650 | 2024 Structure | Historical price action support from 2024 lows |
| Deep Support | 2.400 | Psychological / Structure | Extreme downside target if .780 breaks convincingly |
Natural gas remains in a structurally bearish downtrend from the January .50 spike high, with EMA 20/50/200 all stacked above price. The current consolidation at the .780 Fibonacci base offers a short opportunity on any bounce toward the .94–3.02 resistance zone (near EMA 20). Sell at .940 with a stop above the .10 structural resistance, targeting the .65 historical support level for R/R of approximately 1.8:1. The EIA storage report is the key intraweek risk event — wait for release before initiating if timing allows.
How to Capitalise on This Week’s Commodity Moves with Capital Street FX
Four high-impact setups across gold, silver, crude oil, and natural gas — executed with maximum precision on the ALTX platform.
With WTI swinging 0–15/barrel on single headlines, Capital Street FX’s 0.0 pip spreads and zero slippage execution ensure you get exactly the price you see. Access crude oil CFDs with up to 1:10,000 leverage.
Gold’s ,594 to ,676 corrective move has been one of the most tradeable trends of 2026. ALTX’s integrated Fibonacci tools and real-time level alerts make identifying the next entry zone effortless.
The Hormuz situation makes this one of the most volatile commodity environments in years. Practice all four setups — gold, silver, oil, and gas — on a fully funded demo account before committing live capital.
Key Events — Week of April 4, 2026
| GMT Time | Market | Event | Forecast | Previous | Actual | Impact |
|---|---|---|---|---|---|---|
| Released | USD | NFP (March) | 185K | 151K | 228K ✓ | HIGH |
| Released | USD | ISM Services PMI | 52.8 | 53.5 | 50.8 ✗ | HIGH |
| Released | OIL | EIA Crude Oil Inventories | -1.2M | +3.6M | -4.1M ✓ | HIGH |
| Released | GAS | EIA Nat Gas Storage | +28 Bcf | +15 Bcf | Pending | HIGH |
| Apr 7 · 13:00 | OIL | EIA Short-Term Energy Outlook | – | – | Pending | HIGH |
| Apr 7 · 12:30 | USD | Initial Jobless Claims | 220K | 224K | Pending | MED |
| Apr 8 · Ongoing | IRAN | Hormuz Diplomatic Talks | – | – | Evolving | HIGH |
| Apr 9 · 12:30 | USD | CPI (March) | 3.2% | 3.1% | Pending | HIGH |
Your Questions Answered — April 4, 2026
Weekly Bias Summary & Outlook — April 4, 2026
This week confirmed that the Hormuz crisis has created a fundamentally divergent commodities landscape. Energy markets have repriced supply risk, with WTI crude rallying 13.3% in a single session as the market absorbed new disruption data. Meanwhile, precious metals are being pulled in opposite directions — geopolitical safe-haven demand provides a floor, but the Federal Reserve’s hawkish hold (reinforced by 228,000 NFP jobs in March) keeps real yields elevated and caps gold and silver upside decisively. Natural gas remains the most isolated market in the complex, driven entirely by domestic storage and weather fundamentals that have kept it in a relentless downtrend since January.
The structural macro theme for this week and beyond is the tension between the energy-supply shock (inflationary, dollar-negative in theory) and the Federal Reserve’s determination to hold rates until labour market data weakens meaningfully. This creates a stagflation-adjacent environment where crude oil can rally on supply constraints while gold struggles against high real yields — an unusual but historically precedented combination. Silver, caught between weak industrial demand expectations and a firm dollar, faces the most challenging fundamental backdrop of all four commodities.
The most critical catalyst remaining this week is the EIA Short-Term Energy Outlook on Monday April 7 at 13:00 GMT. Updated Hormuz production assumptions will directly reset crude oil price forecasts across the market. US CPI on April 9 (12:30 GMT) is the next major macro event — an upside surprise would further reduce rate-cut expectations and add selling pressure to gold and silver. Hormuz diplomatic talks remain fluid and headline-driven throughout the week.
Looking 3–5 days ahead: WTI crude retains a bullish bias as long as Hormuz remains effectively closed, though RSI overbought conditions at 70+ make a 5–100 pullback the higher-probability path before resuming the uptrend. Gold and silver maintain bearish structures — gold targets ,542 (0.618 Fib), silver targets 4.29 (0.786 Fib). Natural gas remains in a downtrend with .650 as the primary target; a close below .780 is the key trigger for acceleration lower.