Tariff Shockwaves & Commodity Markets | April 7, 2026: Gold Steadies at $4,654, Crude Hits $114.83 Amid Global Trade Tensions
Tariff Shockwaves Hit Commodities: Gold Holds $4,654, Silver Retreats to 0.618 Fib, Crude Surges to $114.83 & Copper Coils Above Key Support
Daily Commodity Market Report covering Gold (XAU/USD) · Silver (XAG/USD) · WTI Crude Oil (USOIL) · MCX Copper Futures — Fundamentals, News & Trade Setups for April 7, 2026
What You Need to Know Before You Trade Commodities Today
Commodity markets are navigating a high-volatility environment defined by sweeping US tariff escalations that are simultaneously supporting safe-haven demand in Gold and Silver while sending industrial commodity signals in conflicting directions. Crude Oil has surged aggressively to $114.83 on supply-side optimism, while MCX Copper consolidates above critical Fibonacci support at ₹1,165 despite global growth uncertainty. The tariff narrative — underpinned by the Supreme Court’s ongoing review of White House trade authority under IEEPA — is the dominant structural driver reshaping commodity market price paths in Q2 2026. Intraday volatility is elevated across all four instruments, and position sizing must account for headline risk from Washington.
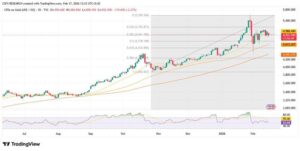
- ⚠ Gold (XAU/USD) — Cautious Bearish: Trading at $4,654 near the critical 0.618 Fibonacci retracement at $4,543. Price has rejected from February’s all-time high at $5,602. A sustained break below $4,543 opens the path toward $4,255.
- ▼ Silver (XAG/USD) — Bearish: At $72.32, Silver has corrected sharply from February’s $121.85 high, sitting on the 0.618 Fib ($76.38) having recently breached it. RSI at 43 with momentum turning lower.
- ▲ WTI Crude Oil — Bullish: USOIL surged to $114.83, approaching the prior swing high near $119.61. The ascending trendline from January 2026 lows is intact and MAs are stacked bullishly. RSI at 71 — overbought territory requires caution.
- ⚠ MCX Copper — Cautiously Neutral: At ₹1,165, Copper holds above the 0.618 Fibonacci retracement at ₹1,174 — a key support confluence. RSI at 48 with weak momentum. Watch for a decisive directional break.
Price Snapshot — April 7, 2026
Live Trade Setups — April 7, 2026
The Macro Picture Driving Today’s Commodity Market
Tariffs as the Dominant Commodity Driver
The sweeping US reciprocal tariff regime — introduced under executive authority and now under Supreme Court scrutiny via the IEEPA case — is the single most important structural variable shaping commodity prices in Q2 2026. Tariffs function as a stagflationary shock in commodity markets: they simultaneously raise the cost of imported raw materials (supporting prices), suppress global trade flows and demand (undermining industrial commodity prices), and create safe-haven urgency in monetary metals like Gold and Silver. Today’s commodity market is navigating all three of these contradictory forces at once, which explains the divergent price behaviour across today’s four instruments.
Gold — Safe Haven Demand vs. Corrective Pressure
Gold’s fundamental picture is defined by a war between two powerful forces. On one side, tariff uncertainty, a weakening dollar, and geopolitical risk have sustained safe-haven demand throughout Q1 2026, driving XAU/USD from below $3,900 in October 2025 to an all-time high near $5,602 in February 2026. On the other side, the magnitude of that rally has created significant corrective pressure. The Fed’s easing path is largely priced in, real yields — though still negative — are stabilising, and ETF flows have slowed. The commodity market’s current challenge for Gold is that the bull case requires a fresh catalyst to sustain upside above $4,948 (the 0.382 Fib), while the bear case needs a decisive close below $4,543 (0.618 Fib) to confirm that the correction is structural rather than temporary.
Silver — Industrial Demand Weakness Compounds Corrective Pressure
Silver’s dual nature — monetary metal and industrial input — makes it uniquely exposed to the tariff environment. Unlike Gold, Silver cannot rely purely on safe-haven demand when global manufacturing PMIs are contracting. The tariff shock has reduced manufacturing activity in export-heavy economies, denting silver demand in electronics, solar panels, and industrial applications. This industrial demand weakness compounds the technical correction from February’s high near $121.85 and has driven XAG/USD through multiple Fibonacci support levels. The commodity market now places Silver at the 0.618 retracement ($76.38), and the breach of this level with sustained bearish momentum is a structurally negative signal.
WTI Crude Oil — Supply Disruption Narrative Overrides Demand Fears
Crude Oil’s surge to $114.83 appears to contradict the bearish demand narrative implied by tariff-driven global slowdown fears. The explanation lies in supply-side dynamics that the commodity market has given priority to. OPEC+ output discipline — including an unexpected supplementary cut announced in late March 2026 — has reduced available supply precisely as US sanctions on Venezuelan crude and ongoing Middle East supply risk have tightened the physical market. The commodity market’s pricing signal is clear: supply scarcity is currently more powerful than demand uncertainty. The ascending trendline from January 2026 lows, the stacked bullish MAs, and the approach toward the prior high of $119.61 all support the bullish structural narrative for WTI — though RSI above 70 demands respect and suggests pullbacks should be expected before further upside.
MCX Copper — The Bellwether for Global Growth Expectations
MCX Copper’s consolidation at ₹1,165 — near the 0.618 Fibonacci retracement at ₹1,174 — reflects the commodity market’s genuine uncertainty about global growth. Copper is the purest proxy for industrial demand, and in a tariff environment, the growth outlook is deeply uncertain. On one hand, Chinese stimulus measures and better-than-expected early 2026 manufacturing data argue for a floor under copper demand. On the other hand, US-China trade tensions and the broader global trade slowdown risk are significant headwinds. The commodity market appears to be in “wait and see” mode for Copper, holding price above the 0.618 Fib while waiting for a definitive signal from global PMI data or Chinese stimulus announcements that could resolve the standoff.
Dollar Weakness as a Commodity Tailwind
One structural factor working in favour of commodities broadly is the weakening US dollar. The DXY has been in a sustained downtrend since its January 2025 peak above 110, losing approximately 9.4% across 2025 and continuing to soften in 2026 as the Fed eases and tariff uncertainty erodes dollar safe-haven premium. Since most globally traded commodities are priced in dollars, a weaker dollar makes commodities cheaper in non-dollar terms — stimulating demand and supporting prices. This dollar tailwind is a meaningful fundamental support for Gold, Silver, and Crude Oil in today’s commodity market, even when other fundamentals are mixed.
Fundamental View
Gold’s fundamental backdrop remains deeply supportive over the medium term, but the near-term picture is more nuanced. The tariff regime has created persistent safe-haven demand — Gold is the commodity market’s primary hedge against policy uncertainty, and the Supreme Court’s IEEPA review keeps that uncertainty firmly elevated. Fed easing — with the funds rate now at 3.75–4.00% and expected to move lower — is structurally bearish for the dollar and supportive for Gold. Real yields, while stabilising, remain negative in the US, reducing the opportunity cost of holding the non-yielding metal.
However, the scale of Gold’s run from below $3,900 in October 2025 to $5,602 in February 2026 has created significant overextension. Much of the tariff and Fed easing narrative is already priced in. ETF inflows have slowed, and speculative long positioning in the futures market has pulled back from record levels. The commodity market is watching for a fresh catalyst — either a new escalation in trade war tensions or a surprise in US inflation or employment data — to determine whether Gold extends its correction toward $4,543 (the 0.618 Fib) or stabilises and begins a recovery toward $4,948 (the 0.382 Fib).
Central bank demand — which averaged over 1,000 tonnes per year in 2023–2025 — remains a structural floor for Gold in the commodity market. Emerging market central banks, particularly in Asia and the Middle East, continue to diversify away from dollar reserves, providing a consistent bid under any meaningful pullback in XAU/USD.
Technical Structure
On the daily chart, Gold peaked near the Fibonacci 0 level ($5,602.89) in February 2026 and has been in a sustained corrective phase since. Price has retraced through the 0.236 ($5,198.19) and 0.382 ($4,947.82) Fibonacci levels and is currently approaching the critical 0.618 retracement at $4,543.11. The current price of $4,654 sits between the 0.5 Fib ($4,745.46) and the 0.618 Fib ($4,543.11) — a zone where bulls and bears are actively contesting direction.
The daily RSI sits at approximately 45 — neutral territory — and the MAs are flattening after the sharp decline from February highs. The ascending trendline from the October 2025 base has been broken, which is a structural negative for the medium-term bias. However, the commodity market’s support at the 0.618 Fib is a meaningful technical level; a daily close below $4,543 would signal a more aggressive corrective move toward $4,255 (the 0.786 Fib). A recovery above $4,745 would neutralise near-term bearish momentum.
Key Fib levels: Resistance at $4,745 (0.5), $4,948 (0.382). Support at $4,543 (0.618), $4,255 (0.786), $3,888 (Fib base).

Candlestick Patterns & Chart Formations
Gold’s daily chart shows price consolidating in the zone between the 0.5 Fibonacci retracement ($4,745) and the 0.618 ($4,543). The most recent daily candles display doji-like formations — classic indecision patterns in the commodity market. This indecision at a major Fibonacci confluence suggests the commodity market is genuinely uncertain about the next directional move and is awaiting a catalyst. The descending structure from the February high remains intact.
The critical chart signal to watch is a decisive daily close outside this range. A close below $4,543 would be a strong bearish signal in the commodity market, confirming the correction has more room to run. A recovery above $4,745 would suggest the corrective wave is complete and a new bullish leg could begin. Traders should avoid over-committing to either direction ahead of a confirmed break.
| Level Type | Price | Basis | Significance |
|---|---|---|---|
| ATH / Range Top | $5,602.89 | Fib 0 | February 2026 all-time high |
| Strong Resistance | $5,198.19 | Fib 0.236 | First major resistance above |
| Key Resistance | $4,947.82 | Fib 0.382 | Recovery confirmation level |
| Resistance Zone | $4,745.46 | Fib 0.5 | Near-term ceiling / neutralisation level |
| Current Price | $4,654.12 | Live Market | Between 0.5 and 0.618 Fib — decision zone |
| Critical Support | $4,543.11 | Fib 0.618 | Major Fibonacci support — key decision level |
| Deep Support | $4,255.03 | Fib 0.786 | Extended correction target |
| Major Support | $3,888.03 | Fib 1.0 / Base | Full retracement level |
Gold is in a decision zone between the 0.5 and 0.618 Fibonacci retracements. A bearish setup triggers on a confirmed daily close below $4,543 — targeting $4,255 (0.786 Fib) — with a stop above $4,620. R/R approximately 3:1. Alternatively, a bullish setup activates on a close above $4,745, targeting $4,948 with a stop at $4,630. Patience is key — do not trade inside the consolidation range. Safe-haven demand from tariff headlines can create sharp intraday spikes that invalidate short positions prematurely.
Fundamental View
Silver’s fundamental picture is more complex than Gold’s because of its industrial demand component. While Gold benefits almost purely from safe-haven dynamics, Silver’s price is simultaneously influenced by monetary metal demand and real-world industrial use in electronics, photovoltaics, and automotive applications. In a tariff environment, the industrial demand side is under significant pressure — global manufacturing PMIs are contracting, solar installation pipelines are being re-evaluated amid supply chain uncertainty, and automotive production has slowed in key markets.
The commodity market has clearly given weight to the industrial demand headwind over the safe-haven tailwind in Silver’s recent price action. The sharp correction from $121.85 in February to the current $72.32 represents a 40% decline — far more aggressive than Gold’s correction from its high — and reflects the market’s view that Silver’s industrial demand floor is fragile in the current macro environment. The 0.618 Fibonacci retracement at $76.38 has been breached, which is a structurally bearish signal in the commodity market.
The primary scenario for Silver stabilisation would be a meaningful recovery in global manufacturing PMIs, a resolution of US tariff uncertainty, or a sharp acceleration in green energy infrastructure investment (which is a key driver of silver demand). None of these catalysts appears imminent in the short term, maintaining the bearish fundamental bias for the commodity market.
Technical Structure
Silver’s daily chart shows a pair that peaked at the Fibonacci 0 level ($121.85) in February 2026 and has been in a sustained downtrend since. Unlike Gold, which has slowed its descent near the 0.618 Fib, Silver has already broken below its 0.618 retracement at $76.38. The current price of $72.32 sits between the 0.618 ($76.38) and 0.786 ($64.02) Fibonacci retracements — a bearish zone that suggests the correction is likely to continue.
The daily RSI at approximately 43 is approaching oversold territory but has not yet reached it — there is still room for further downside before a technical bounce becomes likely. The moving averages are stacked bearishly below the descending trendline from the February high. A recovery above $76.38 (the 0.618 Fib — now acting as resistance) would be needed to neutralise the bearish bias. Below current price, the $64.02 level (0.786 Fib) is the next major support in the commodity market.
Key Fib levels: Resistance at $76.38 (0.618 — now resistance), $85.06 (0.5), $93.74 (0.382). Support at $64.02 (0.786), $48.35 (base area).

Candlestick Patterns & Chart Formations
Silver’s daily chart is displaying a classic bearish breakdown pattern in the commodity market. The sequential breaks through the 0.236, 0.382, 0.5, and now 0.618 Fibonacci levels — each acting as resistance on the way back up rather than support — are a textbook sign of a sustained downtrend with persistent institutional selling at key levels. The commodity market is not seeing meaningful buying support at these retracement levels, which is a bearish structural signal.
The current price action below the 0.618 Fib at $76.38 means this level has now flipped from support to resistance in the commodity market. Traders should treat any rally toward $76.38 as a potential sell opportunity rather than a recovery signal, unless accompanied by a decisive fundamental catalyst. The 0.786 Fib at $64.02 is the next meaningful support level in the commodity market.
| Level Type | Price | Basis | Significance |
|---|---|---|---|
| ATH / Range Top | $121.85 | Fib 0 | February 2026 all-time high |
| Strong Resistance | $104.49 | Fib 0.236 | Major structural resistance above |
| Resistance Zone | $93.74 | Fib 0.382 | Secondary resistance level |
| Resistance Zone | $85.06 | Fib 0.5 | Mid-retracement resistance |
| Key Resistance (Flipped) | $76.38 | Fib 0.618 | Former support — now resistance after break |
| Current Price | $72.32 | Live Market | Below 0.618 Fib — bearish zone |
| Key Support | $64.02 | Fib 0.786 | Next major support level in correction |
| Major Support | $48.35 | Fib 1.0 / Base | Full retracement — extreme downside target |
Silver has broken below the 0.618 Fibonacci support at $76.38 — now resistance. Sell on any bounce toward the $73.50 zone, targeting the 0.786 Fib at $64.02. R/R 2.3:1. The sequential Fibonacci breakdown, bearish RSI trajectory, and industrial demand headwinds from the tariff environment all support this sell setup. Stop above $77.50 — well clear of the flipped 0.618 Fib resistance at $76.38. Reduce position if RSI approaches 25 (deeply oversold) before the $64 target is reached.
Fundamental View
WTI Crude Oil’s surge to $114.83 is being driven by a powerful combination of supply-side discipline and geopolitical risk premium. OPEC+ announced an additional 500,000 barrel-per-day output reduction in late March 2026, surprising the commodity market which had anticipated a softer stance given slowing global growth fears. Saudi Arabia has signalled its intention to maintain price support above $110 per barrel — a level it considers necessary to fund its Vision 2030 diversification agenda. This pricing floor from the producer side is a strong fundamental anchor for the commodity market in the near term.
On the geopolitical side, ongoing tensions in the Middle East — particularly around shipping lane security in the Strait of Hormuz — continue to add a risk premium to oil prices. Any escalation could produce sharp intraday moves in the commodity market. Additionally, US sanctions on Venezuelan crude exports, which took effect in February 2026, have tightened the Western Hemisphere supply picture, supporting WTI specifically versus Brent.
The demand-side risks in the commodity market are real but have been largely discounted by traders who are prioritising supply scarcity over demand growth uncertainty. If global PMI data deteriorates significantly in the coming weeks, that calculus could shift — but for now, the commodity market’s fundamental bias for Crude Oil remains firmly bullish.
Technical Structure
WTI Crude Oil’s daily chart shows a remarkable bullish structure that has been building since the January 2026 lows near $61.46. The ascending trendline from those lows is intact and well-defined, with price respecting this support line on each pullback. The commodity market has driven USOIL through the 0.786 ($73.92), 0.618 ($83.69), 0.5 ($90.54), 0.382 ($97.40), and 0.236 ($105.89) Fibonacci retracement levels — all of which now act as support in the bullish structure.
Current price at $114.83 is approaching the Fibonacci 0 level at $119.61 — the prior swing high from which the measured Fibonacci grid was constructed. A break and daily close above $119.61 would signal a new bullish leg in the commodity market with open upside toward $125+. The bullish MA stack — with 20-day, 50-day, and 200-day EMAs all below current price — is a textbook sign of trend strength. The only caution flag is the RSI approaching 72 — overbought territory that historically precedes short-term pullbacks in the commodity market, even within sustained uptrends.
Key Fib levels: Support at $105.89 (0.236), $97.40 (0.382), $90.54 (0.5). Resistance at $119.61 (0 / prior high). Trendline support currently around $108–109 range.

Candlestick Patterns & Chart Formations
WTI Crude Oil’s daily chart displays a textbook bullish trend structure. The ascending trendline from January 2026 lows has been respected on every pullback, and the moving averages are stacked in a bullish sequence (20-day above 50-day above 200-day below price). Each dip in the commodity market has been bought aggressively, confirming that institutional buyers are present and active at lower levels.
The approaching RSI overbought reading (currently near 72) is the primary near-term caution. In sustained commodity market uptrends, RSI can remain overbought for extended periods — but historically, when RSI reaches 72–75 in USOIL, short-term pullbacks of 3–5% have been common before resumption. The key pullback levels to watch are $109 (ascending trendline) and $105.89 (0.236 Fib). These would be buy-the-dip opportunities in the current commodity market environment.
| Level Type | Price | Basis | Significance |
|---|---|---|---|
| Key Resistance / Target | $119.61 | Fib 0 / Prior High | Break above opens new bull leg |
| Current Price | $114.83 | Live Market | Near resistance — RSI overbought caution |
| Trendline Support | ~$109.00 | Ascending Trendline | Dynamic support — key buy-the-dip level |
| Immediate Support | $105.89 | Fib 0.236 | First Fibonacci support below price |
| Key Support | $97.40 | Fib 0.382 | Medium-term pullback support |
| Deep Support | $90.54 | Fib 0.5 | Deeper correction level |
| Base Support | $61.46 | Fib 1.0 / Base | January 2026 swing low — full retracement |
WTI Crude Oil is in a confirmed bullish trend with intact ascending trendline and bullish MA stack. The best entry is on pullbacks toward the trendline support (currently ~$109–$113 range) rather than chasing at current overbought RSI levels. Entry at $113.50, targeting the prior high zone at $119.00. R/R 2.1:1. Stop below $110.80 — well clear of the ascending trendline. The OPEC+ supply discipline and geopolitical risk premium provide the fundamental backing for this commodity market setup. If RSI cools to below 60 on a pullback, the trade setup becomes even more compelling — add aggressively on any dip to the $109 trendline with a stop at $107.
Fundamental View
MCX Copper’s consolidation at ₹1,165 — near the 0.618 Fibonacci retracement at ₹1,174 — reflects the genuine two-sided nature of copper’s fundamental picture in the current commodity market. Copper is the most economically sensitive major commodity, and its price trajectory is essentially a real-time vote on global growth expectations. In today’s tariff-fractured world, that vote is deeply uncertain.
The bull case for copper in the commodity market rests on Chinese demand resilience. China consumes approximately 55% of global refined copper, and Beijing’s stimulus measures — including infrastructure spending commitments announced in March 2026 — have provided a floor under copper demand. China’s manufacturing PMI rebounding to 50.4 in March is encouraging, and early Q1 2026 import data was stronger than seasonal norms. The green energy transition (EV batteries, solar installations, grid upgrades) provides a structural long-term demand tailwind that the commodity market is reluctant to fully price out even in the near term.
The bear case centres on the US tariff regime’s impact on global manufacturing and trade. If tariffs remain in place and escalate, global industrial production will contract — reducing copper demand across electronics, construction, and manufacturing. The commodity market is genuinely uncertain which force wins in the short term, which explains the tight consolidation range Copper has been trading in since mid-February 2026.
Technical Structure
MCX Copper’s daily chart shows a well-defined corrective structure from the December 2025 / January 2026 highs near ₹1,483.60 (the Fibonacci 0 level). Price has retraced through the 0.236 (₹1,365.40), 0.382 (₹1,292.30), 0.5 (₹1,233.20), and is currently sitting just above the 0.618 Fibonacci retracement at ₹1,174.05. Unlike Silver, which has already broken its 0.618 Fib, Copper is still respecting this level as support — a meaningful distinction in the commodity market.
The daily RSI at approximately 48 is neutral — not providing a directional signal. The moving averages are converging and flattening, confirming the consolidation pattern. The ascending trendline from early 2025 lows continues to provide some context below current price, though it is no longer the primary driver of price action. The key commodity market signals to watch for Copper are: (a) a daily close below ₹1,174 with follow-through toward ₹1,090 (0.786 Fib); or (b) a decisive break above ₹1,233 (0.5 Fib) confirming recovery momentum toward ₹1,292 (0.382 Fib).
Key Fib levels: Resistance at ₹1,233 (0.5), ₹1,292 (0.382). Support at ₹1,174 (0.618), ₹1,090 (0.786), ₹982.75 (Fib base).

Candlestick Patterns & Chart Formations
MCX Copper’s daily chart shows a prolonged consolidation phase directly above the 0.618 Fibonacci retracement at ₹1,174. This is a classic “coiling” pattern in the commodity market — price is compressing between support and the flattening moving averages, with decreasing volatility (reflected in the narrow Bollinger Band squeeze). Such patterns typically precede a significant directional break, and the direction of that break is the commodity market’s key question for Copper.
The ADX reading below 20 confirms there is currently no dominant trend in Copper. Traders in the commodity market should not attempt to trade inside this consolidation range — the risk/reward of range trading is poor when a breakout is imminent. Instead, the optimal approach is to wait for a confirmed daily close outside the consolidation range (either above ₹1,233 or below ₹1,174) before committing to a directional position.
| Level Type | Price (₹/kg) | Basis | Significance |
|---|---|---|---|
| Range Top / ATH | ₹1,483.60 | Fib 0 | December 2025 / January 2026 high |
| Strong Resistance | ₹1,365.40 | Fib 0.236 | First major resistance above |
| Resistance Zone | ₹1,292.30 | Fib 0.382 | Recovery confirmation level |
| Breakout Level | ₹1,233.20 | Fib 0.5 | Key resistance — above confirms recovery |
| Current Price | ₹1,165.15 | Live Market | Just above 0.618 Fib — decision zone |
| Critical Support | ₹1,174.05 | Fib 0.618 | Major Fibonacci support — must hold |
| Deep Support | ₹1,089.95 | Fib 0.786 | Extended correction target on break |
| Base Support | ₹982.75 | Fib 1.0 / Base | Full retracement level |
MCX Copper is in a classic breakout-pending consolidation at the 0.618 Fibonacci retracement (₹1,174). A bearish setup triggers on a confirmed daily close below ₹1,174, targeting ₹1,090 (0.786 Fib) — R/R approximately 2.5:1 with a stop at ₹1,200. A bullish setup triggers on a confirmed daily close above ₹1,233 (0.5 Fib), targeting ₹1,292 (0.382 Fib) — R/R approximately 2:1 with a stop at ₹1,195. Do NOT trade inside the current consolidation range. Chinese PMI and US tariff headline risk are the two fundamental catalysts most likely to resolve the directional stalemate.
How to Capitalise on Today’s Commodity Market with Capital Street FX
Four major commodities in motion — tariff shockwaves, supply disruptions, and key Fibonacci levels create high-probability commodity market setups today.
High & Medium Impact Events — April 7, 2026
| GMT Time | Currency/Market | Event | Forecast | Previous | Actual | Impact |
|---|---|---|---|---|---|---|
| All Day | OIL | OPEC+ Output Compliance Watch | — | — | Monitoring | HIGH |
| 08:00 | CNY | China Caixin Services PMI | 51.8 | 51.4 | Pending | HIGH |
| 12:30 | USD | US Initial Jobless Claims | 210K | 219K | Pending | HIGH |
| 14:00 | USD | EIA Crude Oil Inventories | -1.2M bbls | -2.1M bbls | Pending | HIGH |
| 14:30 | USD | Fed Governor Waller Speech | — | — | Pending | HIGH |
| All Day | GLOBAL | US IEEPA Tariff Court Watch | — | — | Monitoring | HIGH |
| Weds | USD | US CPI (MoM) | +0.2% | +0.2% | Tomorrow | HIGH |