Commodity Market Analysis – March 6, 2026 | Gold · Oil · Silver · Copper | CapitalStreet FX
Gold Holds $5,100 as NFP Day Looms; Oil Retreats From 7-Month Peak, Copper Steady on Structural Demand

A comprehensive, active-trader briefing covering Gold, WTI Crude Oil, Silver, and Copper — with live prices, technical analysis, candlestick pattern identification, trade setups, and today’s high-impact economic calendar events across the US, UK, Japan, Australia, Europe, and China.
Market Snapshot
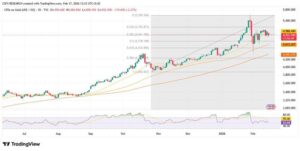
As of 06:30 UTC, March 6 202652-Wk High: $5,595 (Jan 29)
52-Wk Range: $54.98 – $78.40
Support: $80 | $72
Support: $5.70 | $5.10
Friday, March 6 is one of the most data-heavy sessions of the quarter. The February Non-Farm Payrolls report drops at 08:30 ET — a release that arrives against a backdrop already charged by the seven-day US–Iran military conflict, Brent crude pulling back from seven-month highs, and gold consolidating after touching $5,400 earlier this week. Every commodity on the board will feel today’s labour print.
Market-Moving News — Last 10 Hours
Breaking Catalysts for the Next 24 HoursKey Developments Driving Commodity Prices Today
| Story | Commodity Impact | What Happened | Market Bias |
|---|---|---|---|
| 🇺🇸 US–Iran War Day 7 | Oil, Gold, NatGas | Operation Epic Fury ongoing. Strait of Hormuz transits collapsed from 24/day to 4 on March 1. Brent surged 16% this week. Trump signalled “imminent action” to ease oil prices; Treasury eased curbs on India buying Russian crude. Brent pulled back toward $80–$84 range from earlier spike highs. | Oil Bullish |
| 📊 US NFP — Feb 2026 | All Commodities, DXY | Released today at 08:30 ET. Consensus: 60K jobs (prev: 130K in Jan). A miss below 45K increases Fed rate-cut bets → USD weakens → Gold, Silver, Copper rally. A beat above 90K → USD strength → headwind for metals. CME FedWatch: 98% probability Fed holds at 3.50–3.75% in March. | LIVE EVENT |
| 💰 Gold Retreat from Records | Gold, Silver | Gold hit all-time high of $5,595 on Jan 29; pulled back to $5,081 on stronger USD. Now stabilising ~$5,113. Technical correction described as “healthy” by analysts. J.P. Morgan maintains $6,300 target by end-2026. RSI at 47 — not oversold; MACD rising in negative territory. | Consolidation |
| 🔋 Copper AI/EV Demand Story | Copper | LME copper hit $13,238/ton in January — a historical high. AI data centres use up to 10× more copper than traditional facilities. Projected 1-million-metric-tonne supply deficit in 2026. Institutional rotation from gold into copper confirmed by positioning data. J.P. Morgan and Citi maintain $11,000–$14,000/t targets. | Structural Bull |
| 🌊 LNG Supply Shock | Natural Gas | Qatar halted LNG output following Iranian strikes. Qatar + UAE represent ~20% of global LNG supply. European gas futures spiked 25% on news of an Iranian attack on a Saudi refinery. Henry Hub spot averaged $7.72/MMBtu in January (Winter Storm Fern effects still rippling). US NatGas futures today at ~$2.93 — Strong Sell signal per Investing.com technicals. | Technically Bearish |
| 📉 World Bank Downgrade | Broad Commodities | World Bank projects commodity prices to hit 6-year lows in 2026 — 4th consecutive year of decline. Energy index expected to fall as global oil supply glut reaches 65% above 2020 levels. Precious metals exception: forecast to rise 5%. “Structural surplus” in oil even as OPEC+ unwinds cuts. | Long-Term Bearish Oil |
High-Impact Economic Calendar
USA · UK · Europe · Japan · Australia · China — March 6, 2026The following events carry the highest probability of moving commodity markets in the next 24 hours. All times shown in UTC unless otherwise noted.
| Time (UTC) | Country | Event | Previous | Forecast | Impact | Commodity Relevance |
|---|---|---|---|---|---|---|
| 00:30 | 🇯🇵 Japan | Household Spending YoY (Jan) | −2.3% | −0.8% | Medium | JPY pairs, weak data supports BoJ pause → Gold neutral |
| 00:30 | 🇦🇺 Australia | RBA Statement on Monetary Policy | — | Hawkish Guidance | High | AUD, copper demand signals; bearish on industrial metals if dovish |
| 02:30 | 🇨🇳 China | Caixin Composite PMI (Feb) | 51.1 | 50.8 | High | Copper, iron ore, oil demand. PMI ≥50.5 = bullish copper catalyst |
| 07:00 | 🇩🇪 Germany | Factory Orders MoM (Jan) | +6.9% | +0.5% | Medium | EUR, copper/aluminium industrial demand; miss = EUR negative |
| 08:00 | 🇬🇧 UK | Halifax House Price Index MoM | +0.7% | +0.4% | Low | GBP, limited direct commodity impact |
| 10:00 | 🇪🇺 Europe | ECB Economic Bulletin | — | Dovish signals expected | Medium | EUR/USD, gold; dovish ECB = USD relatively firm = gold headwind |
| 13:30 | 🇺🇸 USA | Non-Farm Payrolls (Feb) 🔴 LIVE | 130K | 60K | 🔴 CRITICAL | All commodities; miss = gold/silver rally; beat = USD strength |
| 13:30 | 🇺🇸 USA | Unemployment Rate (Feb) | 4.3% | 4.3% | High | Jump to 4.5%+ = Fed rate-cut narrative = commodity bullish |
| 13:30 | 🇺🇸 USA | Average Hourly Earnings YoY (Feb) | 3.7% | 3.7% | High | Wages above 4% = stagflation concern = gold spike |
| 15:00 | 🇺🇸 USA | Michigan Consumer Sentiment (Prelim, Mar) | 64.7 | 63.0 | Medium | USD sentiment, gold safe-haven demand |
| 18:00 | 🇺🇸 USA | Baker Hughes Rig Count (Mar 6) | 581 | ~585 | Medium | WTI crude; rising rigs signal supply expansion — mild bearish oil |
Technical Analysis & Trade Setups
Gold · WTI Crude Oil · Silver · Copper — March 06, 2026Each analysis below is built from daily and H4 chart data pulled from TradingView and Investing.com, cross-referenced with FXStreet and LiteFinance technical commentary published within the last 10 hours. Prices reflect early European session March 6, 2026.

Candlestick Pattern Analysis — Daily Chart
| Pattern | Location | Signal | Implication | Reliability |
|---|---|---|---|---|
| Hammer | Near $5,153 support (Mar 4) | Bullish Reversal | Strong rejection of lows; buyers absorbing selling pressure at key level | ⭐⭐⭐⭐ |
| Dragonfly Doji | $5,107–$5,154 zone (Mar 5) | Bullish Indecision → Reversal | Bears tried and failed to close lower; accumulation underway. Confluence with RSI at 47 turning up | ⭐⭐⭐⭐ |
| Bearish Engulfing (Prior) | $5,342–$5,400 area (Mar 1–2) | Triggered Correction | Initiated current 5%+ pullback from ATH region. Now acting as resistance | ⭐⭐⭐⭐⭐ |
| MFI Reversal | Daily (Mar 5–6) | Liquidity Inflow | Money Flow Index turned up from lower boundary → fresh capital entering | ⭐⭐⭐ |

Candlestick Pattern Analysis — Daily Chart
| Pattern | Location | Signal | Implication | Reliability |
|---|---|---|---|---|
| Marubozu Bullish (Series) | Mar 1–4: $63 → $78 | Strong Bull Thrust | Consecutive full-bodied bull candles with minimal wicks = extreme buy-side dominance driven by Hormuz closure | ⭐⭐⭐⭐⭐ |
| Shooting Star (Forming) | Near $78.40 (52-Wk High) | Potential Exhaustion | Upper shadow forming near resistance. Trump statement on easing war premium caused intraday reversal. Watch for confirmation close | ⭐⭐⭐⭐ |
| Inside Bar / Doji | Mar 5–6 (pullback phase) | Consolidation | Market pausing after extreme spike — “retest waiting” phase. Do not chase the $78 high | ⭐⭐⭐ |

Candlestick Pattern Analysis — Daily Chart
| Pattern | Location | Signal | Implication | Reliability |
|---|---|---|---|---|
| Bullish Engulfing | Mar 4–5, near $87–$88 | Bullish Reversal | Strong recovery from short-term pullback; March 5 candle engulfs prior day’s range entirely. Confirms bull trend resumption | ⭐⭐⭐⭐⭐ |
| Three White Soldiers | Mar 3–5 sequence | Strong Bullish Continuation | Three consecutive large bullish candles with minimal upper wicks. Classic trend-continuation pattern — momentum buyers in control | ⭐⭐⭐⭐⭐ |
| Rising Window (Gap Up) | Mar 2 open gap | Gap Support | Gap from Iran conflict onset acting as support; gap fill at ~$88–$90 is a high-conviction buy zone | ⭐⭐⭐⭐ |

Candlestick Pattern Analysis — Daily / Weekly Chart
| Pattern | Timeframe | Signal | Implication | Reliability |
|---|---|---|---|---|
| Rising Three Methods | Weekly Chart | Bullish Continuation | Series of small-bodied consolidation candles within a large bullish candle range, followed by new high. One of the most reliable continuation patterns in candlestick analysis. Signals the market is pausing before the next leg higher | ⭐⭐⭐⭐⭐ |
| Spinning Top | Daily (Mar 5–6) | Pause / Digestion | Market absorbing tariff uncertainty premium. Not a reversal — confirms consolidation rather than distribution. Ideal entry-waiting pattern | ⭐⭐⭐⭐ |
| Bullish Flag | H4 Chart (past 3 days) | Continuation Setup | Consolidation in a tight range after the Jan–Feb breakout rally. Measured move target from pole = ~$6.50/lb | ⭐⭐⭐⭐ |
Global Commodity Macro Overview
Structural Themes for Active TradersCommodity Hierarchy — Structural Outlook Q1–Q2 2026
| Commodity | ST Bias (24H) | MT Bias (1–3M) | Key Driver | Institutional Target | Biggest Risk |
|---|---|---|---|---|---|
| Gold | Cautious | Bullish | Geopolitics, central bank buying, USD softness | J.P. Morgan: $6,300 by end-2026 | NFP beat → USD spike → gold dump |
| WTI Crude | Bullish (Event) | Bearish Structural | Hormuz disruption / Iran war premium | EIA: $58/bbl Brent avg 2026 | Diplomatic ceasefire = $10–$15 instant drop |
| Silver | Bullish | Very Bullish | Gold amplifier + solar/EV industrial demand | $105–$120 bullish scenario | NFP beat, thin liquidity = violent reversal |
| Copper | Bullish | Strong Bull | AI data centre + EV + 1Mt supply deficit | Citi/JPM: $11,000–$14,000/t LME | China PMI miss, tariff escalation |
| Natural Gas (US) | Bearish | Mixed | Post-Winter Storm Fern normalisation | EIA: +11% vs 2025 for full year | Qatar LNG halt re-escalation |
Frequently Asked Questions
Expert Answers for Active Commodity TradersConclusion
Trader Intelligence Summary — March 06, 2026March 6, 2026 is not a normal trading day. It’s the convergence of the week’s most important scheduled macro event — the February NFP release — with the ongoing US–Iran military conflict that has redrawn the energy market landscape in a matter of days. The single most important rule for today: do not initiate major commodity positions before 08:30 ET.
Gold remains the cleanest macro expression of everything that’s happening right now: war, a softening labour market, a fragile dollar, and relentless central bank accumulation. The $5,067–$5,107 zone is where prepared traders will be waiting — not chasing the $5,400 high. J.P. Morgan’s $6,300 year-end target gives this trade a compelling risk-reward that rewards patience over impulse.
WTI Crude is a live-fire trade. The Hormuz premium is real, but so is the diplomatic risk. Trade small, confirm with structure, and always have a rapid exit plan ready. The long-term fundamental picture — a global oil glut pushing Brent toward $58 by year end — is not going away. This week’s spike is an opportunity, not a new trend.
Silver is the highest-velocity expression of the metals bull market, and it cuts both ways. The three-white-soldiers pattern and gap support make the $88–$90 pullback zone compelling. But thin liquidity means a strong NFP could collapse $5–$8 in minutes. Respect the volatility or stay out until post-data clarity.
Copper is simply the best structural trade in the commodity space with no competitors. It doesn’t need Iran, it doesn’t need rate cuts, it doesn’t need anything except the world to keep building AI infrastructure and electric vehicles — which it will, regardless of what today’s payrolls say. The $5.85–$5.95 zone is where long-term conviction and near-term opportunity meet. That’s the entry worth waiting for.
Manage risk above all else. In a week like this, the traders who survive are not the ones who are right — they’re the ones who are still in the game when clarity arrives.
Key Upcoming Events: US CPI (Mar 11) · US GDP Second Estimate (Mar 13) · FOMC Rate Decision (Mar 18)