Crypto Market Daily Report – BTC, ETH, XRP, SOL | April 3, 2026 | Capital Street FX Research Desk
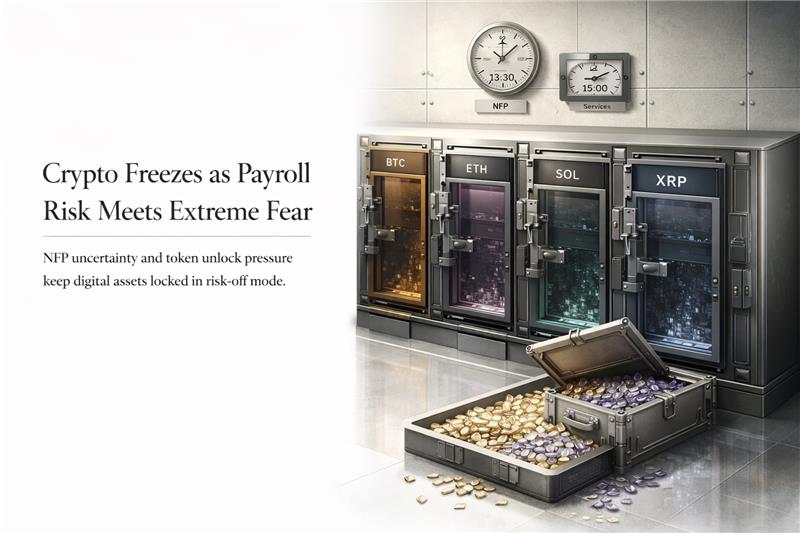
NFP Day Extreme Fear: Crypto Bleeds as Markets Brace for Jobs Shock & Geopolitical Overhang
Full daily crypto market analysis covering BTC/USD, ETH/USD, XRP/USD and SOL/USD — technical structure, Fibonacci positioning, trade setups and economic calendar impact for April 3, 2026.
High-Conviction Crypto Trade Setups — April 3, 2026
What You Need to Know Before You Trade Today
The crypto market is absorbing a rare double-punch on April 3, 2026: the March Non-Farm Payrolls report drops at 13:30 GMT, threatening to lock in hawkish Fed expectations just as geopolitical tensions across the Middle East keep risk appetite depressed.
Crypto Price Snapshot
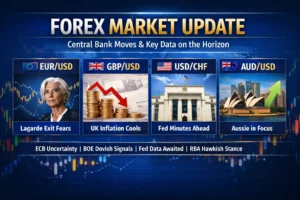
Macro & Fundamental Drivers — April 3, 2026
The single most powerful macro event of the week — the March Non-Farm Payrolls report — arrives today at 13:30 GMT.
The Federal Reserve’s posture remains the dominant central bank theme for crypto in Q2 2026. The March dot plot showed seven members projecting zero rate cuts for the entire year, a dramatic shift from the two-cut consensus of just three months ago.
Persistent Middle East geopolitical risk continues to weigh on the global risk appetite backdrop. Oil prices remain elevated following ongoing tensions around the Strait of Hormuz and Red Sea shipping disruptions, feeding into inflation expectations and keeping the Fed boxed in on the hawkish side.
The Drift Protocol exploit on Solana — with approximately $270 million drained using a legitimate “durable nonce” transaction feature rather than a code bug — is a crypto-native fundamental shock that is particularly punishing SOL and the broader Solana ecosystem today.
The CLARITY Act represents the single most significant regulatory catalyst on the horizon for crypto. April 3 was identified as a target signing date for President Trump, following a bipartisan deal reached on March 20.
The key forward-looking catalyst beyond today’s NFP is the FOMC meeting on April 28–29, representing the next major macro checkpoint. Additionally, the Bitcoin Conference in Las Vegas runs April 27–29 alongside the Fed meeting, and that combination has historically produced market-moving institutional announcements.
BTC/USD · ETH/USD · XRP/USD · SOL/USD — Deep Dive
Bitcoin is navigating the most macro-heavy day of Q1 2026 from a position of structural weakness.
Spot Bitcoin ETF inflows remain a critical demand buffer but have not been sufficient to offset broader macro headwinds. The 11 U.S.-listed spot BTC ETFs registered net outflows in recent sessions as institutional risk management teams cut exposure ahead of NFP day.
Polymarket currently gives a 93% probability of Bitcoin falling below $65,000 in April — a reflection of the crowd wisdom that today’s NFP, if strong, removes any remaining Fed dovish hope and exposes BTC to a fresh leg lower.
On the weekly chart, BTC completed a full Fibonacci retracement from the $98,769 swing high to the $59,764 base. The price is currently trading at approximately the 0.118 level, having rejected the 0.236 Fib at $68,970 multiple times.
On the daily timeframe, BTC is in a clear descending channel confirmed over three months of price action. The channel top currently aligns with the 0.236 Fib resistance at $68,970, while the channel bottom projects to approximately $63,500 over the next two to three weeks.
On the 4H chart, BTC shows a series of failed attempts to reclaim the $68,000 intraday. Each bounce into $67,200–$67,500 has been distributed.

The dominant chart formation on BTC’s daily chart is a well-defined bearish descending channel that has contained price action since mid-January 2026. The channel top currently sits near $68,970–$69,500 (also the 0.236 Fibonacci retracement level), and the channel bottom projects to approximately $63,500 by mid-April.
In the consolidation phase from March 20 to March 28, a cluster of near-doji candles formed between $65,000 and $68,500, indicating indecision and exhaustion of both buyers and sellers.
The Bollinger Band squeeze visible on the 4H chart is a particularly important technical signal for today’s NFP release. Compressed volatility, combined with a strong directional bias (descending channel), typically resolves in the direction of the prevailing trend.
| Level Type | Price | Basis | Significance |
|---|---|---|---|
| Strong Resistance | $90,422 | 0.786 Fibonacci | Major swing high rejection zone from Jan 2026 |
| Resistance Zone | $83,809 | 0.618 Fibonacci | Monthly VWAP ceiling, institutional distribution |
| Resistance Zone | $79,267 | 0.5 Fibonacci | Mid-range equilibrium, last tested early March |
| Immediate Resistance | $74,664 | 0.382 Fibonacci | Short-term recovery ceiling, channel resistance convergence |
| Immediate Resistance | $68,970 | 0.236 Fibonacci / Channel Top | Critical ceiling — 3x rejection since February; key sell zone |
| Current Price | $66,919 | Live Market | Inside channel, below all EMAs, NFP catalyst imminent |
| Immediate Support | $65,000 | Psychological / Round Number | Key psychological barrier, ETF buy program activation zone |
| Key Support | $63,500 | Channel Bottom / Structure | Primary downside target, horizontal support from Dec 2025 |
| Major Support | $59,764 | 0 Fibonacci Base | Macro cycle base — a break here would signal structural bear market |
Ethereum is in a uniquely precarious position on April 3, 2026. Unlike Bitcoin, which benefits from ETF inflows as a directional hedge, ETH faces a compounding of negative fundamental narratives.
The Ethereum ETF product pipeline represents the primary fundamental upside scenario. Multiple forecasters have predicted ETH all-time highs in 2026 conditional on CLARITY Act passage unlocking institutional product approvals.
The DeFi ecosystem on Ethereum faces a headline risk moment following the Drift Protocol exploit on Solana — while Drift is a Solana-based protocol, the market’s risk-off reaction to DeFi smart contract risk is cross-chain, and Ethereum-based DeFi protocols are likely to see elevated redemptions in the near term.
ETH/USD’s Fibonacci retracement from the $3,052 swing high to the $1,735 base presents one of the cleanest bearish structures in the current crypto market. Price is currently trading at $2,062, which is precariously close to the 0.236 Fibonacci retracement level at $2,046.
The weekly chart shows a descending channel that has been intact since January 2026. The channel top has progressively moved from approximately $2,770 (0.786 Fib) in mid-January to approximately $2,200 at present, while the channel bottom tracks toward $1,800.
On the 4H chart, ETH is trading at the precise lower boundary of a consolidation range between $2,037 and $2,095. Today’s NFP data will determine whether this range breaks lower.

ETH/USD’s daily chart is defined by the same descending channel structure as BTC, but with a key difference: ETH is far closer to its next significant Fibonacci support than BTC, making the imminent break below $2,046 a higher-probability and higher-urgency event.
The February bearish engulfing candle — which broke ETH from $2,770 in a single week — is the chart-defining pattern of this cycle.
Confirmation candle for the bearish breakdown: a daily close below $2,030, with the following session opening below $2,046 and not reclaiming it, would validate the pattern. Volume spike on the breakdown candle would add additional confirmation.
| Level Type | Price | Basis | Significance |
|---|---|---|---|
| Strong Resistance | $3,052 | Fibonacci 1.0 (Swing High) | January 2026 peak — structural high of this cycle |
| Resistance Zone | $2,770 | 0.786 Fibonacci | Key rejection zone, post-breakdown ceiling |
| Resistance Zone | $2,549 | 0.618 Fibonacci | Institutional sell zone, monthly pivot resistance |
| Immediate Resistance | $2,394 | 0.5 Fibonacci | Mid-range — failed bounce target mid-March |
| Immediate Resistance | $2,238 | 0.382 Fibonacci | Channel top proximity — multiple rejections in March |
| Current Price | $2,062 | Live Market | Teetering above critical 0.236 Fib — NFP inflection point |
| Key Support | $2,046 | 0.236 Fibonacci | Last major Fibonacci floor before macro base exposed |
| Psychological Support | $1,900 | Round Number / Structure | First bounce candidate after 0.236 Fib break |
| Major Support | $1,735 | 0 Fibonacci Base | Macro cycle low — ultimate downside target in bear case |
XRP is the most regulation-sensitive large-cap crypto and sits at a fundamental crossroads on April 3, 2026.
However, the near-term technical picture overrides the fundamental optionality.
On the negative fundamental side, the Drift Protocol exploit on Solana — while not directly related to XRP — adds fresh DeFi and regulatory headline risk to the broader altcoin complex.
XRP/USD’s Fibonacci retracement from the $2.39 swing high to the $1.12 base shows price currently trading at $1.3182 — very close to the bottom of the established range.
On the daily chart, XRP has been in tight consolidation between $1.28 and $1.40 for approximately six weeks — a range that represents exhaustion rather than accumulation, given that all consolidation is occurring below the 0.236 Fib and below all major EMAs.
The 4H chart shows a series of lower highs within the consolidation zone, suggesting that sellers are increasingly eager to distribute on any intraday bounces.

XRP’s daily chart features one of the clearest descending channel formations in the current crypto market cycle.
Within the consolidation zone from $1.28 to $1.40 (approximately February 10 through present), a series of spinning top and doji candles has formed at the lows.
Confirmation candle for the bearish breakdown would be a daily close below $1.28 (consolidation range low) on above-average volume. This would break the six-week range to the downside and target the $1.12 Fibonacci base. The bearish trigger could be provided by today’s NFP data.
| Level Type | Price | Basis | Significance |
|---|---|---|---|
| Strong Resistance | $2.39 | Fibonacci 1.0 (Jan High) | 2026 cycle high — very distant recovery target |
| Resistance Zone | $1.962 | 0.786 Fibonacci | Post-breakdown ceiling, monthly EMA resistance |
| Resistance Zone | $1.782 | 0.618 Fibonacci | February bounce high — strong institutional sell zone |
| Resistance Zone | $1.656 | 0.5 Fibonacci | Mid-range equilibrium, weekly pivot |
| Immediate Resistance | $1.530 | 0.382 Fibonacci | Channel top convergence zone — key short entry |
| Immediate Resistance | $1.374 | 0.236 Fibonacci / Channel Ceiling | 6-week consolidation ceiling — CLARITY Act catalyst zone |
| Current Price | $1.3182 | Live Market | Bottom of consolidation range, NFP breakout imminent |
| Key Support | $1.28 | Range Low / Structure | Break below triggers acceleration to $1.12 |
| Major Support | $1.1217 | 0 Fibonacci Base | Macro cycle floor — ultimate bear case target |
Solana is the weakest major in the current crypto market on both a technical and fundamental basis.
Solana’s CoinDesk 20 index contribution fell 6.9% in the recent 24-hour period where UNI also declined 7.7%, leading the altcoin index lower.
On a relative value basis, SOL’s market position is under pressure from both Bitcoin (safe-haven flows within crypto) and the broader macro risk-off environment.
SOL/USD’s Fibonacci retracement from the $128.26 swing high (December 2025) to the $66.85 base presents the most extended downtrend among the four instruments covered today.
The weekly chart shows a well-defined descending channel from the January 2026 peak, with the channel top tracking from approximately $128 down through $104 (0.618 Fib), $97 (0.5 Fib), $90 (0.382 Fib), and currently projecting to approximately $85–$86.
On the 4H chart, SOL is in a very tight range between $78 and $82, with the daily ATR suggesting daily moves of approximately $4–$5.

SOL/USD’s most technically alarming feature is that it has already broken below the 0.236 Fibonacci retracement level at $81.34 — the floor that BTC and ETH are still defending. This makes SOL the leading indicator of where the broader crypto market may be heading.
The failed recovery wick visible in late March — where SOL briefly reclaimed $82 intraday but closed back below $81.34 — is a classic bearish retest of broken support.
Confirmation candle for further downside: a daily close below $77 would represent a clear break below the 20-day price range low and activate momentum selling algorithms.
| Level Type | Price | Basis | Significance |
|---|---|---|---|
| Strong Resistance | $128.26 | Fibonacci 1.0 (Dec High) | 2025 cycle peak — extremely distant recovery |
| Resistance Zone | $115.11 | 0.786 Fibonacci | Post-breakdown ceiling, Jan 2026 rejection zone |
| Resistance Zone | $104.79 | 0.618 Fibonacci | Institutional distribution zone |
| Resistance Zone | $97.55 | 0.5 Fibonacci | Mid-range, failed Feb recovery target |
| Immediate Resistance | $90.30 | 0.382 Fibonacci | Channel top in Feb/Mar — multiple distribution zones |
| Broken Support / Resistance | $81.34 | 0.236 Fibonacci (Broken) | Flipped to resistance — confirmed break and retest rejection |
| Current Price | $79.27 | Live Market | Below all Fibonacci levels, $80 psychological battle line |
| Key Support | $73–74 | Structure / Channel Bottom | First downside target after $77 break |
| Major Support | $66.85 | 0 Fibonacci Base | Macro cycle floor — ultimate bear case destination |
How to Capitalise on Today’s Crypto Market with Capital Street FX
NFP day extreme fear — four bearish setups across BTC, ETH, XRP and SOL, with leverage up to 1:10,000 and 0.0 pip spreads to execute with precision.
BTC has rejected the $68,970 level three times and trades in a confirmed descending channel. The NFP release at 13:30 GMT is the catalyst. Capital Street FX gives you up to 1:10,000 leverage to size your BTC short with precision, with 0.0 pip spreads meaning you keep every point of the move.
Trade BTC/USD →ETH/USD is sitting $16 above its last Fibonacci support. A break below $2,046 opens a 15% move to the macro base at $1,735. Capital Street FX’s 900% tradable bonus amplifies your margin for today’s high-conviction ETH short setup, with real-time execution on the ALTX platform.
Trade ETH/USD →Today is binary: CLARITY Act bullish XRP spike vs NFP bearish pressure, and SOL navigating the Drift exploit fallout. If you’re not fully confident in direction, open a free demo account and execute today’s setups paper-first before committing real capital to this extreme fear environment.
Try Free Demo →High & Medium Impact Events — Friday, April 3, 2026
| GMT Time | Currency/Market | Event | Forecast | Previous | Actual | Impact |
|---|---|---|---|---|---|---|
| 07:00 | GBP | UK Construction PMI (Mar) | 52.1 | 51.8 | Pending | MEDIUM |
| 09:00 | EUR | Eurozone Retail Sales (Feb) | +0.3% | +0.5% | Pending | MEDIUM |
| 12:30 | CAD | Canada Employment Change (Mar) | +18K | +25K | Pending | HIGH |
| 13:30 | USD | Non-Farm Payrolls (Mar) | +190K | +197K | Pending | HIGH ⚠️ |
| 13:30 | USD | Unemployment Rate (Mar) | 4.1% | 4.0% | Pending | HIGH |
| 13:30 | USD | Average Hourly Earnings (MoM) | +0.3% | +0.3% | Pending | HIGH |
| 15:00 | USD | ISM Services PMI (Mar) | 53.0 | 53.5 | Pending | MEDIUM |
| All Day | CRYPTO | CLARITY Act signing window (target date) | — | — | Watch | HIGH |
| All Day | CRYPTO | Wormhole (W) token vesting — 1.28B tokens unlock | — | — | Watch | MEDIUM |
Today’s Crypto Market — Frequently Asked Questions
Session Bias Summary & Outlook — Friday, April 3, 2026
Today’s crypto market has confirmed what the charts have been signalling for three months: the macro environment is unambiguously hostile to risk assets, and the crypto market is operating in a risk-off regime with a Fear & Greed Index of 9 — extreme fear.
The structural macro theme for this week and the coming fortnight is “high stakes policy inflection.” Three catalysts that could move the market sharply in either direction are converging within weeks: the CLARITY Act signing (target today), the FOMC meeting on April 28–29 (which may be Jerome Powell’s final meeting before Kevin Warsh succeeds him), and the Bitcoin Conference in Las Vegas running simultaneously with the FOMC.
Today’s remaining key catalysts with specific timing: US NFP at 13:30 GMT (dominant), US ISM Services PMI at 15:00 GMT (secondary), CLARITY Act signing announcement (open-ended, all-day watch), and Wormhole (W) token vesting unlock of 1.28B tokens (ongoing supply pressure on cross-chain bridge tokens).
The 3–5 day bias across all four instruments remains bearish. A strong NFP print today (above +220K) would validate the channel structures and likely push BTC toward $63,500, ETH toward $1,900, XRP toward $1.20, and SOL toward $70–$73 within the next week.