Crypto Market Analysis — BTC, ETH, XRP, SOL | 30 March 2026 | Capital Street FX
Crypto Daily Market Report
30 March 2026
Crypto markets open the final session of Q1 2026 with a modest relief bounce across all four majors — Bitcoin at $67,481, Ethereum at $2,057, XRP at $1.357, and Solana at $83.55 — but the intraday gains arrive against a backdrop that remains structurally bearish. The Federal Reserve holds rates at 3.50–3.75%, Iran continues its Strait of Hormuz blockade, and core PCE sits at 3.1%, well above the 2% target. All four assets remain below critical Fibonacci resistance levels, the Fear & Greed Index registers 23 (Extreme Fear), and the 50-day moving averages across the board point sharply lower. Today’s primary macro focus centres on Trump’s engagement with China on tariff negotiations and the US Q4 GDP third estimate, both of which carry binary implications for risk appetite heading into Q2.
Live Price Snapshot
BTC/USD
ETH/USD
XRP/USD
SOL/USD
Source: TradingView / Capital Street FX (CSFX) live feed | Prices as of 08:00 GMT, 30 March 2026 | Daily % change vs prior close
Fundamental Analysis
The Federal Reserve’s March 18, 2026 decision to hold rates unchanged at 3.50–3.75% marks the second consecutive pause in this cycle, and the policy statement represents the most significant macro anchor for the entire crypto complex entering Q1 close. The FOMC’s language acknowledged that economic activity is expanding at a solid pace, but flagged that the implications of developments in the Middle East — namely the Iran conflict — remain deeply uncertain for the inflation and growth outlook.
Chair Powell’s press conference was characteristically disciplined. He confirmed that the current rate range sits within what the committee considers neutral, but was explicit that neither a cut nor a hike is imminent in the near term. The March dot plot showed seven of nineteen FOMC participants projecting no rate cuts in 2026 at all — a meaningful hawkish shift from December, when that number was six. The median projection still pencils in one 25 basis-point reduction, most likely in December, but CME FedWatch markets are pricing that in at below 50% probability.
Critically for crypto, the Fed revised its 2026 headline and core PCE inflation forecasts upward to 2.7%, from 2.5% and 2.4% respectively in December. The January core PCE print came in at 3.1%, well above the Fed’s trajectory, and February CPI held at 2.4% year-on-year for a second consecutive month. These readings signal persistent services inflation and tariff-driven goods price pressure that prevents Powell from providing any dovish pivot signal — the exact liquidity catalyst the crypto complex needs to sustain a recovery. The prime rate remains at 7.50%, making the opportunity cost of holding non-yielding digital assets the highest since November 2022.
The US-Israel coordinated military strikes on Iran, which began on February 28, 2026, have introduced a structural risk premium across all risk assets that has not yet fully unwound. The death of Ayatollah Khamenei in the initial strikes, confirmed on March 1, triggered $515 million in crypto liquidations within 24 hours and drove the Fear & Greed Index to 14 — a level previously seen only during the 2022 FTX collapse. That initial shock has partially faded, but the conflict’s economic consequences are compounding by the week.
Iran has maintained an effective blockade of the Strait of Hormuz, the waterway responsible for approximately 20% of global oil and gas transit. Over twenty merchant vessels have been struck since the start of the month, and tanker insurance premiums have increased tenfold for Gulf routes. The direct consequence is an oil price that has remained above $80 per barrel throughout March — a level that materially changes the Fed’s inflation calculus. Every $10 increase in Brent crude adds approximately 0.2–0.3 percentage points to headline CPI in the 90-day lag window, meaning the energy shock from the Hormuz blockade will continue feeding into US inflation data through at least June.
For the crypto market specifically, the Iran conflict operates through two channels: the liquidity channel and the risk sentiment channel. Liquidity is compressed because elevated oil prices push inflation expectations higher and reduce the probability of rate cuts, reducing the pool of capital available for speculative assets. Risk sentiment is impaired because the conflict remains unresolved — any escalation, such as a direct Iranian response against US carrier groups, carries binary price risk to the downside. The Polymarket ceasefire probability for a US-Iran agreement by April 30 stands at approximately 78%, which, if realised, would remove a material overhang and provide the most direct near-term catalyst for a crypto recovery.
President Trump’s reimposition of a 15% global tariff under Section 122 of the Trade Act of 1974 in late February 2026 — just days before the Iran strikes — means crypto is navigating two simultaneous macro headwinds rather than one. The tariff overlay is particularly damaging because it operates on a completely different mechanism to the geopolitical risk: where the Iran conflict suppresses sentiment through acute fear, tariffs operate through the slower, structural pathway of elevated goods inflation that entrenches the Fed’s higher-for-longer posture.
The 15% tariff has materially increased US import prices, feeding directly into core goods PCE readings. The February PPI came in at 3.0%, beating expectations, and services PCE remains elevated above 3.5%. The combination prevents the Fed from cutting rates at its April or May meetings and keeps real borrowing costs at restrictive levels well into H2 2026. Bitcoin’s increasing correlation with NASDAQ equities in this cycle — which itself is highly sensitive to rate expectations — means tariff-driven inflation acts as a direct headwind for BTC price appreciation.
The tariff window under Section 122 expires July 24, 2026, creating a 120-day countdown that markets are beginning to price into forward volatility. The key question for crypto is whether Trump negotiates a reduction in tariff rates as part of broader trade deals — today’s engagement with China on trade policy is directly relevant. Any credible de-escalation on the tariff front would immediately revive rate-cut expectations, reduce core PCE forecasts, and provide the liquidity catalyst the crypto market needs. The stablecoin reserve sitting near $316 billion is the dry powder waiting for exactly that signal.
The institutional ETF infrastructure that anchored the crypto market through 2024 and early 2025 has become a two-edged mechanism in the current environment. February 2026 saw $3.8 billion in Bitcoin ETF net outflows — the largest single-month outflow since the products launched — as institutions deleveraged in response to the Iran strikes and tariff reimposition. The significance of March 26, 2026, when Bitcoin, Ethereum, and Solana spot ETFs all registered net outflows simultaneously for the first time this year, cannot be overstated: it confirmed that institutional momentum is still negative.
The structural picture, however, is not uniformly bearish. Strategy Inc. (formerly MicroStrategy) confirmed the purchase of over 17,000 BTC at an average price of approximately $70,946 per coin in March, bringing total holdings to 738,731 BTC. This purchase, made on a week when retail and institutional ETF holders were reducing exposure, illustrates the bifurcation in institutional positioning: treasury allocation buyers with long time horizons are accumulating, while short-to-medium term ETF allocators are reducing risk. Whale wallets have accumulated over 230,000 BTC since December 10, 2025.
For ETH, the structural challenge is more acute. The ETH/BTC ratio sits at multi-year lows, and short seller firm Culper Research disclosed a short position in Ethereum in early 2026, arguing that the Fusaka upgrade weakened ETH tokenomics by collapsing fee revenues and enabling spam transactions. BitMine, a major ETH treasury holder with 4.4 million ETH in holdings, is estimated to be sitting on approximately $7.4 billion in unrealized losses. XRP and Solana ETF products exist but lack the institutional bid volume needed to provide structural price support. The return of consistent ETF inflows across multiple consecutive trading days is the primary institutional sentiment signal to monitor for a trend reversal.
On-chain data for the week ending March 28 paints a picture of a market in compression rather than capitulation. The total crypto market cap stands near $2.3 trillion, down from the January 2026 peak above $3 trillion. Fear & Greed has registered 46 consecutive sessions at Extreme Fear — a streak that, historically, has either preceded capitulation bottoms or prolonged sideways compression, depending on whether macro conditions improve. The current reading of 23 is mildly higher than the cycle low of 5, suggesting incremental sentiment stabilisation.
Solana’s on-chain metrics are the most structurally concerning of the four assets. Network transactions dropped 3.2% in the trailing 30 days, and active addresses fell 11% — a rare correlation of declining price and declining activity. This divergence from previous bear market periods, where on-chain activity held up even as prices fell, indicates genuine demand reduction rather than purely price-driven sentiment. Developer activity remains constructive — Solana ranked second only to Ethereum for new developer inflows in 2025, adding over 11,500 developers — but near-term speculative demand is clearly absent.
Bitcoin’s open interest in futures markets has dropped approximately 19.7% from $61 billion to $49 billion since December 2025, a deleveraging that is historically constructive once complete. Futures funding rates are negative-to-flat on all major exchanges, indicating that shorts are not crowded and the setup for a short squeeze is technically present if macro catalyst arrives. The quarterly $13.5 billion derivatives expiry on March 27 has now passed, removing a significant mechanical downside pressure that had been building since early March. With the Q1 mechanical pressures cleared, the market enters Q2 with a cleaner technical slate — but macro resolution remains the prerequisite for any sustained recovery.
Today’s Key Economic Events
Monday, 30 March 2026 — High and Medium impact events only
| Time (GMT) | Event | Currency | Impact | Crypto Implication |
|---|---|---|---|---|
| 12:30 | US Personal Income (Feb) | USD | High | A beat above consensus signals strong consumer spending capacity, reinforcing the Fed’s higher-for-longer posture and reducing rate-cut probability — bearish for BTC and the crypto complex. |
| 12:30 | US PCE Price Index (Feb) | USD | High | The Fed’s preferred inflation gauge — any print above the 2.8% January reading compresses rate-cut expectations further and directly pressures BTC, ETH, and altcoins via the risk-off liquidity channel. |
| 12:30 | US GDP Q4 2025 (3rd Estimate) | USD | High | A downward revision below 2.3% would raise stagflation concerns given elevated oil prices; a strong reading above 2.5% supports the Fed’s patient stance and sustains risk-off conditions for crypto. |
| 13:45 | Chicago PMI (Mar) | USD | Medium | A reading below 50 (contraction) would add recession risk to the existing stagflation narrative, potentially triggering flight-to-safety flows that weigh on BTC and high-beta altcoins like SOL. |
| 14:00 | US Pending Home Sales (Feb) | USD | Medium | A decline reinforces the narrative that higher mortgage rates are constraining economic activity, potentially nudging the Fed toward a more cautious easing approach that could support crypto risk appetite. |
| All Day | Trump–China Trade Talks (Beijing) | USD / CNH | High | Any reduction in the 15% tariff rate would immediately revive rate-cut expectations, ease core PCE trajectory forecasts, and unlock the $316B stablecoin reserve as a catalyst for a broad crypto recovery. |
Trade the Q1 Close Volatility with Precision — Capital Street FX
BTC at $67,481 below critical $69,172 resistance · PCE and GDP data at 12:30 GMT today · Trump–China tariff talks in progress
Technical Analysis

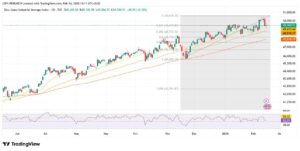
Bitcoin is trading at $67,481 on the daily chart — below every Fibonacci retracement level drawn from the $98,769 swing high to the $60,029 swing low. The 0.236 level at $69,171.89 has acted as overhead resistance for the entire month of March, capping each relief rally attempt and defining the bearish structure. The descending trendline from the January 2026 highs runs approximately parallel to this zone, creating a compressive ceiling. The price has remained confined below this dual resistance for 27 consecutive sessions. Moving average alignment is uniformly bearish: the 5-day SMA sits below the 50-day SMA, and both point lower, consistent with the Strong Sell signal across all 12 moving averages from MA5 to MA200 on the Investing.com daily summary.
The RSI(14) registers 24.33 on the daily — deeply oversold and within a range that has historically preceded either a base-building consolidation phase of several weeks or, when macro conditions deteriorate further, a failure of the final support level. MACD stands at -934.45, well below the signal line, indicating sustained negative momentum with no histogram convergence. The 50-day SMA at approximately $80,037 is itself below the 200-day SMA at $98,434 — a classic death cross configuration that has been in place since early February. The current relief bounce, which opened Monday at $66,609 and has traded to $67,796 intraday, represents a technically driven bounce from deeply oversold conditions rather than a structural reversal. Volume on the bounce is thin, consistent with weekend-to-Monday liquidity patterns.
The critical levels for today’s session are the $69,172 resistance (0.236 Fibonacci) on the upside and the $65,000 psychological level on the downside. A daily close above $69,172 is needed to begin shifting the technical structure from bearish to neutral. Below $65,000, the path opens toward the $60,029 Fibonacci 0.000 level, which represents the absolute range target. With PCE and GDP data releasing at 12:30 GMT today, the next 6 hours are the highest-risk window for the current price structure.
| Indicator | Value | Signal |
|---|---|---|
| Overall Daily Signal | — | Strong Sell |
| MA Alignment (MA5–MA200) | 0 Buy / 12 Sell | Strong Sell |
| RSI (14) | 24.33 | Oversold |
| MACD (12,26) | -934.45 | Sell |
| 5-Day SMA | ~$66,900 | Sell |
| 50-Day SMA | ~$80,037 | Sell |
| Fibonacci Pivot | $69,171.89 | Resistance |
| Fibonacci Level | Price (USD) | Role |
|---|---|---|
| 1.000 (Swing High) | $98,769.33 | Major Resistance |
| 0.786 | $90,478.94 | Resistance |
| 0.618 | $85,970.61 | Resistance |
| 0.500 | $79,399.28 | Resistance |
| 0.382 | $74,827.95 | Resistance |
| 0.236 | $69,171.89 | Key Resistance |
| ▶ Current Price | $67,481.77 | Below all fibs |
| 0.000 (Swing Low) | $60,029.23 | Final Support |

Ethereum at $2,057.08 is trading below the 0.236 Fibonacci retracement level of $2,123.55, drawn from the $3,413.11 swing high to the $1,725.20 swing low. The break below $2,123 in mid-March confirmed the continuation of the dominant downtrend that has been intact since the $3,413 peak in January 2026. ETH has declined approximately 60% from its August 2025 high of $4,953, marking this as the most severe percentage drawdown among the four assets in this session. The chart structure shows a clear pattern of lower highs and lower lows on the daily timeframe, with each recovery attempt failing at the 0.236 level. The descending trendline from January runs through approximately $2,100–$2,150, directly confluent with the 0.236 Fibonacci resistance.
Moving average alignment mirrors BTC’s Strong Sell configuration. All moving averages from 5-day to 200-day point lower, and the ETH/BTC ratio — sitting at multi-year lows — indicates that Ethereum continues to underperform even within the bearish crypto complex. The Fusaka upgrade concerns raised by Culper Research, which highlighted declining fee revenues and the enablement of spam transactions, add a fundamental layer to the technical weakness. RSI on the daily is estimated in the low-20s range, consistent with extreme oversold conditions, while MACD remains well negative with no visible histogram convergence. The previous close at $1,999.12 — below the psychological $2,000 level — was the first below-$2,000 close since mid-2024.
The $2,064.99 intraday high so far today has not been retested at the time of this writing. A close above $2,064.99 followed by a move through $2,123.55 would be the first meaningful technical signal of base formation. Until that occurs, the path of least resistance remains toward the $1,933.92 session low and ultimately the 0.000 swing low at $1,725.20. The ETH stablecoin dynamic is worth monitoring: with $316 billion in stablecoin reserves sitting parked and ETH having lost the $2,000 handle, any macro catalyst that revives risk appetite has the potential to trigger a violent short-covering rally from these deeply oversold conditions.
| Indicator | Value | Signal |
|---|---|---|
| Overall Daily Signal | — | Strong Sell |
| MA Alignment | 0 Buy / 12 Sell | Strong Sell |
| RSI (14) | ~22.0 | Oversold |
| MACD | Negative | Sell |
| 5-Day SMA | ~$2,030 | Sell |
| 50-Day SMA | ~$2,380 | Sell |
| Fibonacci Pivot | $2,123.55 | Resistance |
| Fibonacci Level | Price (USD) | Role |
|---|---|---|
| 1.000 (Swing High) | $3,413.11 | Major Resistance |
| 0.786 | $3,058.48 | Resistance |
| 0.618 | $2,768.33 | Resistance |
| 0.500 | $2,569.16 | Resistance |
| 0.382 | $2,369.98 | Resistance |
| 0.236 | $2,123.55 | Key Resistance |
| ▶ Current Price | $2,057.08 | Below all fibs |
| 0.000 (Swing Low) | $1,725.20 | Final Support |

XRP at $1.3569 occupies the most technically differentiated position of the four assets — it is sandwiched between the 0.236 Fibonacci level at $1.30668 (support) and the 0.382 level at $1.43242 (resistance), with neither boundary having been convincingly broken since early March. The Fibonacci structure on XRP/USD is drawn from the 1.000 swing high at $1.95969 down to the 0.000 level at $1.10342, and critically the chart also displays an extended 1.618 level at $2.47096 — reflecting the broader cycle structure that reached $3.65 in July 2025. The current price, compressed in a 7.5% range for approximately three weeks, represents a coiling structure that will resolve with a measured directional move once a breakout occurs.
The daily signal is Sell rather than Strong Sell, differentiating XRP from BTC, ETH, and SOL. This reflects the relatively tighter compression and the fact that XRP is not below all Fibonacci levels — it maintains a position above the 0.236 support. Moving averages are bearish, but the 5-day SMA is less divergent from current price than on the BTC or ETH charts. RSI is estimated in the 35–40 range — neutral-to-weak, not deeply oversold — which means a breakdown from current levels would not carry the same reversal potential as the ETH and BTC setups. The SEC’s classification of XRP as a digital commodity removes a significant regulatory tail risk, but this structural positive is insufficient to overcome current macro headwinds.
The 0.236 level at $1.30668 has been tested twice in March and held on a daily closing basis, making it the most important short-term level in the XRP structure. A daily close below $1.28 would constitute a decisive breakdown and open a path to $1.20 and ultimately the 0.000 level at $1.10342. To the upside, a close above $1.43242 (0.382 resistance) would be the first higher high on the daily chart since January and would warrant attention as a potential trend change signal. Today’s range so far — from $1.2941 low to $1.3593 high — has covered almost the entire compression zone in a single session, with the intraday high nearly touching the range ceiling.
| Indicator | Value | Signal |
|---|---|---|
| Overall Daily Signal | — | Sell |
| MA Alignment | 2 Buy / 10 Sell | Sell |
| RSI (14) | ~37.0 | Neutral / Weak |
| MACD | Negative | Sell |
| 5-Day SMA | ~$1.335 | Sell |
| 50-Day SMA | ~$1.520 | Sell |
| Fibonacci Pivot | $1.30668 | Support |
| Fibonacci Level | Price (USD) | Role |
|---|---|---|
| 1.618 (Extension) | $2.47096 | Cycle High Zone |
| 1.000 (Swing High) | $1.95969 | Major Resistance |
| 0.786 | $1.78038 | Resistance |
| 0.618 | $1.63569 | Resistance |
| 0.500 | $1.53405 | Resistance |
| 0.382 | $1.43242 | Near Resistance |
| ▶ Current Price | $1.35690 | Between 0.236–0.382 |
| 0.236 | $1.30668 | Near Support |
| 0.000 (Swing Low) | $1.10342 | Final Support |

Solana at $83.55 is trading between the 0.236 Fibonacci level at $80.668 (immediate support) and the 0.382 level at $89.689 (overhead resistance), drawn from the $127.86 swing high to the $66.09 swing low. The 0.236 level at $80.67 was tested during Friday’s session (daily low $78.65), demonstrating that sellers are present below $81 and that the support zone is under active pressure. Today’s bounce from the $78.65 low to $83.76 high represents a 6.5% intraday recovery but remains within the established compression range. The descending trendline from January 2026 runs through approximately $87–89, directly confluent with the 0.382 resistance cluster, making that zone the most important technical ceiling in the near-term structure.
SOL’s on-chain deterioration — active addresses down 11% and transaction count down 3.2% over 30 days — distinguishes this setup from the other three assets where the price weakness is primarily macro-driven. The 50-day SMA is falling steeply, well above current price, confirming the medium-term bearish structure. RSI is estimated in the low-30s on the daily — approaching oversold but not yet at the extreme readings seen on BTC and ETH — while MACD remains negative. Solana ranked second only to Ethereum for developer inflows in 2025, which provides a long-term constructive fundamental, but network utilisation metrics need to stabilise before this translates into price support. The SEC’s prior labelling of SOL as a potential unregistered security, even though partially addressed by the new CFTC/SEC joint framework, remains an institutional allocation constraint that Bitcoin and XRP do not face.
The most important binary for SOL today is whether the $80.67 support level (0.236 Fibonacci) holds on a daily close basis. Friday’s candle tested $78.65 intraday but closed back above $81, which is technically a wick rejection of the support — constructive for the near term. A confirmed daily close below $80.67 shifts the target sequence to $73–75 and ultimately the 0.000 level at $66.09. To the upside, a breakout above the $89.69 level on strong volume would mark the first significant bullish development in the SOL structure since mid-January 2026 and would open the path to $96.98 (0.500 level).
| Indicator | Value | Signal |
|---|---|---|
| Overall Daily Signal | — | Strong Sell |
| MA Alignment | 0 Buy / 12 Sell | Strong Sell |
| RSI (14) | ~31.0 | Near Oversold |
| MACD | Negative | Sell |
| 5-Day SMA | ~$82.10 | Sell |
| 50-Day SMA | ~$97.50 | Sell |
| Fibonacci Pivot | $80.668 | Support / Test |
| Fibonacci Level | Price (USD) | Role |
|---|---|---|
| 1.000 (Swing High) | $127.86 | Major Resistance |
| 0.786 | $114.65 | Resistance |
| 0.618 | $104.27 | Resistance |
| 0.500 | $96.98 | Resistance |
| 0.382 | $89.69 | Key Resistance |
| ▶ Current Price | $83.55 | 0.236–0.382 zone |
| 0.236 | $80.67 | Immediate Support |
| 0.000 (Swing Low) | $66.09 | Final Support |
Session Conclusion
All four assets covered in today’s report — Bitcoin, Ethereum, XRP, and Solana — carry bearish or Sell daily signals as of 30 March 2026, with three of the four (BTC, ETH, SOL) registering Strong Sell alignment across all 12 moving averages on the Investing.com daily summary. The unifying macro thesis is the Federal Reserve’s pause at 3.50–3.75%, the Iran conflict’s structural inflation premium via the Strait of Hormuz blockade, and the 15% global tariff regime that prevents any meaningful softening of core PCE from the current 3.1% print. The Q1 derivatives expiry of $13.5 billion has cleared, removing mechanical pressure, but institutional ETF flows remain negative and the Fear & Greed Index at 23 has sustained the 46th consecutive session of Extreme Fear.
The most technically differentiated setup is XRP, which maintains a range-bound structure between $1.307 and $1.432 rather than the unidirectional downtrend seen on BTC, ETH, and SOL. This reflects XRP’s regulatory tailwind from its commodity classification and its tighter correlation to catalyst-specific events. Bitcoin’s position below all eight Fibonacci levels with an RSI of 24.33 positions it for either a short-squeeze setup if macro catalysts turn positive, or an acceleration lower toward $60,029 if the PCE data disappoints this afternoon. Ethereum’s close below the psychological $2,000 level on Friday’s session is a technically significant development that adds pressure to the $1,725.20 structural floor. Solana’s on-chain deterioration compounds its technical weakness, making it the highest-risk asset on a sustained macro deterioration scenario.
The two binary events that could shift the macro structure this week are: today’s PCE price index at 12:30 GMT and the outcome of Trump’s engagement with China on tariff policy. A soft PCE print (below 2.6%) combined with credible tariff de-escalation language from Beijing represents the scenario where the $316 billion in stablecoin reserves begin to deploy. Absent that combination, the technical structures on all four assets point to further downside, with $65,000 (BTC), $1,870 (ETH), $1.104 (XRP), and $66.09 (SOL) as the primary support targets for Q2 2026. The next scheduled major catalyst after today is the US NFP payrolls release on Friday April 3.