Commodity Market Report — Gold, Silver, Crude Oil & Natural Gas | Capital Street FX Research Desk | April 3, 2026
Hormuz Choke Ignites Oil, But Gold & Silver Buckle Under Liquidity Pressure
Daily commodity market analysis covering Gold (XAU/USD), Silver (XAG/USD), WTI Crude Oil (USOIL), and Natural Gas (NG1!) — full technical levels, trade setups, and Iran war fundamental impact for April 3, 2026.
Today’s Commodity Opportunities — April 3, 2026
What You Need to Know Before You Trade Today
The commodity market complex is running on two completely separate engines as of April 3, 2026.
- WTI CRUDE OIL — Strongest Bullish Trade: Price at $112.05 with Fibonacci 0 target ($119.99) within sight. April 6 deadline is the single biggest binary catalyst of the quarter. Position long on dips toward $108.
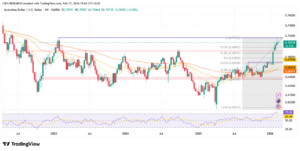
- GOLD — Bearish Despite War: Down 1.72% to $4,676 as central banks sell to fund energy imports. RSI at 38 — approaching oversold but no reversal signal yet. $4,543 (0.618 Fib) is the key downside magnet.
- SILVER — Sharper Pullback: Down 2.70% to $73.013, trading below the 0.618 Fibonacci at $76.60. Industrial demand concerns compound the precious metals unwind. RSI at 40.49 — bearish momentum intact.
- NATURAL GAS — Critical Support Test: NG1! at $2.800 — sitting precisely on the Fib 0 base at $2.780. A daily close below this level opens $2.40 downside. Hormuz LNG disruption is the sole bullish counterweight.
Macro Fundamentals — Commodity Market April 3, 2026
Iran War & Hormuz Crisis — The Dominant Commodity Market Driver of 2026: The US-Israeli military campaign against Iran, which entered its fifth week on April 3, 2026, represents the most significant supply shock to global commodity markets since the 1973 Arab oil embargo.
Federal Reserve Posture — Headwind for Gold & Silver: The Iran war’s oil-driven inflation is materially complicating Fed policy.
Central Bank Gold Selling —
Overcrowded Positioning — The Unwind That Has No Floor Yet: Gold entered the Iran war conflict with near-record speculative long positioning, having gained 23.9% in the 30 days prior to the first US-Israeli strikes on February 28.
Natural Gas —
The Next 24–48 Hour Catalyst — NFP, OPEC+ & the April 6 Deadline: Three events dominate the commodity market outlook for the immediate term.
Gold: Paradox of War — Why the Safe Haven Is Selling Off
Gold’s bearish trajectory during an active military conflict represents one of the most counterintuitive market dynamics of the decade. The metal peaked near $5,500 in late January/early February 2026 — gaining 23.9% in the 30 days before the US-Israeli strikes on Iran began.
Goldman Sachs and J.P. Morgan both maintain constructive medium-term views — Goldman targets $5,400 by year-end, J.P. Morgan projects $6,300 — citing central bank reserve diversification and eventual Fed rate cuts (50bps expected in 2026).
The forward-looking fundamental pivot point for gold is the Iran ceasefire scenario. A confirmed diplomatic breakthrough removes the oil-inflation headwind and reopens the window for Fed rate cuts — both of which are bullish for gold’s medium-term trajectory.
Multi-Timeframe Technical: Bearish Breakdown Below 0.5 Fib
On the daily chart, gold has broken decisively below the 0.5 Fibonacci retracement at $4,743.391 — drawn from the $3,892 swing low to the $5,594 all-time high reached in early 2026.
The RSI on the daily chart stands at 38.17 (signal 45.82) — in bearish territory but not yet oversold by classic RSI definition (<30). The RSI signal line crossover to the downside confirms that selling pressure is accelerating.
On the weekly chart, gold remains structurally bullish given its 36-month consecutive year-on-year price gain streak. The current decline is a corrective wave within a broader uptrend rather than a structural reversal — consistent with medium-term bullish targets from institutional research.

The most significant candlestick pattern on the gold daily chart is a Bearish Engulfing formation that completed around the $4,800–$4,900 zone, signalling a dominant shift in seller control following the February peak.
The broader chart structure since the February 2026 high reveals a clean Descending Channel — price consistently printing lower highs and lower lows within a well-defined downward slope.
Confirmation for the bearish continuation trade requires a failure to reclaim $4,743 (0.5 Fib) on any bounce attempt. If today’s NFP data drives a temporary gold bounce, traders should watch for a rejection at $4,743–$4,780 (the immediate resistance zone) before re-entering short positions targeting $4,542.
| Level Type | Price | Basis | Significance |
|---|---|---|---|
| Strong Resistance | $5,192.808 | Fib 0.236 | First major retracement level — far above current price |
| Resistance Zone | $4,944.266 | Fib 0.382 | Prior bounce failure zone — strong seller interest |
| Immediate Resistance | $4,743.391 | Fib 0.5 / Structure | Critical level — failure here confirms bearish continuation |
| Resistance | $4,781.545 | EMA 50 (est.) | Declining 50 EMA acting as dynamic resistance |
| Current Price | $4,676.860 | Live Price | Below 0.5 Fib — bearish territory confirmed |
| Immediate Support | $4,632.683 | EMA 20 / Structure | Short-term moving average support |
| Key Support | $4,542.515 | Fib 0.618 (Golden Ratio) | Most significant support — high-probability bounce zone |
| Major Support | $4,252.12 | Fib 0.786 | Secondary support if 0.618 fails |
| Deep Support | $3,892.221 | Fib 1.0 (Swing Low) | Full retracement base — structural long-term support |
| Target (Upside) | $5,594.560 | Fib 0 (ATH) | All-time high — medium-term institutional bullish target |
Gold’s confirmed break below the 0.5 Fibonacci level ($4,743) establishes this level as the key sell zone for any intraday bounce triggered by weaker NFP data.
Silver: Caught Between Collapsed Industrial Demand & Safe-Haven Unwind
Silver’s 2.70% decline on April 3 continues a brutal March correction that saw the metal briefly trade below $65 before recovering to current levels near $73.
Silver’s relationship to gold (the Gold/Silver ratio) has been deteriorating sharply throughout Q1 2026, with silver consistently underperforming during both rallies and corrections.
Medium-term bullish fundamentals remain intact: the global energy transition continues to require enormous quantities of silver for photovoltaic cells, EVs, and grid infrastructure. But near-term, the war premium has paradoxically become a bearish catalyst for silver, as growth fears override the energy transition demand story.
Silver Technical: Below 0.618 Fib — Next Magnet at 0.786 ($64.29)
Silver’s daily chart shows a dramatic correction from the $121.86 all-time high (Fibonacci 0 level), drawn from the $48.62 swing low.
Current price of $73.013 sits between the broken 0.618 ($76.60) — now resistance — and the 0.786 Fibonacci support at $64.29. The RSI at 40.49 (signal at 44.27) confirms bearish momentum, with the RSI signal crossover to the downside indicating sellers remain in control.
On the 4H chart, silver has been printing a series of bearish continuation patterns — lower highs on each recovery attempt, with selling volume consistently outpacing buying volume at each resistance test.

Silver’s most significant chart formation is the confirmed breakdown below the 0.618 Fibonacci Golden Ratio at $76.60 — the level at which the chart shows a distinct pink dotted horizontal line marking the structural support boundary.
The broader pattern from the $121.86 peak resembles a Descending Triangle — a series of lower highs meeting a periodically tested horizontal support level (initially around $76.60, now broken). The descending upper trendline connects each recovery peak, forming the triangle’s hypotenuse.
Confirmation of the bearish continuation trade requires a failure to reclaim $76.60 on today’s potential NFP-driven bounce. If silver manages a daily close above $76.60, the bearish pattern is invalidated and the trade should be exited.
| Level Type | Price | Basis | Significance |
|---|---|---|---|
| Strong Resistance | $104.578 | Fib 0.236 | Far upside — structural recovery target in bull case |
| Resistance Zone | $93.884 | Fib 0.382 | Intermediate resistance — key recovery level |
| Resistance | $85.241 | Fib 0.5 | Mid retracement — significant structural resistance |
| Immediate Resistance | $76.597 | Fib 0.618 / Broken Support | CRITICAL — broken golden ratio, now resistance |
| Current Price | $73.013 | Live Price | Between 0.618 and 0.786 — bearish no-man’s-land |
| Immediate Support | $70.00 | Psychological / Structure | Round number + March consolidation base |
| Key Support | $64.292 | Fib 0.786 | Next major Fibonacci support — primary downside target |
| Major Support | $48.617 | Fib 1.0 (Swing Low) | Full retracement — extreme support / structural low |
| Target (Downside) | $64.292 | Fib 0.786 Measured | Primary 24–72H downside target on continuation |
| Psychological Level | $80.000 | Round Number | Key round number resistance on any recovery |
Silver’s confirmed break below the 0.618 Golden Ratio Fibonacci at $76.60 is the most significant technical event of the session. The setup involves selling any intraday recovery into the $73.50–$76.00 zone — ideally $76.00 — as the broken support level now acts as resistance.
WTI Crude Oil: Largest Supply Shock in History — April 6 Deadline Looms
WTI Crude Oil’s 13.30% surge on April 3 — taking price to $112.05 — reflects the most acute phase of the Iran war oil market repricing.
The supply mathematics are stark: 10–17.8 million barrels per day of global supply have been disrupted — the largest supply shock in modern energy market history.
The April 6 deadline is a pure binary event: ceasefire materialises (oil drops $14–18/bbl immediately per Goldman Sachs) or deadline is missed (oil breaks toward $120–$135 zone).
WTI Technical: Explosive Breakout — Fibonacci 0 at $119.99 in Sight
WTI Crude Oil’s daily chart shows one of the most explosive trending moves in recent commodity market history.
The RSI at 66.18 (signal at 70.11) is approaching but has not yet reached overbought territory (70). This is a classic “momentum trend” RSI setup — where RSI hovers in the 60–80 zone for extended periods during strong trending moves, without triggering a meaningful reversal.
On the daily chart, the ascending channel from the February lows remains intact. The channel’s upper boundary is approaching $115–$120 — coinciding with the Fibonacci 0 level at $119.99.

WTI’s most significant candlestick formation today is a Strong Bullish Momentum Candle — a large-body green candle covering more than $15 from open ($98.92) to high ($113.97), closing near the day’s high at $112.05.
The broader chart structure is a textbook Parabolic Uptrend Channel — the type of formation that appears in once-in-a-decade supply shock scenarios.
Trade confirmation: the bullish setup is confirmed on any retest of $108–$110 that holds as support. The RSI approaching 70 from below suggests the trend is strong but momentum traders should be aware of a potential consolidation period before the next leg toward $119.99.
| Level Type | Price | Basis | Significance |
|---|---|---|---|
| Target / Strong Resistance | $119.990 | Fib 0 (Swing High) | Primary upside target — breakout would project $135–$157 |
| Psychological Resistance | $115.000 | Round Number / Range High | Intraday ceiling on today’s session high near $113.97 |
| Current Price | $112.050 | Live Price | Above 0.236 Fib — strongly bullish territory |
| Immediate Support | $108.500 | Structure / Round Number | Buy-the-dip zone — intraday pullback support |
| Key Support | $104.700 | Fib 0.236 | Breakout level — now major support on retest |
| Support Zone | $95.490 | Fib 0.382 / EMA 20 | Key pullback support — ceasefire sell-off magnet |
| Major Support | $87.610 | Fib 0.5 | Mid-structure support — significant on major reversal |
| Deep Support | $79.970 | Fib 0.618 | Golden ratio support — long-term structural floor |
| Psychological Level | $100.000 | Round Number | First settle above $100 since July 2022 — major level |
| Structural Low | $55.240 | Fib 1.0 (Swing Low) | Full retracement — absolute structural support |
This is the highest-conviction commodity trade of April 3, 2026.
Natural Gas: Depressed by Mild Winter, But LNG Disruption Tailwind Building
Natural Gas (NG1!) finds itself in a paradoxical fundamental situation: despite the most significant LNG supply disruption in history unfolding globally due to the Hormuz closure, US domestic Henry Hub prices remain near multi-year lows at $2.800.
However, the medium-term fundamental picture is turning. Shell CEO Wael Sawan’s April 2026 statement that Hormuz disruptions have “spread from South Asia to Southeast Asia, Northeast Asia and then more so into Europe as we get into April” is the key signal.
On the demand side, the broader macro backdrop is mixed for gas: higher energy prices from the Iran war paradoxically reduce industrial gas consumption (demand destruction), while also triggering coal-to-gas switching and increasing residential heating demand as households manage electricity costs.
NG1! Technical: Critical Base Test — Fib 0 at $2.780 Must Hold
Natural Gas’s daily chart tells the story of a market at an inflection point. The Fibonacci retracement is drawn from the $2.780 swing low (Fib 0) to the $7.499 high (Fib 1.0) — a range that captured the spectacular winter 2025/26 spike and subsequent collapse.
The RSI at 39.60 (signal at 44.26) is approaching oversold territory — not yet at 30, but the trajectory is downward.
The setup is a classic “test of the base” entry — the risk/reward for a long position at $2.80–$2.82 is highly favorable given the well-defined stop below $2.78 ($0.14 risk) and the potential recovery toward $3.15 (EMA 20 / first resistance, $0.33 reward).

Natural Gas’s most important candlestick signal today is the presence of a Long Lower Wick on the daily candle — the intraday low reached $2.779 (touching the Fib 0 base at $2.780) before recovering to close at $2.800.
The broader chart pattern from the $7.499 high is a Bear Descending Channel — price has been making progressively lower highs within a defined downward-sloping channel since the February spike.
The confirmation signal for the long trade is a daily close above $3.00 — the key psychological and technical threshold.
| Level Type | Price | Basis | Significance |
|---|---|---|---|
| Strong Resistance | $7.499 | Fib 1.0 (Spike High) | All-time spike high — distant upside target |
| Resistance Zone | $6.489 | Fib 0.786 | Major retracement resistance |
| Resistance | $5.696 | Fib 0.618 | Golden ratio resistance on recovery |
| Resistance | $3.771 | EMA 200 | 200-day moving average — major dynamic resistance |
| Immediate Resistance | $3.357 | EMA 50 | 50-day EMA — first meaningful resistance level |
| Resistance | $3.024 | EMA 20 | 20-day EMA — immediate recovery target |
| Psychological Resistance | $3.000 | Round Number | Confirmation level — close above = bullish signal |
| Current Price | $2.800 | Live Price | Just above Fib 0 base — critical inflection zone |
| KEY SUPPORT | $2.780 | Fib 0.0 (Base) / Pink Line | MOST CRITICAL — full retracement level, must hold |
| Deep Support | $2.400–$2.600 | Pre-Spike Structure | Below Fib 0 — extreme downside if base fails |
This is a moderate-conviction speculative long at a major technical confluence — the Fib 0 base ($2.780) where a long lower wick on today’s candle confirms intraday buying support.
How to Capitalise on Today’s Commodity Market with Capital Street FX
Oil is surging 13%, Gold is testing critical Fibonacci support, and the April 6 Hormuz deadline creates the biggest binary commodity trade of 2026 — here’s how to position with CSFX.
WTI is up 13.3% with the April 6 Hormuz deadline creating the most binary oil trade of the year. Access USOIL with 0.0 pip spreads and up to 1:10,000 leverage — size conservatively given OVX above 55. Buy dips toward $108.50 with a $119.99 target.
→ Trade USOIL NowGold is testing $4,542 (0.618 Fib) and Silver is below its golden ratio support — the short setups are clear, but oversold conditions demand precision timing. Use CSFX’s real-time RSI and Fibonacci overlays on the ALTX platform to nail your entry on NFP-driven bounces.
→ Trade MetalsThe April 6 Hormuz binary event is unlike any commodity catalyst in recent years. Practice the exact trade setups in this report — USOIL long, Gold short, Silver short, Natural Gas base long — on the CSFX free demo before committing live capital to such high-volatility conditions.
→ Open Free DemoWith OVX above 55 and oil swinging $5+ intraday, even a 0.5 pip spread difference matters enormously. Zero spread execution is non-negotiable today.
NFP at 08:30 ET and the April 6 deadline create violent price gaps. CSFX’s guaranteed execution ensures your stop losses fire at the exact price — not $5 worse.
Today’s USOIL long and Gold short both require meaningful margin. The 900% tradable bonus amplifies your available margin for all four commodity setups simultaneously.
Today’s Fibonacci confluence trades (Gold 0.618, Silver 0.618, Oil 0.236) are best executed using ALTX’s multi-level Fibonacci drawing tool with auto-alert zones.
The April 6 Hormuz deadline falls on a Sunday — when most desks are closed. CSFX’s 24/7 support ensures you can manage positions through the binary event safely.
A ceasefire announcement could trigger a $14–18/bbl oil crash in minutes. Negative balance protection ensures you never owe more than your deposit — critical for today’s energy trades.
Today’s High-Impact Events — April 3, 2026
| GMT Time | Market | Event | Forecast | Previous | Actual | Impact |
|---|---|---|---|---|---|---|
| 12:30 GMT | 🇺🇸 USD | Non-Farm Payrolls (March 2026) | +185K | +151K | Pending | HIGH |
| 12:30 GMT | 🇺🇸 USD | Unemployment Rate (March 2026) | 4.2% | 4.1% | Pending | HIGH |
| 12:30 GMT | 🇺🇸 USD | Average Hourly Earnings (YoY) | +4.0% | +4.0% | Pending | HIGH |
| 14:00 GMT | 🇺🇸 USD | ISM Services PMI (March 2026) | 52.8 | 53.5 | Pending | HIGH |
| 14:00 GMT | 🇺🇸 USD | Factory Orders (February) | +0.5% | +1.7% | Pending | MED |
| All Day | 🌍 Global | US–Iran Hormuz Crisis Updates | — | — | Live | CRITICAL |
| Apr 5 | 🌍 OPEC+ | OPEC+ Meeting — Production Decision | +206K b/d? | +206K b/d | Pending | HIGH |
| Apr 6 | 🌍 Global | Trump Hormuz Deadline / Iran Ultimatum | — | — | Pending | CRITICAL |
| Apr 7 | 🌍 Global | EIA Short-Term Energy Outlook (Next) | — | $3.80 NG avg | Pending | MED |
| Apr 23 | 🇺🇸 USD | Intel Q1 2026 Earnings (Cross-Market) | — | EPS est. | Pending | MED |
Today’s Commodity Market — Trader FAQ
Session Bias Summary & Outlook — April 3, 2026
April 3, 2026 has confirmed the most dramatic split in the commodity market complex in recent memory.
The structural macro theme for the week is unambiguous: this is a supply-shock commodity market driven by geopolitical binary risk. The conventional commodity diversification playbook — long gold, long oil as an inflation hedge — has been broken.
Today’s remaining key catalysts: US Non-Farm Payrolls at 12:30 GMT — the data release most likely to cause a temporary reversal in Gold and Silver from deeply oversold RSI levels; ISM Services PMI at 14:00 GMT — a below-50 reading would amplify recession concerns and add downward pressure on Silver’s industrial demand outlook.
Looking 3–5 days ahead: WTI’s primary scenario remains bullish toward $119.99 (Fibonacci 0) as long as Hormuz remains closed and the April 6 deadline passes without agreement — probability 70% per Polymarket. Gold’s medium-term case remains intact —