Daily Crypto Analysis
Introduction
Cryptocurrency markets remain range-bound as investors navigate thin holiday liquidity, persistent macro headwinds, and key technical inflection points. Bitcoin steadies near $68K, while Ethereum, XRP, and Dogecoin consolidate around critical support and resistance levels, leaving traders alert for potential breakout or breakdown scenarios.
Markets In Focus Today – BITCOIN
Bitcoin price today: Holds steady near $68K amid holiday-thinned trading conditions.
Bitcoin traded sideways on Tuesday, as reduced activity across several major markets due to holidays left investors with limited fresh catalysts. Last week, the world’s largest cryptocurrency nearly slipped below the $60,000 mark, extending a broader multi-month downturn across the digital asset space. Since reaching its record peak in October, Bitcoin has shed nearly 50% of its value amid persistent macroeconomic and sector-specific pressures. Heightened risk aversion has also weighed on sentiment, with investors favoring traditional safe-haven assets such as gold and other precious metals over cryptocurrencies. Additionally, volatility in U.S. technology stocks — which often show strong correlation with crypto markets — has further pressured the sector. While broader cryptocurrencies posted modest gains on Tuesday, recouping a fraction of recent losses, the market continues to grapple with significant declines seen in recent weeks.
Technical Overview With Chart :
Moving Averages :
Exponential :
- MA 10 : 69440.6617 | Negative Crossover | Bearish
- MA 20 : 72776.3639 | Negative Crossover | Bearish
- MA 50 : 80176.8223 | Negative Crossover | Bearish
Simple :
- MA 10 : 68696.6230 | Negative Crossover | Bearish
- MA 20 : 72064.0690 | Negative Crossover | Bearish
- MA 50 : 83504.4088 | Negative Crossover | Bearish
RSI (Relative Strength Index) : 35.5156 | Sell Zone | Bearish
Stochastic Oscillator : 47.0573 | Neutral Zone | Neutral
Resistance And Support Levels :
- R1 : 92551.7407 R2 : 97796.1327
- S1 : 75574.1327 S2 : 70329.7407
Overall Sentiment : Bearish Market Direction : Sell
Trade Suggestion : Limit Sell : 69759 | Take Profit : 67077 | Stop Loss : 71540
ETHEREUM
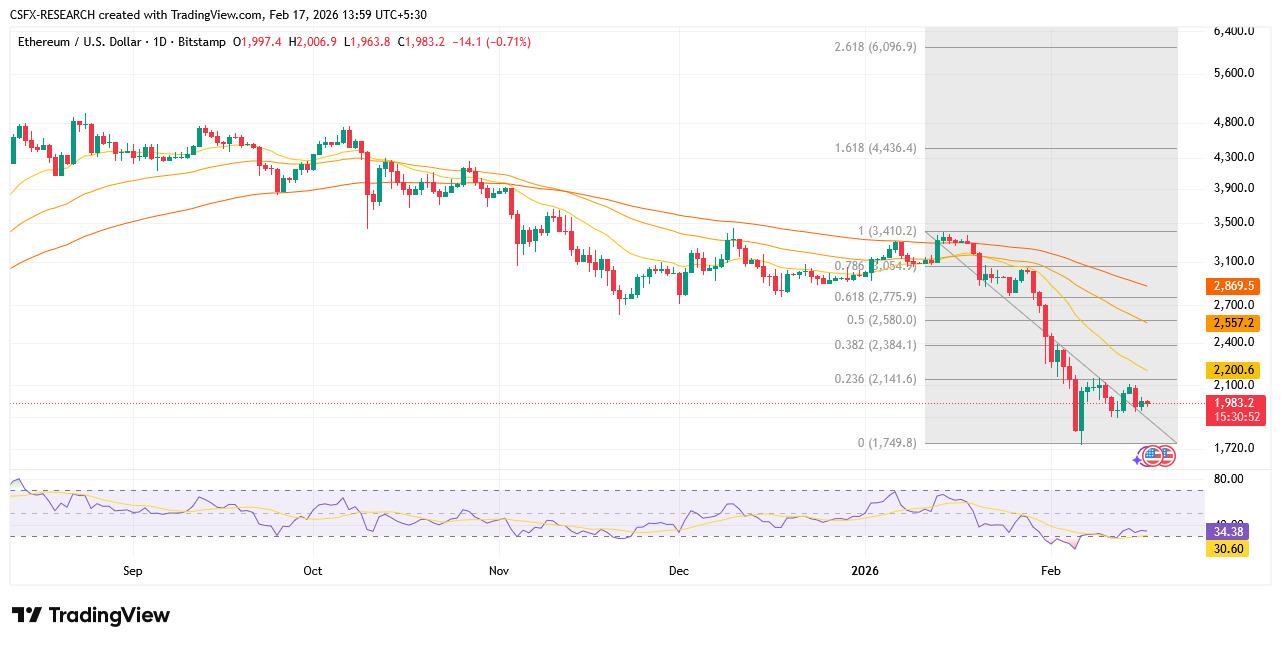
Ethereum price approaches a key technical inflection point, with a significant breakout move potentially on the horizon.
Ethereum found buying interest around the $1,928 level, triggering a modest rebound from recent losses. However, the recovery remains fragile as price action consolidates below key resistance near $2,020. After failing to sustain momentum above the $2,000 mark, ETH followed Bitcoin lower, slipping beneath the $1,950 and $1,940 levels and entering bearish territory. Support eventually emerged near $1,925, where a short-term bottom was established at $1,928, sparking a recovery attempt. At present, Ethereum is trading under both the $2,020 level and the 100-hour Simple Moving Average, signaling continued near-term pressure. Immediate resistance is seen around $2,035, followed by a stronger barrier near $2,060. Should ETH fail to break decisively above $2,020, another downward move could unfold. On the downside, initial support is located near $1,970, while stronger support lies around the $1,940 region, aligned with a key trend line.
Technical Overview With Chart :
Moving Averages :
Exponential :
- MA 10 : 2043.7242 | Negative Crossover | Bearish
- MA 20 : 2201.5481 | Negative Crossover | Bearish
- MA 50 : 2558.0396 | Negative Crossover | Bearish
Simple :
- MA 10 : 2018.8930 | Negative Crossover | Bearish
- MA 20 : 2156.3915 | Negative Crossover | Bearish
- MA 50 : 2724.7952 | Negative Crossover | Bearish
RSI (Relative Strength Index) : 34.3366 | Neutral Zone | Neutral
Stochastic Oscillator : 38.6831 | Neutral Zone | Neutral
Resistance And Support Levels :
- R1 : 3137.1060 R2 : 3408.4706
- S1 : 2258.6206 S2 : 1987.2560
Overall Sentiment : Bearish Market Direction : Sell
Trade Suggestion : Limit Sell : 2034.8 | Take Profit : 1887.4 | Stop Loss : 2131.0
RIPPLE
XRP price consolidates within a narrowing range as traders await a decisive breakout or potential breakdown.
XRP extended its downward move, slipping below the $1.520 level before attempting to stabilize. The token is now consolidating its recent losses but continues to face immediate resistance around the $1.5150–$1.520 zone. After failing to hold above $1.60, XRP followed the broader weakness seen in Bitcoin and Ethereum, breaking beneath $1.550 and $1.520 to enter a short-term bearish phase. Selling pressure intensified, pushing the price below $1.50 and establishing a swing low at $1.4437. Currently, XRP is trading above $1.450 and the 100-hour Simple Moving Average, signaling early signs of stabilization. On the upside, resistance is seen near $1.5840, with a decisive break potentially opening the door toward $1.620 and even $1.650. However, if the price fails to overcome the $1.520 barrier, renewed downside pressure could emerge. Initial support lies near $1.460 or the ascending trend line, followed by stronger support around the $1.440 area.
Technical Overview With Chart :
Moving Averages :
Exponential :
- MA 10 : 1.4648 | Positive Crossover | Bullish
- MA 20 : 1.5319 | Negative Crossover | Bearish
- MA 50 : 1.7228 | Negative Crossover | Bearish
Simple :
- MA 10 : 1.4351 | Positive Crossover | Bullish
- MA 20 : 1.4968 | Negative Crossover | Bearish
- MA 50 : 1.8105 | Negative Crossover | Bearish
RSI (Relative Strength Index) : 41.8902 | Neutral Zone | Neutral
Stochastic Oscillator : 64.9014 | Buy Zone | Neutral
Resistance And Support Levels :
- R1 : 2.2032 R2 : 2.4187
- S1 : 1.5057 S2 : 1.2902
Overall Sentiment : Bearish Market Direction : Sell
Trade Suggestion : Limit Sell : 1.54 | Take Profit : 1.33 | Stop Loss : 1.67
DOGECOIN
Dogecoin (DOGE) Retreats From Recent Gains as Key Support Level Comes Into Focus.
Dogecoin trimmed a portion of its recent gains, slipping below the $0.1080 mark against the US Dollar. While DOGE continues to hold above the key $0.10 support level, the risk of additional downside remains. The pullback began after the price failed to break through the $0.1175 resistance, diverging from the relative strength seen in Bitcoin and Ethereum. Selling pressure pushed DOGE beneath the $0.1120 and $0.1080 levels, signaling a short-term correction. At present, Dogecoin is trading above the $0.10 threshold and the 100-hour simple moving average. On the upside, immediate resistance is located near $0.1035, followed by stronger barriers at $0.1065 and $0.1085. A decisive close above $0.1085 could pave the way toward $0.1120, with further gains potentially targeting $0.1150 and eventually $0.1175. However, if DOGE fails to reclaim $0.1060, bearish momentum may persist. Initial support lies at $0.10 along the trend line, while a deeper pullback could test the $0.0950 level.
Technical Overview With Chart :
Moving Averages :
Exponential :
- MA 10 : 0.1003 | Negative Crossover | Bearish
- MA 20 : 0.1039 | Negative Crossover | Bearish
- MA 50 : 0.1166 | Negative Crossover | Bearish
Simple :
- MA 10 : 0.0980 | Positive Crossover | Bullish
- MA 20 : 0.1012 | Negative Crossover | Bearish
- MA 50 : 0.1211 | Negative Crossover | Bearish
RSI (Relative Strength Index) : 43.3084 | Neutral Zone | Neutral
Stochastic Oscillator : 56.3931 | Buy Zone | Neutral
Resistance And Support Levels :
- R1 : 0.1420 R2 : 0.1566
- S1 : 0.0950 S2 : 0.0804
Overall Sentiment : Bearish Market Direction : Sell
Trade Suggestion : Limit Sell : 0.109 | Take Profit : 0.091 | Stop Loss : 0.123
Elsewhere In The Crypto Market
Bitcoin down (0.87%) at 68248, Ethereum down (0.64%) at 1984.12, Litecoin up (0.14%) at 55.68, Solana up (0.05%) at 86.43, Dogecoin down (1.19) at 0.09.
Key Economic Events & Data Release Today:
(EUR) German CPI (MoM) (Jan) Forecast 0.1%, Previous 0.0% at 12:30.