Crypto Market Report — BTC/USD, ETH/USD, DOGE/USD, SOL/USD | Capital Street FX Research Desk · April 2, 2026
Crypto Market Report: BTC Near $66K, ETH at $2,028 — Iran Tensions & US Tariff Announcements In Focus | April 2, 2026
Full daily analysis covering Asian, European, and US sessions — BTC/USD · ETH/USD · SOL/USD · DOGE/USD · April 2, 2026
What You Need to Know Before You Trade Today
The crypto market is navigating a macro-heavy session today: new US tariff announcements are being processed across global risk assets, while renewed Iran geopolitical rhetoric has pushed oil prices higher and increased cross-market volatility. Bitcoin is down nearly 3%, Ethereum over 5%, with altcoins also seeing notable intraday moves. All four instruments — BTC, ETH, SOL, DOGE — are currently trading near or below key Fibonacci reference levels and within established descending channel structures from the October 2025 highs at $126,000. Price action at these levels will determine whether support holds or further downside unfolds.
- BTC/USD $66,263 — Down −2.82%; trapped beneath 0.236 Fib at $69,171 in descending channel, next major support is $60,029.
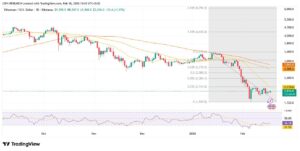
- ETH/USD $2,028 — Heaviest daily loss at −5.23%; teetering above 0.236 Fib support at $2,058, a break opens $1,750.
- SOL/USD $78.13 — −4.80%; Fibonacci base at $66.09 now visible as the next critical downside target.
- DOGE/USD $0.0887 — −3.17%; below all Fibonacci levels, descending channel lower boundary at $0.0787 coming into play.
Asian trading hours saw notable market activity as new US tariff announcements began filtering through overnight markets. Bitcoin opened near $68,186 and traded lower through the Tokyo and Hong Kong overlap, moving broadly in line with Nikkei futures — reflecting the established correlation between crypto and broader risk assets.
Ethereum opened at $2,139 and declined to test the $2,100 psychological level during Asian hours, with comparatively lighter buy-side volume than prior sessions. Solana initially held in the $80–$82 range before drifting lower toward $77.81 as the session progressed. Altcoin moves were broadly proportional to Bitcoin’s intraday range.
Dogecoin opened at $0.09200 and drifted lower through the session. As a higher-beta asset relative to Bitcoin, DOGE moved in amplified percentage terms. Oil prices ticked higher on Iran geopolitical news, contributing to a more cautious macro environment across Asian markets.
Key data point to watch from the session: derivatives funding rates shifted across perpetual contracts for all four instruments during Asian hours, reflecting repositioning activity ahead of the upcoming US macro events. Both long and short setups remain in play depending on how price reacts at key Fibonacci levels.
The European session saw continued price movement across all four instruments, with Bitcoin testing the $66,180 intraday low during the London open. European equities opened with a cautious tone, and crypto pairs moved in tandem with broader market sentiment as traders processed ongoing Iran rhetoric and the US tariff situation.
ETH/USD tested the $2,058 level — the 0.236 Fibonacci retracement — during the European session. This level had acted as dynamic support since mid-March and remains a key reference point for both bulls and bears. A sustained daily close below $2,058 would open the technical path toward $1,750, while a reclaim of this level would bring $2,248 (0.382 Fib) back into focus.
Solana traded in a range between the $80.76 Fibonacci level (0.236) and the $77.81 intraday low during European hours. The $80.76 level saw two tests without a clean breakout, making it the key pivot to monitor during the US session. A hold and reclaim of $80.76 reopens upside potential; a sustained break below the session low exposes $70.00.
Dogecoin showed limited directional conviction during European hours, trading close to session lows. With DOGE having a high beta relative to BTC, any meaningful move in Bitcoin during the US session will be amplified in DOGE. Both the $0.09013 resistance level and the $0.07868 Fibonacci base remain relevant levels to watch.
The US session is the primary trading window of the day, with tariff implementation specifics being processed by markets in real time. Bitcoin is currently near $66,263, with the $66,000 psychological level the immediate reference point. A daily close below $66,000 would shift the technical picture toward the February lows at $63,000, while a reclaim above $68,000 would ease near-term downside pressure.
ADP Employment data at 13:15 GMT and ISM Services PMI at 15:00 GMT are the primary macro catalysts during the US session. A PMI miss below 50 (contraction) would add to macro concerns, while a strong beat above 55 could prompt a relief move across risk assets including crypto. Traders should be positioned ahead of these releases.
Ethereum’s US session price action will be watched closely around the $2,058 Fibonacci level. A confirmed hold above this level could open a move back toward $2,162 (today’s high); a clean break lower targets the $1,900 area. Derivatives open interest data shows active positioning on both sides of the $2,000 strike.
Watch for volatility spikes around any Iran-related headlines or tariff response announcements from China, the EU, or Asian economies. These events have historically produced sharp intraday moves across crypto. Tomorrow’s NFP at 12:30 GMT also adds positioning considerations for traders holding into the close.
US Tariff Announcement — Key Macro Driver
Today, April 2, 2026, marks what the White House has branded “new round of sweeping set of new import tariffs impacting multiple global trading partners simultaneously. The announcement follows a pattern well-established over the past year: each major tariff escalation has corresponded to a sharp, often leveraged-driven selloff in Bitcoin and the broader crypto market. The tariff shock tightens financial conditions, postpones Federal Reserve rate cut expectations, and simultaneously pushes investors toward hard assets like gold and safe-haven currencies, at the expense of speculative risk assets including cryptocurrencies. All four crypto instruments covered in this report — BTC, ETH, SOL, and DOGE — are direct casualties of this regime.
Iran War Rhetoric Compounds the Risk-Off Signal
President Trump’s statement that the U.S. would “hit Iran hard” over the next two to three weeks has sent oil prices sharply higher. The dual pressure of trade war escalation and potential military conflict in a major oil-producing region represents the most acute risk-off combination the market has faced this quarter. Rising oil prices reignite inflation concerns, which in turn delay Fed rate cuts — a critical headwind for speculative assets. Bitcoin and Ethereum fell sharply alongside global equities as the Iran tension headlines broke, confirming that crypto now trades as a high-liquidity risk asset rather than an uncorrelated store of value in periods of acute macro stress.
Federal Reserve Policy — Rates on Hold
The Federal Reserve has been on hold at 3.50%–3.75%, with the tariff-driven inflationary impulse and strong labour data repeatedly pushing out rate cut expectations. Each tariff shock in this cycle has directly repriced the rate cut timeline, creating a structural headwind for crypto assets that benefited enormously from the 2024–2025 rate-cutting environment. Until the Fed either pivots or clearly signals an imminent cut, the macro tailwind that powered Bitcoin to $126,000 in October 2025 remains absent. Today’s tariff announcement makes any near-term cut even less likely.
Crypto-Specific Fundamentals — Bitcoin Treasury Unwind
A separate but compounding bearish fundamental is the unwinding of the Bitcoin treasury boom. Falling prices and prolonged consolidation are pushing public firms and sovereign holders that accumulated BTC during the 2024–2025 bull run to begin liquidating reserves to shore up balance sheets. This represents structural selling pressure that goes beyond retail sentiment — it is institutionalised forced selling, and it emerges precisely when the market can least absorb it. Spot BTC ETF outflows have resumed after brief respites, confirming that institutional conviction at current price levels is weak.
Risk Sentiment — Fear Dominates
The Crypto Fear & Greed Index is deep in Fear territory, consistent with the sustained bear trend from the October 2025 all-time highs. Bitcoin is now down over 46% from its $126,000 peak — a decline of historic proportions within the post-halving cycle. Gold has significantly outperformed Bitcoin year-to-date, attracting institutional safe-haven flows that might previously have rotated into crypto. The narrative of Bitcoin as digital gold is being stress-tested, with traditional safe-haven assets like gold and CHF absorbing the haven bid that crypto hoped to capture.
Forward Catalyst — NFP Tomorrow, Iran in Focus
The most critical near-term catalyst is tomorrow’s Non-Farm Payrolls report at 12:30 GMT Friday. A strong print would further cement the Fed-on-hold narrative and extend crypto’s pain. A weak print might briefly spark a relief rally on rate cut hopes — but would simultaneously raise recession fears, a mixed signal at best. Beyond NFP, any confirmation of U.S. military action against Iran, or retaliatory tariff announcements from China and the EU, would be the most explosive potential catalyst for another sharp downside move in all four crypto instruments covered today.
Bitcoin is absorbing the full force of the new US tariff shock alongside escalating Iran war rhetoric from the White House. The cryptocurrency has now fallen over 46% from its October 2025 all-time high of $126,000, and today’s macro environment provides no credible near-term catalyst for recovery. The tariff regime directly tightens financial conditions by postponing Fed rate cuts, reducing the liquidity backdrop that fuelled Bitcoin’s 2024–2025 bull run. Institutional flows confirm the weakness: spot ETF outflows have resumed, and corporate treasury holders who accumulated BTC at elevated prices are beginning to liquidate.
The geopolitical angle is equally damaging. Historically, periods of imminent military conflict have caused Bitcoin to initially sell off as investors exit risk assets for traditional havens. Trump’s statement about hitting Iran “hard” within two to three weeks has pushed oil prices up sharply, reigniting inflation expectations and further reducing the probability of a near-term Fed pivot. Gold has captured the safe-haven bid that Bitcoin hoped to attract, with gold trading near $5,100 per ounce — a stark contrast to Bitcoin’s continued decline.
The wash trading investigation by federal authorities (FBI-created token sting) has added a regulatory cloud over crypto markets broadly. Combined with the IRS mandatory cost-basis reporting rules active since January 2026, the compliance burden on crypto participants is increasing while prices are falling — a toxic combination for sentiment. The next fundamental catalyst with genuine upside potential is either a Fed rate cut announcement or a de-escalation in the Iran situation, neither of which appears imminent as of April 2, 2026.
The daily Bitcoin chart tells an unambiguous bearish story. Price has been trading inside a well-defined descending channel since the January 2026 peak near $98,769 (Fibonacci level 1.0), with every rally attempt failing at progressively lower highs. The dashed descending channel line connecting the January and February swing highs now acts as dynamic resistance, currently located near $70,000. Each successive test of this trendline has resulted in rejection and a move to new cycle lows.
Current price at $66,263 is sandwiched in the zone between the 0.236 Fibonacci support at $69,171 (overhead resistance, now broken) and the 0.0 Fibonacci base at $60,029 — the true structural floor for this correction. The 0.236 level had acted as brief support in March but has clearly been surrendered, converting it to resistance. The next meaningful Fibonacci level above is the 0.382 at $74,827, which aligns with the descending channel resistance — a formidable double barrier for any attempted recovery.
On the indicators side: RSI(14) is in bearish territory below 40, MACD is negative with histogram trending downward, and price is well below all major EMAs (20, 50, 200). The 200-day EMA sits significantly above current price, acting as a distant but important long-term target for any structural recovery. Bollinger Bands are contracting slightly after the recent volatility burst, suggesting the next explosive move — statistically more likely downward given the trend — is building. ADX above 25 confirms trend strength. ATR reflects elevated volatility, appropriate for wider stop placement.

Candlestick Patterns & Chart Formations
The dominant chart formation on the Bitcoin daily is the descending channel that has been active since the January 2026 high at $98,769. The channel connects a series of lower highs and lower lows in a clearly directional bearish structure, with the lower boundary of the channel now pointing toward the $60,029 Fibonacci base level — a critical zone where Bitcoin last found structural support in late 2024. Today’s candle is forming as a bearish continuation candle, opening near $68,186, printing a high of $68,649, and declining sharply to a current close near $66,263 — a classic top-wick rejection candle that confirms seller control.
The failed retest of the 0.236 Fibonacci level at $69,171 in March was a textbook bearish pattern. After briefly reclaiming this level in a mid-March relief rally, price was swiftly rejected and retreated below it — a “dead cat bounce” pattern that experienced traders recognise as distribution. The confirmation candle for the break below $69,171 was a large bearish engulfing candle on high volume, validating the downside continuation signal. For any bullish reversal to be credible, Bitcoin would need to reclaim and close above $69,171 on daily timeframe — an achievement that looks highly unlikely given current macro conditions.
The consolidation box between $60,000 and $72,000 represents the structural battleground for this market phase. The lower boundary at $60,029 aligns with the 0.0 Fibonacci level and is the key support to watch. A weekly close below $60,000 would signal a macro-level breakdown targeting the $50,000 psychological level. Conversely, a clean break above the descending channel resistance with volume confirmation would be the technical signal for a potential trend reversal. Until either of these conditions is met, price action within the $60K–$72K range remains the primary focus.
| Level Type | Price | Basis | Significance |
|---|---|---|---|
| Strong Resistance | $90,478 | 0.786 Fibonacci | Major Fib recovery level — first structural target in a recovery scenario |
| Resistance Zone | $85,970 | 0.618 Fibonacci | Golden ratio — significant long-term resistance if channel breaks |
| Immediate Resistance | $74,827 | 0.382 Fibonacci + Channel | Confluence of Fib and descending channel resistance trendline |
| Key Resistance | $69,171 | 0.236 Fibonacci (Broken) | Former support, now confirmed resistance after failed retest |
| Current Price | $66,263 | Live Market Price | Consolidating near session lows, bearish momentum intact |
| Immediate Support | $63,000 | Psychological + Prior Low | February 2026 bear market low — critical near-term support |
| Key Support | $60,029 | 0.0 Fibonacci Base | The structural floor of the entire Fibonacci range — major level |
| Major Support | $55,000 | Psychological | Long-term buyers historically active at this psychological level |
| Deep Support | $50,000 | Psychological / 2024 Base | Multi-year structural support; bear case target if $60K breaks |
BTC/USD is confirmed bearish: descending channel active since January 2026, RSI below 40, MACD negative, price below all EMAs. The 0.236 Fibonacci at $69,171 has been decisively lost and converted to resistance. The new US tariff shock and Iran war rhetoric provide the fundamental catalyst for continued risk-off selling. Entry at $66,800 on any intraday bounce, TP at $62,500 (prior February lows), SL above $69,200 (0.236 Fib resistance). R/R 1.8:1. Consider partial close at $64,000 with SL moved to breakeven.
Ethereum is the hardest-hit major cryptocurrency today with a −5.23% daily decline — underperforming Bitcoin and reinforcing the structural weakness that has plagued ETH throughout this bear cycle. The short seller narrative around Ethereum has gained traction in 2026: Culper Research’s disclosure of a short position in ETH and ETH-linked equities, arguing the Fusaka upgrade weakened tokenomics by collapsing fee revenues and enabling spam transactions, has added genuine fundamental concern to what was previously a purely macro-driven selloff.
The ETH/BTC ratio remains under persistent downward pressure, meaning Ethereum is consistently losing ground against Bitcoin even within the crypto bear market. This relative weakness suggests that capital within crypto is consolidating into Bitcoin, the perceived safer asset, rather than risking exposure to smart contract platform tokens. Institutional interest in ETH ETFs remains muted compared to Bitcoin, and the Ethereum ecosystem’s on-chain fee revenue compression since the Fusaka upgrade has removed a key fundamental support mechanism.
The $2,000 psychological level is the immediate battleground. A daily close below $2,000 would be a significant psychological event that triggers further retail stop-loss selling and potentially accelerates the decline toward the $1,750 Fibonacci base at 0.0. The Federal Reserve’s hold posture and the macro headwinds from New US Tariffs tariffs mean there is no near-term fundamental catalyst to reverse Ethereum’s trend. Any recovery requires Bitcoin to first stabilise and reclaim $70,000.
The ETH/USD daily chart mirrors Bitcoin’s structure with an even more pronounced bearish character. Price has been inside a descending channel since the early January high of approximately $3,525, with the descending resistance trendline now acting as a ceiling near $2,400–$2,500 — well above current price at $2,028. The critical Fibonacci structure runs from the 0.0 base at $1,750 to the 1.0 level near $3,526, with current price sitting uncomfortably close to the bottom of this range at the 0.236 retracement of $2,058.
The 0.236 Fibonacci level at $2,058.04 was today’s key level — and ETH has broken below it on an intraday basis, trading at $2,028. This is a critical technical development. The 0.236 level had been acting as support since the February lows, and its violation converts it to resistance. If ETH closes the daily candle below $2,058, the next major support cluster is $1,900 (psychological) followed by the $1,750 Fibonacci base. The multi-timeframe picture (weekly → daily → 4H) is uniformly bearish, with no timeframe showing a credible base formation.
RSI is approaching oversold territory but has not yet reached the extreme readings that historically precede relief bounces. The MACD is deeply negative. Bollinger Bands are widening on increased daily volatility, with price testing the lower band. The Stochastic oscillator is in oversold territory, which occasionally precedes a technical bounce — but in a strong bear trend, oversold conditions can persist for extended periods before any meaningful recovery materialises.

Candlestick Patterns & Chart Formations
Today’s ETH/USD candle is forming as a bearish marubozu-type body — opening at $2,139, printing a high of $2,162, and collapsing to a low of $2,027, closing near the session low at $2,028. This candle body structure, with minimal upper wick and close near the low, signals dominant seller control throughout the session. The pattern occurs directly at the 0.236 Fibonacci support level, making it a high-conviction bearish signal: sellers are not waiting for a bounce before adding to positions.
The most critical pattern development is the breaking of the $2,058 support (0.236 Fibonacci), which has now been tested and violated. This level had held as support through February and March, acting as a distribution zone where sellers systematically accumulated short positions. Today’s clean break below it — triggered by macro catalyst — confirms the breakdown. The pattern target from this Fibonacci break points directly to the $1,750 base level (0.0 Fib), representing a further 14% downside from current levels.
For bulls to invalidate the bearish setup, ETH needs to produce a daily close back above $2,058 with strong volume, followed by a break above the $2,248 (0.382 Fib) to even suggest a potential trend change. The confirmation candle for a recovery would be a bullish engulfing pattern on the daily chart at or above $2,058 — something that looks highly unlikely in the current macro environment of new US tariff measures and Iran tensions.
| Level Type | Price | Basis | Significance |
|---|---|---|---|
| Strong Resistance | $2,774 | 0.786 Fibonacci | Deep recovery target — requires major trend reversal |
| Resistance Zone | $2,555 | 0.618 Fibonacci | Golden ratio — major hurdle in any recovery |
| Immediate Resistance | $2,401 | 0.5 Fibonacci (Midpoint) | 50% retracement — psychological and technical resistance |
| Key Resistance | $2,248 | 0.382 Fibonacci | Critical level to reclaim for any bullish reversal thesis |
| Broken Support → Resistance | $2,058 | 0.236 Fibonacci (Broken) | Today’s critical breakdown level — now resistance |
| Current Price | $2,028 | Live Market Price | Below 0.236 Fib — bearish signal if daily closes here |
| Immediate Support | $1,900 | Psychological | Round number support — high retail significance |
| Key Support | $1,826 | Feb 2026 Low | Prior bear market low from February tariff shock |
| Major Support | $1,750 | 0.0 Fibonacci Base | Structural floor of this correction — ultimate downside target |
ETH/USD has broken decisively below the 0.236 Fibonacci level at $2,058, with bearish marubozu candle confirming seller control. RSI oversold but in trend, MACD deeply negative. new US tariffs and Iran tensions provide macro catalyst. Sell at $2,055 on any failed retest of $2,058, TP at $1,900 (psychological), SL above $2,130. R/R 2.0:1. Partial close at $1,960, move SL to breakeven thereafter.
Solana is experiencing a severe correction from its 2025 all-time highs, now trading at $78.13 — down from the $128.18 peak (Fibonacci level 1.0 on the chart). The 39% decline reflects both the broader crypto bear market and Solana-specific concerns around competitive positioning against Ethereum Layer 2 solutions and new Layer 1 challengers. In a risk-off environment driven by new US tariff measures and Iran tensions, high-beta Layer 1 tokens like SOL typically underperform Bitcoin on the downside, which today’s −4.80% daily decline versus Bitcoin’s −2.82% confirms.
On the positive fundamental side, Solana’s network continues to demonstrate exceptional throughput and low transaction costs, maintaining its position as the preferred chain for DeFi, NFT activity, and consumer crypto applications. Hashrate equivalent (validator participation) remains high, suggesting long-term confidence among stakers. However, in the current macro environment, strong fundamentals are insufficient to offset the macro headwinds — assets are being sold on risk aversion, not evaluated on individual merit.
The institutional narrative around Solana ETFs has stalled. While filings were progressing in early 2026, the current bear market and regulatory environment have slowed institutional interest. Without a clear ETF catalyst or a significant macro tailwind reversal, Solana’s near-term price action will continue to track Bitcoin’s trajectory with amplified negative beta.
Solana’s daily chart displays a textbook descending channel with the dashed resistance trendline descending from the January 2026 high of $128.18 (Fibonacci 1.0). Current price at $78.13 is directly below the 0.236 Fibonacci level at $80.76 — a level that was acting as the base of the recent March consolidation range. Today’s candle has broken below this level convincingly, opening at $82.18 and declining sharply to $77.81 before a minor recovery to the current $78.13 close.
The Fibonacci structure (base at $66.09, Fib 1.0 at $128.18) defines the full correction range for this bear cycle. Current price at $78.13 represents a 39% retracement from the cycle high, and the break below 0.236 at $80.76 projects the next significant stop at the $66.09 Fibonacci base — a further 15% downside from current levels. This $66 area is the key structural floor that must hold to prevent a deeper capitulation to sub-$60 levels.
The technical indicators paint a uniformly bearish picture: RSI is below 35, MACD is in negative territory with histogram turning down after a brief flirtation with zero, and all major EMAs are above price acting as resistance. The descending channel trendline is now the primary technical constraint — until SOL can break above the descending trendline with strong volume, every rally remains a selling opportunity for technically-oriented traders.

Candlestick Patterns & Chart Formations
Solana’s today’s candle is a near-perfect bearish engulfing formation when viewed against yesterday’s smaller body. The candle opens at $82.18, nearly matching the prior day’s close, establishes a marginal high at $82.68, then collapses throughout the session to a low of $77.81 — closing near the bottom of the range at $78.13. This pattern, forming directly at the 0.236 Fibonacci level ($80.76), is a high-conviction reversal signal that confirms the level as firm resistance rather than support.
The distribution phase observable on the Solana daily chart throughout February and March is a critical structural pattern. During this period, price repeatedly tested the $80.76–$89.83 range without breaking higher, forming a series of lower highs while the descending channel trendline compressed from above. Professional money was quietly exiting long positions into this consolidation. Today’s macro shock from new tariff announcements has been the catalyst to resolve this distribution to the downside, exactly as the structure suggested it would.
For a bullish reversal signal, Solana would need to print a strong daily close above $80.76 (0.236 Fib) followed by a weekly candle that breaches the descending channel resistance. The confirmation pattern would be a bullish outside candle (wider range than the preceding day) with above-average volume, closing well above $80.76. In the current environment, this scenario requires a fundamental catalyst reversal — specifically, either a New US Tariffs tariff pause or a geopolitical de-escalation on Iran.
| Level Type | Price | Basis | Significance |
|---|---|---|---|
| Strong Resistance | $114.95 | 0.786 Fibonacci | Long-term recovery target requiring trend change |
| Resistance Zone | $104.50 | 0.618 Fibonacci | Golden ratio — key ceiling in any recovery |
| Immediate Resistance | $97.16 | 0.5 Fibonacci | Midpoint — psychological and technical barrier |
| Key Resistance | $89.83 | 0.382 Fibonacci | 38.2% retracement — near-term ceiling in any relief rally |
| Broken Support → Resistance | $80.76 | 0.236 Fibonacci (Broken) | Critical breakdown level today — now firm resistance |
| Current Price | $78.13 | Live Market Price | Below 0.236 Fib — bearish continuation in play |
| Immediate Support | $75.00 | Psychological | Round number — retail significant level |
| Key Support | $70.00 | Psychological / Structure | Major psychological and structural support zone |
| Major Support | $66.09 | 0.0 Fibonacci Base | Structural floor — ultimate downside target in bear case |
SOL/USD has broken below the 0.236 Fibonacci at $80.76 with a bearish engulfing candle. Descending channel intact, all EMAs above price acting as resistance, MACD negative. Macro catalyst (New US Tariffs tariffs + Iran) provides fundamental backing. Enter at $79.50 on any intraday bounce rejected at $80.76, TP at $70.00 (psychological), SL at $83.50. R/R 2.4:1. Consider partial close at $74.00 with SL to breakeven.
Dogecoin’s decline from the $0.12717 Fibonacci high to today’s $0.08870 represents a 30% drawdown, consistent with the broader bear market in meme coins and speculative crypto assets. DOGE is particularly vulnerable in a risk-off environment because its value proposition is almost entirely sentiment-driven — there are no underlying revenue streams, DeFi integrations, or institutional narratives to provide a fundamental floor. When macro risk aversion intensifies (as it has today with new US tariffs and Iran military escalation), meme coins are among the first assets to be liquidated.
The Elon Musk-DOGE narrative, which drove multiple speculative rallies in 2024–2025, has become exhausted as a catalyst. Without a fresh speculative trigger — such as a viral social media moment or policy announcement — Dogecoin lacks an independent catalyst to decouple from the broader crypto downtrend. The current environment of institutional risk aversion, regulatory scrutiny, and macro headwinds is precisely the worst possible backdrop for a sentiment-only asset.
DOGE’s market structure also reveals concentrated retail participation. When retail sentiment sours — as it consistently does during prolonged bear markets — Dogecoin suffers disproportionately as retail investors sell their most speculative holdings first. The $0.0787 level (Fibonacci 0.0 base) represents the ultimate structural downside target should today’s weakness extend into a full range breakdown.
Dogecoin’s daily chart shows the cleanest and most compressed descending channel of the four instruments, with a sharply angled descending resistance trendline pressing down on price since the January 2026 highs. The Fibonacci range spans from the 0.0 base at $0.07868 to the 1.0 level at $0.12717, with current price at $0.08870 sitting in the lower quartile of this range — just above the 0.236 Fibonacci level of $0.09013. Unlike ETH and SOL which have broken below their 0.236 levels today, DOGE is still marginally above this equivalent level, but the pressure to break is intense.
The descending channel’s lower boundary is converging on the $0.07868 base, and the technical projection suggests a test of this level is increasingly likely. Each attempt to rally has been met with selling at lower levels than the previous attempt — a textbook lower high pattern that defines the bear trend structure. The 0.236 Fibonacci at $0.09013 is the immediate resistance level: any rally that fails at or below this level is a sell signal.
RSI is approaching the 30 level, entering oversold territory, but as noted with the other instruments, oversold RSI in a strong downtrend is not a reliable buy signal. The MACD is negative and the histogram is declining. Price is well below all major EMAs. The Bollinger Band lower level is being tested. ADX confirms trend strength. The technical bias is uniformly bearish across all indicators and timeframes for DOGE/USD.

Candlestick Patterns & Chart Formations
Today’s DOGE candle opens at $0.09200, prints a marginal high of $0.09230, and declines to a low of $0.08830, closing at $0.08870. The small upper wick combined with the closing near the session low has the characteristics of a shooting star formation on the daily chart — a bearish reversal signal at the top of the day’s range. The fact that this pattern forms just below the 0.236 Fibonacci resistance at $0.09013 adds significant technical weight to the bearish interpretation.
The consistency of Dogecoin’s lower highs is perhaps the most telling pattern on the daily chart. Every single peak from January through April has been lower than the preceding one, creating a textbook staircase descent that shows sellers methodically absorbing each attempt at recovery. This pattern is characteristic of a market in the late stage of a bear trend where all participants — retail, institutional, and algorithmic — are aligned to the downside.
A break below the 0.236 Fibonacci at $0.09013 — which current price at $0.08870 has already penetrated intraday — on a daily close would confirm the next leg of the decline. The pattern target projects to the $0.07868 base level. The confirmation candle for a reversal would need to be a strong daily bullish engulfing bar closing above $0.09013 on high volume — a scenario that requires either a significant Bitcoin recovery or a fresh meme coin narrative catalyst.
| Level Type | Price | Basis | Significance |
|---|---|---|---|
| Strong Resistance | $0.11675 | 0.786 Fibonacci | Long-term recovery level — requires bull market conditions |
| Resistance Zone | $0.10865 | 0.618 Fibonacci | Golden ratio — major resistance in any recovery |
| Immediate Resistance | $0.10292 | 0.5 Fibonacci | Midpoint — strong psychological and technical level |
| Key Resistance | $0.09720 | 0.382 Fibonacci | Critical for any recovery to establish itself |
| Broken Zone → Resistance | $0.09013 | 0.236 Fibonacci | Intraday break — key resistance on any bounce attempt |
| Current Price | $0.08870 | Live Market Price | Below 0.236 intraday — watch daily close |
| Immediate Support | $0.08500 | Psychological | Round number — retail stop cluster area |
| Key Support | $0.08000 | Psychological | Major psychological support — high retail significance |
| Major Support | $0.07868 | 0.0 Fibonacci Base | Structural floor — ultimate downside target |
DOGE/USD shooting star at the 0.236 Fibonacci resistance ($0.09013) with bearish macro backdrop. Descending channel intact, all EMAs above price, MACD negative. As a sentiment-only asset, DOGE is particularly vulnerable to the tariff-driven risk-off environment. Entry at $0.0900 on intraday bounce, TP at Fibonacci base $0.07868, SL at $0.09400. R/R 2.8:1. Consider 50% close at $0.0850 and trailing stop for remainder.
How to Capitalise on Today’s Crypto Market with Capital Street FX
Four crypto instruments in confirmed bear trends — new US tariff measures and Iran tensions creating high-conviction short setups across BTC, ETH, SOL, and DOGE.
Bitcoin is in a confirmed descending channel below $67K with new US tariffs and Iran escalation as the double macro catalyst. Capital Street FX’s 1:10,000 leverage lets you size your BTC short precisely to today’s $2,800 ATR volatility range without over-exposing your account.
→ Trade BTC/USD NowETH’s −5.23% daily decline and break below the $2,058 Fibonacci level is a textbook short setup. With 0.0 pip spreads on Capital Street FX, you capture the full move toward $1,900 without spread friction eroding your profit on this high-conviction setup.
→ Trade ETH/USD NowToday’s macro shock from new tariff announcements is creating rapid price moves across all four crypto instruments. If you want to test the setups without real capital risk, Capital Street FX’s free demo account gives you full access to live prices and execution — practice the BTC, ETH, SOL, and DOGE setups risk-free today.
→ Open Free Demo AccountToday’s crypto market has $120+ ATR on ETH and $2,800 on BTC. Zero spreads mean you enter and exit at the exact price the setup requires — no spread cost diluting a 2:1 R/R trade.
Tomorrow’s NFP at 12:30 GMT and today’s ISM PMI at 15:00 GMT are high-slippage events. Capital Street FX’s execution technology ensures your entry and stop levels are filled at your exact requested price.
Today’s four high-conviction short setups on BTC, ETH, SOL, and DOGE can all be run simultaneously. The 900% tradable bonus amplifies your available margin to take full advantage of the market-wide bear move.
ALTX’s Fibonacci drawing tools and multi-timeframe chart overlays are perfect for monitoring today’s BTC descending channel and ETH’s critical $2,058 breakdown level in real time.
With Iran-related headlines potentially breaking outside US hours and NFP tomorrow at 12:30 GMT, Capital Street FX’s round-the-clock support team is available to assist with position sizing and execution during every session.
Today’s new US tariff shock has already produced sudden spikes across all four crypto pairs. Negative balance protection ensures that a surprise news-driven spike beyond your SL cannot result in a balance below zero.
| GMT Time | Currency/Market | Event | Forecast | Previous | Actual | Impact |
|---|---|---|---|---|---|---|
| All Day | USD/Global | US Tariff Announcements | Sweeping | — | Confirmed ▼ | HIGH |
| 01:30 | AUD | Australia Retail Sales MoM | 0.3% | 0.3% | Pending | MED |
| 07:00 | EUR | Germany Retail Sales YoY | 1.8% | 2.1% | Pending | MED |
| 09:00 | EUR | Eurozone PPI MoM | 0.5% | 0.6% | Pending | MED |
| 12:30 | USD | Initial Jobless Claims | 225K | 224K | Pending | MED |
| 13:15 | USD | ADP Employment Change | 115K | 77K | Pending | HIGH |
| 14:45 | USD | S&P Global Services PMI (Final) | 54.3 | 54.3 | Pending | MED |
| 15:00 | USD | ISM Services PMI | 52.8 | 53.5 | Pending | HIGH |
| All Day | Global | Iran Military Escalation Risk | Elevated | — | Active ⚠ | HIGH |
| Fri 12:30 | USD | Non-Farm Payrolls (Tomorrow) | 140K | 151K | Tomorrow | HIGH |
| Fri 12:30 | USD | Unemployment Rate (Tomorrow) | 4.1% | 4.1% | Tomorrow | HIGH |
⚠ Critical Event Alert — NFP Tomorrow, Friday April 3 at 12:30 GMT: Non-Farm Payrolls will be released tomorrow morning and represents the highest-impact scheduled economic event for crypto markets in the next 24 hours. A strong print above 160K would cement the Fed-on-hold narrative and extend the bearish pressure on all four crypto instruments. A weak print below 120K would trigger a brief relief rally on rate cut hopes, but the overriding geopolitical concerns from Iran mean any rally should be treated as a selling opportunity. Widen stops by 15–20% ahead of the 12:30 GMT release to account for elevated volatility spreads.
What macro factors are affecting the crypto market on April 2, 2026?
Two macro themes are shaping today’s session. First, new US tariff announcements are creating uncertainty across global risk assets by raising concerns about tighter financial conditions and delayed Federal Reserve rate cuts — the liquidity backdrop that powered crypto’s 2024–2025 bull run. Second, US rhetoric about potential military action against Iran has pushed oil prices higher, reigniting inflation concerns and increasing cross-market volatility. These factors are weighing on high-beta assets including BTC, ETH, SOL, and DOGE. Traders should watch key Fibonacci reference levels: whether support holds or fails at these zones will drive the next directional move. Both short and long setups are structurally valid depending on how price responds — see the instrument analysis sections for specific levels.
Why does the $2,058 level matter so much for Ethereum today?
The $2,058 level on ETH/USD corresponds precisely to the 0.236 Fibonacci retracement of the entire February-to-April bear market range, calculated from the $1,750.71 low to the $3,526 prior high. In Fibonacci analysis, the 0.236 level is the first meaningful retracement zone — and it had been acting as dynamic support for ETH throughout February and March 2026. Today, ETH has broken below this level intraday, closing at $2,028. If this break holds on the daily close, it converts $2,058 from support to resistance and opens the technical path toward $1,900 (psychological support) and ultimately the $1,750 base. For bulls, reclaiming $2,058 on a daily close with volume is the minimum requirement to negate the bearish signal.
What does the Shooting Star candlestick pattern on DOGE/USD signal today?
The Shooting Star pattern on Dogecoin’s daily chart forms when a candle opens near its low, rallies significantly during the session (creating a long upper wick), but then falls back to close near the open price — with the upper wick at least twice the body size. Today’s DOGE candle opens at $0.09200, prints a high of $0.09230, but then closes at $0.08870 — the upper wick (rejection zone) aligns with the 0.236 Fibonacci resistance at $0.09013. In technical analysis, this pattern at a resistance level signals that buyers attempted to push price higher but met selling pressure. The $0.09013 level is the key pivot: if price reclaims and holds above it, the shooting star pattern is invalidated and $0.10288 (0.382 Fib) comes into view. If $0.09013 continues to cap price, the Fibonacci base at $0.07868 is the reference downside target.
How should I manage risk on crypto positions ahead of tomorrow’s NFP?
Non-Farm Payrolls at 12:30 GMT tomorrow (April 3) is a scheduled high-volatility event that requires specific risk management adjustments. For any positions held overnight, consider widening stop-loss levels by 15–20% from current levels to avoid premature stop-outs from the initial NFP spike. For today’s setups — whether long or short — set stops beyond the most recent key Fibonacci levels as outlined in the instrument sections; this naturally provides the cushion needed to withstand the NFP spike. Do not take on new position sizes larger than your normal risk per trade going into the NFP. If you have winning positions from today’s macro-driven moves, consider taking partial profits (50%) before the NFP release on Friday to lock in gains while leaving exposure for any post-NFP continuation.
What should I watch for during the US session today with Bitcoin below $67K?
The US session is the most active trading window today, with several key levels and catalysts in focus. First, watch Bitcoin’s daily close relative to $66,000 — a sustained close below this level opens the $63,000 area, while a recovery above $68,000 would ease near-term downside pressure. Second, monitor the ISM Services PMI release at 15:00 GMT — a reading below 50 (contraction) would amplify macro concerns, while a strong print above 55 could spark a relief move. Third, watch for any administration statements on tariff specifics — markets are sensitive to details around scope and implementation. Fourth, Iran-related headlines have the potential to cause sharp intraday moves in oil and correlated assets including crypto. The $64,000–$66,000 zone is the key battleground for Bitcoin during this session.
How does Capital Street FX’s Negative Balance Protection help with today’s volatile crypto setups?
Negative Balance Protection is especially critical in today’s environment because of the combination of tariff headline risk and Iran war rhetoric — both of which have historically caused sudden, gap-down moves in crypto that exceed normal stop-loss levels. When Bitcoin dropped over 16% in a single day after Trump floated 100% China tariffs in October 2025, traders without Negative Balance Protection saw account balances go negative as prices gapped through stop levels during liquidation cascades. With Capital Street FX’s Negative Balance Protection, your maximum loss is limited to your account balance regardless of how far the market moves beyond your stop-loss. On a day like today, with new US tariffs and Iran developments being the key catalysts, the potential for sudden news-driven spikes exceeding normal ATR levels is elevated — making this protection feature directly relevant to every crypto trade you place today.
Market Summary & Key Levels to Watch — April 2, 2026
Today’s market is navigating a macro-heavy environment. New US tariff announcements and Iran geopolitical developments have contributed to elevated volatility across risk assets. Current prices: Bitcoin $66,263 (−2.82%), Ethereum $2,028 (−5.23%), Solana $78.13 (−4.80%), and Dogecoin $0.08870 (−3.17%). All four instruments are trading near or below key Fibonacci reference levels and within descending channel structures — making these levels critical to monitor as the US session progresses. Whether buyers defend these zones or sellers extend will determine the next directional move.
The macro backdrop centres on two themes: the new US tariff package and its implications for Fed rate cut timing, and Iran-related geopolitical risk lifting oil and reducing appetite for high-beta assets. The Federal Reserve remains on hold at 3.50%–3.75%. Key upside levels to watch for a potential recovery: BTC $69,171 (0.236 Fib), ETH $2,248 (0.382 Fib), SOL $89.83 (0.382 Fib). These levels reclaiming on daily closes would shift the near-term technical picture. On the downside: BTC $63,000 / ETH $1,900 / SOL $70.00 / DOGE $0.07868 are the reference support targets if current levels fail.
Today’s remaining key catalysts: ISM Services PMI at 15:00 GMT (consensus 52.8), any Iran or tariff-related headline developments during the US session, and Bitcoin’s daily close relative to the $66,000 psychological level. Tomorrow’s NFP at 12:30 GMT adds volatility risk for overnight positions — traders should account for this in position sizing and stop placement heading into tonight’s close.
Key levels for the next 3–5 trading sessions: BTC support $63,000 / $60,029 — resistance $69,171 / $74,827. ETH support $1,900 / $1,750 — resistance $2,058 / $2,248. SOL support $70.00 / $66.09 — resistance $80.76 / $89.83. DOGE support $0.07868 — resistance $0.09013 / $0.10288. Monitor these levels for breakout or reversal signals as macro clarity improves.