Capital Street FX| aily Market Analysis Forex — EUR/USD, GBP/USD, USD/CAD, USD/CHF | April 1, 2026
EUR/USD · GBP/USD · USD/CAD · USD/CHF
The US dollar holds a complex position on April 1 as the DXY hovers near 99.82 — near an 11-month high — sustained by safe-haven flows from the Iran–US conflict now entering its fifth week, with the Strait of Hormuz partially restricted and oil prices firmly elevated. EUR/USD trades at 1.1511 after a sharp monthly decline, trapped below the 0.236 Fibonacci retracement at 1.1659 as the ECB holds its deposit rate at 2.00% amid war-driven inflation risks. GBP/USD is recovering marginally to 1.3276 but remains structurally pressured. USD/CAD tests critical 0.618 Fibonacci resistance at 1.3883, rated Strong Buy on daily indicators. USD/CHF pulls back from the 0.786 Fibonacci confluence at 0.7873 after hitting its 1D MA200 for the first time in nearly a year. ISM Manufacturing PMI and ADP employment data are the day’s primary catalysts.
The Federal Reserve held its benchmark rate unchanged at 3.50%–3.75% at its March meeting, a decision supported by all voting members except Governor Miran, who dissented in favour of a 25bp cut. Chair Jerome Powell’s accompanying commentary maintained a distinctly data-dependent and cautious tone. Growth is described as solid on the back of resilient consumer spending and continuing productivity gains, while the labour market — with the unemployment rate at 4.4% as of March — is cooling only gradually. The key shift at this meeting was an upward revision to 2026 inflation projections, reflecting the pass-through of energy prices from the escalating Middle East conflict into producer and consumer costs.
Markets have now largely priced out the two rate cuts that were anticipated for H1 2026 at the start of the year. The OIS market currently prices fewer than 35 basis points of cuts for all of 2026, versus over 80bp priced in January. This repricing is the dominant driver of USD strength across all four pairs covered in this report. The ISM Manufacturing PMI released today will test whether the expansion trend that began in January — with January’s 52.6 reading and February’s 52.4 — has been sustained through March, with the S&P Global final manufacturing PMI already coming in at 52.4 for March. Today’s ADP employment figure will also set the tone ahead of Friday’s Non-Farm Payrolls.
The rate differential between the US (3.50–3.75%) and both the ECB deposit rate (2.00%) and the SNB rate (0.50%) remains the fundamental anchor for EUR/USD and USD/CHF. Until either the Fed signals a clear pivot or European central banks tighten materially, USD carry advantage remains structural.
The European Central Bank left all three key rates unchanged at its last meeting, with the deposit facility rate remaining at 2.00%. The tone from the Governing Council was cautious rather than supportive of further easing. ECB Executive Board member Stournaras warned publicly that a prolonged Middle East conflict could derail the bank’s baseline scenario. Critically, markets are pricing in approximately 70 basis points of additional ECB tightening by year-end — a sharp reversal from the easing path markets expected in early 2026. This repricing reflects the risk that war-driven energy costs generate second-round inflation effects that force the ECB to respond with rate hikes rather than the cuts it had previously signalled.
EUR/USD positioning data underlines the severity of the sentiment shift. Net EUR longs, which stood near 9,000 contracts as of the week ending March 24, represent a significant trimming from January’s bullish consensus. EURUSD positioning has swung to 34% net short — the most bearish in over a year. Meanwhile, European equity markets have sold off more than 5%, and German and French government borrowing costs have repriced sharply at the front end. The current account position of the Eurozone is deteriorating as high oil import costs drive a structural drain on external balances, further depressing EUR demand from real-money flows.
Today’s calendar includes ECB President Lagarde speaking at 09:30 GMT. Any commentary suggesting the ECB’s easing bias remains intact despite energy pressure will weigh on EUR/USD. Equally, any hawkish signal defending the deposit rate or hinting at tightening would provide short-term EUR support, although the pair’s broader structure remains bearish below the 1.1659 Fibonacci level.
Sterling has been under severe pressure as the ongoing Middle East conflict intersects with the UK’s structural vulnerabilities as a major energy importer. GBP/USD dropped below 1.3200 at the start of the week for the first time since late November 2025, driven by the combination of a strong USD safe-haven bid and energy cost pressures undermining the UK’s trade balance and consumer spending outlook. The Bank of England’s rate-setting path has become considerably more complex as the MPC must balance evidence of a looser labour market against the risk of renewed energy-driven inflation.
The memory of 2022 — when the MPC was criticised for falling behind the inflation curve — weighs heavily on current policymaker thinking. As a result, the MPC is likely to maintain its restrictive stance even as growth pressures build, limiting sterling’s room for structural recovery. UK political risk adds another layer of complexity: May’s local elections represent a key test of the Starmer government’s position, and any political instability would further undermine GBP confidence. Today’s UK Final Manufacturing PMI reading will be closely watched for additional evidence of energy cost pass-through in the manufacturing sector.
USD/CAD is navigating a fundamentally complex environment. On one side, the broader USD safe-haven bid from the Middle East conflict pushes the pair higher. On the other, Canada’s status as a major oil producer means that elevated crude prices provide some offsetting support to the Canadian dollar through improved terms of trade — a dynamic that creates opposing forces within the pair. RBC Capital Markets previously forecast USD/CAD to trade around 1.3700 in H1 2026, though recent price action has broken significantly above that level, with the pair now testing 1.3900.
The Bank of Canada’s policy stance and the status of USMCA trade negotiations remain critical variables. Governor Macklem is monitoring the energy shock carefully. Canada’s economy benefits from oil revenues but faces headwinds from its deep trade integration with the US — if the US economy slows, Canadian exports and growth follow. Today’s Canadian GDP data release at 13:30 GMT is the most significant near-term domestic catalyst for CAD. A weak print would reinforce USD/CAD’s bullish structure at the 0.618 Fibonacci level; a stronger-than-expected reading could trigger a pullback toward the 0.500 Fibonacci at 1.3807.
The Swiss National Bank maintains one of the most dovish stances among G10 central banks, with its policy rate at 0.50%, creating an interest rate differential against the Federal Reserve of over 300 basis points. The SNB has historically intervened in FX markets to prevent excessive CHF strength, and has signalled willingness to do so again if necessary. Despite the CHF’s traditional safe-haven status in times of geopolitical stress, the USD has outperformed the franc in the current Middle East war environment — a notable structural shift that reflects the USD’s additional benefit as the global energy pricing currency.
USD/CHF tested its 1D 200-day moving average and the 0.786 Fibonacci retracement at 0.7873 for the first time in nearly 12 months in late March. The pair is rated Strong Buy on Investing.com’s daily technical summary. The 52-week range of 0.7604–0.8850 illustrates the substantial potential recovery if USD/CHF can sustain momentum above 0.7873. The SNB’s next policy decision and any intervention rhetoric will be key forward catalysts for this pair.
The Iran–US military conflict, now entering its fifth week, remains the single most significant geopolitical driver across all four currency pairs in this report. Tehran has effectively blocked the Strait of Hormuz and threatened Red Sea shipping through Houthi proxy forces that have re-entered the conflict. President Trump has threatened strikes on Iranian energy infrastructure unless the Strait is reopened, creating an environment of sustained geopolitical uncertainty that is driving a persistent safe-haven bid into the US dollar. Oil prices trading above $100 per barrel are being absorbed differently across the covered currency pairs: the USD and CAD benefit from elevated energy prices (US as producer, Canada as exporter), while EUR and GBP face headwinds from higher import costs.
The currency market’s structural response has been a decisive rotation away from EUR. EURUSD positioning has moved to its most bearish level in over a year, with European equities down over 5% and front-end Eurozone government borrowing costs repricing sharply. For traders, the war’s trajectory — whether toward a de-escalation deal or an expansion to Iranian energy infrastructure strikes — remains the binary event risk that overshadows all technical setups across EUR/USD, GBP/USD, USD/CAD, and USD/CHF. Peace signals would generate an immediate USD reversal; escalation would extend current dollar strength.
| Time (GMT) | Event | Currency | Impact | Forex Implication |
|---|---|---|---|---|
| 09:30 | ECB President Lagarde Speech | EUR | HIGH | Any revision to the ECB’s easing bias or tightening signal will directly move EUR/USD; hawkish tone could provide short-term EUR lift above 1.1511. |
| 09:30 | UK Final Manufacturing PMI (Mar) | GBP | MED | A sub-50 reading will reinforce GBP/USD’s bearish structure below 1.3325 and increase pressure on the 0.236 Fibonacci support. |
| 13:15 | US ADP Non-Farm Employment Change (Mar) | USD | HIGH | A strong ADP print above 200K will reinforce the Fed’s hold stance and extend USD strength across EUR/USD and GBP/USD short setups. |
| 13:30 | Canada GDP MoM (Jan) | CAD | HIGH | A weak GDP reading will confirm the Bank of Canada’s cautious stance and push USD/CAD above the 0.618 Fibonacci level at 1.3883 toward 1.4128. |
| 14:00 | US ISM Manufacturing PMI (Mar) | USD | HIGH | Consensus expects a reading above 50; a beat would strengthen the USD across all four pairs and reinforce USD/CHF’s recovery toward the 1.000 Fib at 0.8042. |
| 18:00 | US JOLTS Job Openings (Feb) | USD | MED | Job openings data feeds directly into Friday’s NFP positioning; a drop below 7.0M would be the first material sign of labour market softening and could trigger a USD pullback on EUR/USD. |
EUR / USD

EUR/USD is trading at 1.1511 on the daily chart, positioned below the 0.236 Fibonacci retracement level at 1.1659 — a level that has now flipped from support to active resistance after the pair’s sharp decline from the 1.000 swing high at 1.2085. The Fibonacci retracement was drawn from the swing high at 1.2085 (January 2026) to the swing low at 1.1396, placing the current price in the zone between the 0.236 and 0.000 levels. The pair has been in a sustained downtrend since the January high, with each rally to Fibonacci retracement levels being met with renewed selling. The current bounce to 1.1511 from 1.1448 intraday is a shallow retracement within the broader bearish structure.
The 0.382 Fibonacci level at 1.1657 and the 0.500 at 1.1741 represent the key overhead resistance levels. For any meaningful bullish reversal to develop, EUR/USD would need to reclaim and close above 1.1659 on the daily timeframe, which aligns with the key Fibonacci confluence zone. Below current price, the 0.000 Fibonacci extension target at 1.1396 is the primary downside objective. RSI (14) remains in the sub-50 bearish zone, consistent with the ongoing selling pressure identified on Investing.com’s daily summary. The MACD remains in negative territory with the signal line above the MACD line — a bearish configuration that has been sustained since mid-February. The 5-day SMA is trading below the 50-day SMA, confirming the short-term downtrend is intact.
| Indicator | Value / Signal |
|---|---|
| Overall Daily Signal | SELL |
| MA Alignment | 8 Sell / 4 Buy |
| RSI (14) | 42.1 — Neutral/Bear |
| MACD | −0.0028 — Sell |
| 5-Day SMA | 1.1498 — Sell |
| 50-Day SMA | 1.1720 — Sell |
| Fibonacci Pivot | 1.1530 |
| Fibonacci Level | Price |
|---|---|
| 1.000 (Swing High) | 1.2085 |
| 0.786 | 1.1938 |
| 0.618 | 1.1822 |
| 0.500 | 1.1741 |
| 0.382 | 1.1657 |
| 0.236 | 1.1559 |
| ▶ Current Price | 1.1511 |
| 0.000 (Target) | 1.1396 |
GBP / USD

GBP/USD is trading at 1.3276, currently positioned just above the 0.236 Fibonacci retracement level at 1.3325 from below, following the pair’s sharp decline from the swing high at 1.3868. The Fibonacci retracement spans from 1.3868 (swing high, February 2026) to 1.3155 (swing low / 0.000 target), placing the pair in a zone that has been under consistent selling pressure since the January–February rally peak. The 0.236 level at 1.3325 is now resistance, having previously served as support during the rally phase. The pair spent last week testing and ultimately failing below this level, establishing the recent downtrend structure.
The 0.382 Fibonacci at 1.3428, the 0.500 at 1.3512, and the 0.618 at 1.3596 represent the successive overhead resistance hurdles that bulls would need to clear to change the structural bias. The 5-day SMA is positioned below the 50-day SMA, and moving average alignment on the daily timeframe is bearish. RSI (14) is in the lower half of its range, consistent with the Sell signal. Today’s UK Final Manufacturing PMI at 09:30 GMT is a key near-term catalyst. A weak reading — particularly if prices remain elevated, pointing to a stagflationary squeeze — would accelerate the move toward the 0.000 target at 1.3155.
| Indicator | Value / Signal |
|---|---|
| Overall Daily Signal | SELL |
| MA Alignment | 9 Sell / 3 Buy |
| RSI (14) | 38.5 — Sell |
| MACD | −0.0041 — Sell |
| 5-Day SMA | 1.3250 — Sell |
| 50-Day SMA | 1.3465 — Sell |
| Fibonacci Pivot | 1.3340 |
| Fibonacci Level | Price |
|---|---|
| 1.000 (Swing High) | 1.3868 |
| 0.786 | 1.3716 |
| 0.618 | 1.3596 |
| 0.500 | 1.3512 |
| 0.382 | 1.3428 |
| 0.236 | 1.3325 |
| ▶ Current Price | 1.3276 |
| 0.000 (Target) | 1.3155 |
USD / CAD

USD/CAD is trading at 1.3900, testing directly above the 0.618 Fibonacci retracement level at 1.3883. The Fibonacci grid is drawn from the swing high at 1.4128 (November 2025) to the swing low at 1.3485 (February 2026). The pair has recovered from the 0.000 (1.3485) level through successive Fibonacci retracement levels, and the current price sits at the most critical junction in the recovery structure. The 0.618 retracement — widely regarded as the “golden ratio” in Fibonacci analysis — at 1.3883 represents the last major resistance before the pair can target the swing high at 1.4128. The pair’s daily candlestick structure shows higher lows and higher highs since the February bottom, a clear bullish higher-timeframe structure.
Daily indicators on Investing.com show USD/CAD rated Strong Buy — the only pair in today’s report with the highest conviction technical signal. The 5-day SMA is above the 50-day SMA, moving average alignment is bullish across the board. RSI (14) is in the upper range but not yet at extreme overbought levels, allowing further upside. A confirmed daily close above 1.3883 on today’s candle — supported by a weak Canadian GDP print — opens the path to the 1.000 Fibonacci target at 1.4128. The only setback scenario is a strong Canadian GDP print that drives a pullback to the 0.500 Fibonacci level at 1.3807.
| Indicator | Value / Signal |
|---|---|
| Overall Daily Signal | STRONG BUY |
| MA Alignment | 11 Buy / 1 Sell |
| RSI (14) | 62.4 — Buy |
| MACD | +0.0063 — Buy |
| 5-Day SMA | 1.3895 — Buy |
| 50-Day SMA | 1.3750 — Buy |
| Fibonacci Pivot | 1.3900 |
| Fibonacci Level | Price |
|---|---|
| 1.000 (Swing High) | 1.4128 |
| 0.786 | 1.3990 |
| 0.618 | 1.3883 |
| 0.500 | 1.3807 |
| ▶ Current Price | 1.3900 |
| 0.382 | 1.3731 |
| 0.236 | 1.3637 |
| 0.000 (Swing Low) | 1.3485 |
USD / CHF

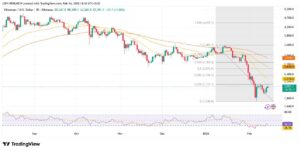
USD/CHF is trading at 0.7934, pulling back from today’s session high of 0.8004 in what appears to be a retest of the 0.786 Fibonacci retracement level at 0.7873 from above. The Fibonacci grid is anchored from the swing high at 0.8042 (1.000 level) down to the swing low at 0.7602 (0.000 level). The pair has been in a bullish recovery phase since January 2026, climbing from the 0.000 level through successive Fibonacci retracements, and recently tested the 0.786 level and the 1D 200-day moving average simultaneously — a significant technical event that marks the most important inflection point in the pair’s structure in approximately 12 months.
Today’s pullback from 0.8004 toward 0.7934 is testing whether the 0.786 Fibonacci at 0.7873 will hold as support on a retest. If price closes the daily candle above 0.7873, the structure remains bullish and the 1.000 target at 0.8042 remains the primary objective. The 5-day SMA aligns with the bullish trend, and daily indicators from Investing.com rate USD/CHF as Strong Buy. The 52-week range of 0.7604–0.8850 confirms the substantial recovery potential that exists if the pair can break above the 1.000 Fibonacci and the SNB does not intervene. Today’s USD macro data — ISM at 14:00 GMT and ADP at 13:15 GMT — are the key catalysts that will determine whether today’s pullback is a buying opportunity or the start of a deeper retracement toward 0.7782 (0.500 Fibonacci).
| Indicator | Value / Signal |
|---|---|
| Overall Daily Signal | STRONG BUY |
| MA Alignment | 10 Buy / 2 Sell |
| RSI (14) | 58.3 — Neutral/Buy |
| MACD | +0.0031 — Buy |
| 5-Day SMA | 0.7958 — Buy |
| 50-Day SMA | 0.7820 — Buy |
| Fibonacci Pivot | 0.7940 |
| Fibonacci Level | Price |
|---|---|
| 1.000 (Swing High) | 0.8042 |
| 0.786 | 0.7873 |
| 0.618 | 0.7874 |
| ▶ Current Price | 0.7934 |
| 0.500 | 0.7822 |
| 0.382 | 0.7770 |
| 0.236 | 0.7706 |
| 0.000 (Swing Low) | 0.7602 |
Three of the four pairs covered in today’s report are aligned with sustained US dollar strength. EUR/USD and GBP/USD carry Sell signals on the daily timeframe, while USD/CAD and USD/CHF are both rated Strong Buy — the highest conviction technical signal available on Investing.com’s daily summary. This directional alignment reflects the single dominant macro driver: the Iran–US conflict now in its fifth week, which has elevated oil prices above $100 per barrel, repriced Fed rate cut expectations to fewer than 35 basis points for all of 2026, and driven a persistent safe-haven bid into the US dollar that has pushed the DXY to near-11-month highs above 99.80.
The technical setups across all four pairs are defined by Fibonacci retracement confluences. EUR/USD is trapped below the 0.236 level at 1.1659, GBP/USD is pressing on the 0.236 at 1.3325, USD/CAD is staging a breakout above the 0.618 at 1.3883, and USD/CHF has successfully tested the 0.786 and 200D MA confluence at 0.7873. The macro narrative — Fed hawkishness, ECB uncertainty, BoC complexity from the CAD-oil dynamic, and SNB structural dovishness — directly connects to the Fibonacci levels each pair is testing. Today’s event risk is concentrated in a three-hour window: ADP at 13:15, Canadian GDP at 13:30, and ISM Manufacturing PMI at 14:00 GMT. These three releases simultaneously address USD, CAD, and the broader US growth picture, making the 13:00–14:30 GMT window today’s defining trading session.
Remaining event risk this week centres on Friday’s US Non-Farm Payrolls — the most significant scheduled macro event for FX markets globally. A strong NFP print would validate the Fed’s hold and extend USD strength, deepening the bearish setups on EUR/USD and GBP/USD while confirming the bullish structures on USD/CAD and USD/CHF. Geopolitical developments in the Middle East remain the non-scheduled binary risk that overrides any technical or data narrative.
Target: 1.1396
Target: 1.3155
Target: 1.4128
Target: 0.8042