Dollar Cracks Below 99 as Iran Ceasefire Shifts Risk Flows: EUR/USD, GBP/USD, NZD/USD, USD/CAD | Capital Street FX Research Desk — April 8, 2026
Dollar Cracks Below 99 as Iran Ceasefire Triggers Risk-On Reversal Across EUR/USD, GBP/USD, NZD/USD & USD/CAD
Daily Forex Market Report covering EUR/USD · GBP/USD · NZD/USD · USD/CAD — Fundamentals, News & Trade Setups for April 8, 2026
What You Need to Know Before You Trade Today
The forex market has shifted decisively into risk-on mode as President Trump announced a two-week “double-sided ceasefire” with Iran, contingent on the reopening of the Strait of Hormuz. The DXY fell sharply through 99, hitting its lowest level in four weeks as the geopolitical safe-haven premium unwound overnight. All USD pairs are moving against the dollar: EUR/USD has bounced from its 0.382 Fibonacci retracement, GBP/USD has reclaimed key structural levels, NZD/USD surged over 2% in a single session, and USD/CAD is pulling back from resistance. Today’s report focuses on whether these moves have legs, or whether traders should wait for a technical confirmation before positioning.
- ▲ EUR/USD — Cautiously Bullish: Pair has bounced from the 0.382 Fib (1.16660) and now trades at 1.16944 — a sustained close above 1.17450 (0.5 Fib) would confirm a recovery phase.
- ▲ GBP/USD — Bullish Reversal: Sterling has surged from the 0.236 Fib base zone near 1.33488, now trading at 1.34423 — a strong reclaim that targets 1.35173 (0.5 Fib) and beyond.
- ▲ NZD/USD — Strong Bounce: Up 2.01% today to 0.58460 — the pair has surged out of the base zone, recovering toward the key 0.382 Fib resistance at 0.58380 which is now being tested as support.
- ▼ USD/CAD — Fading Sell: USD/CAD has retreated from its recent highs, now below the 0.382 Fib (1.37768) with the pair declining 0.40% as CAD benefits from risk-on flows and firmer oil.
Price Snapshot — April 8, 2026
Live Trade Setups — April 8, 2026
The Macro Picture Driving Today’s Forex Market
The Iran Ceasefire — The Catalyst That Broke the Dollar
The dominant story in today’s forex market is the dramatic geopolitical shift overnight. President Trump announced a two-week “double-sided ceasefire” with Iran — contingent on Iran reopening the Strait of Hormuz — after receiving what he described as a “10-point proposal” that he called a workable basis for negotiations. Iran has agreed to reopen the Strait for the two-week window provided all attacks are halted, and Israel has reportedly assented to the ceasefire terms. This development immediately triggered an unwinding of the safe-haven dollar premium that had kept the DXY near 100 for the past several sessions. The DXY fell sharply through 99 to a four-week low as traders unwound long dollar positions that were built as a hedge against further Middle East escalation. The risk-on reversal has been broad-based: commodity currencies, risk-sensitive pairs, and all major USD crosses are benefiting.
DXY Structural Weakness — The Fundamental Backdrop
The Iran ceasefire is the immediate trigger, but the structural backdrop for dollar weakness has been building for months. The DXY declined 9.4% in calendar year 2025, the largest annual drop since 2017, driven by a Federal Reserve easing cycle, tariff uncertainty, and the approaching end of Jerome Powell’s tenure as Fed Chair in May 2026. The Supreme Court ruling in February 2026 — which declared IEEPA-based tariffs unconstitutional — forced the administration to implement a replacement 10% global tariff under Section 122 of the Trade Act, valid for 150 days until July 24, 2026. While this resolved some uncertainty, it also required US Customs to begin processing $166 billion in IEEPA tariff refunds to businesses — a dollar-negative development that is still feeding through the system. With the Fed on hold at 3.50–3.75%, institutional forecasts broadly expect DXY to drift lower through year-end into the low-to-mid 90s once the conflict premium fully unwinds.
Central Bank Policy Divergence
Central bank divergence remains a key structural driver in the forex market. The Federal Reserve held rates at 3.50–3.75% at its March FOMC meeting — the second consecutive hold — with Chair Powell signalling a wait-and-see stance given the conflicting signals from energy-driven inflation and a weakening labour market. The FOMC dot plot currently projects just one cut in 2026, most likely in December, though market pricing is more aggressive given the expectation that Powell’s successor will adopt a more dovish stance. The ECB remains on hold at 2.15% with two to three further hikes priced in the eurozone rate market as Middle East-driven energy inflation pressures build — a backdrop that fundamentally supports the euro against a Fed in easing mode. The Bank of England is holding at 3.75%, while the Bank of Canada and RBNZ are both navigating weaker domestic growth conditions that have constrained their ability to tighten further, which is why NZD and CAD are more sensitive to risk sentiment than to rate differentials in the current forex market cycle.
Risk Sentiment and the Commodity Complex
The Strait of Hormuz ceasefire has a direct impact on oil prices, which in turn feeds through to CAD — given Canada’s status as a major oil exporter. A reopening of the Strait is net positive for global oil supply, which initially caps oil price upside, but the resolution of the conflict premium also boosts risk appetite broadly. In the current forex market context, this creates a dual tailwind for CAD: risk-on flows support commodity FX broadly, while the easing of geopolitical tension reduces the safe-haven premium on the US dollar. For NZD/USD, the risk-on shift is the primary driver today, with the New Zealand dollar historically among the most sensitive of G10 currencies to global risk appetite shifts. Dairy prices — a key NZD fundamental driver — have been stable in Q1 2026, and New Zealand’s export diversification away from the US market (total exports to non-US markets are growing at approximately 11% annually) provides a structural support floor for the kiwi.
Forward Catalysts — US CPI and FOMC Minutes
The most important near-term catalysts for the forex market remain the FOMC Meeting Minutes at 12:30 GMT today, and the US CPI print due on Friday. The minutes will be parsed closely for any indication of how the Fed is thinking about the interplay between energy-driven inflation from the Strait closure — which is now tentatively resolving — and the underlying labour market softness that has been building since late 2025. A dovish tone in the minutes would provide further fuel for the current dollar sell-off. Friday’s CPI data will be particularly important: any upside surprise driven by transportation and logistics costs (which have already risen noticeably in March data) could challenge the current risk-on narrative. Traders in the forex market should maintain awareness that the two-week ceasefire window is inherently fragile — any breakdown in negotiations would immediately reverse today’s risk-on flows and provide a strong dollar bid across all pairs covered in this report.
Fundamental View
EUR/USD’s fundamental picture has brightened modestly today on the back of the DXY breakdown below 99 triggered by the Iran ceasefire announcement. The structural case for a weaker dollar — Fed easing expectations, the approaching change of Fed Chair, and continued $166 billion IEEPA refund processing — remains intact, and today’s geopolitical catalyst has accelerated the forex market’s pricing of that USD weakness. The ECB is on hold at 2.15% with further tightening optionality, which means the rate differential is structurally less supportive of the dollar than it was six months ago.
However, EUR/USD bulls should remain cautious. The eurozone’s underlying growth is still fragile — German industrial output has been soft and the 10% global tariff under Section 122 continues to weigh on European export confidence. The pair’s dramatic rally from sub-1.08 in late 2024 to a peak above 1.20789 in early 2026 was primarily driven by dollar weakness rather than euro fundamental strength. The current bounce from the 0.382 Fibonacci retracement at 1.16660 is therefore primarily a USD story, not a EUR story — which means it is more vulnerable to reversal if the ceasefire breaks down or if Friday’s US CPI surprises to the upside.
German fiscal stimulus — the EUR 1 trillion infrastructure and defence programme — remains a medium-term euro positive that is not fully priced, but its economic transmission will take quarters, not days, to materialise in the forex market.
Technical Structure
On the daily chart, EUR/USD has reversed sharply from the 0.382 Fibonacci retracement at 1.16660, which served as the key support zone. The pair closed the session at 1.16944, with the daily candle showing a strong bullish recovery from the lows of 1.15888. Price is now approaching the critical 0.5 Fibonacci level at 1.17450, which will be the decisive test of whether today’s move is a genuine reversal or a dead-cat bounce within the ongoing corrective channel from the February 1.20789 high.
The descending trendline from the February peak has been acting as resistance through March and into April. A close above 1.17450 (0.5 Fib) would be the first meaningful signal that this descending channel is being broken. Above there, the 0.618 Fib at 1.18238 is the next resistance target. On the downside, a return below 1.16660 (0.382 Fib) would negate the recovery and open a retest of the 1.16000 area and potentially the 0.236 Fib at 1.15658.
Key Fibonacci Levels: Resistance at 1.17450 (0.5 Fib), 1.18238 (0.618 Fib). Support at 1.16660 (0.382 Fib), 1.15658 (0.236 Fib), 1.14111 (Fib base / 0 level).
EUR/USD is staging a textbook Fibonacci retracement bounce from the 0.382 level. The strength of today’s candle (+0.86%) on the back of a clear fundamental catalyst (Iran ceasefire / DXY breakdown) gives the move credibility. However, the pair must clear the 0.5 Fib at 1.17450 on a daily close basis to confirm a genuine reversal. Until that level is broken, the dominant trend from February remains technically bearish. Buyers are best served entering on pullbacks toward 1.16700 with stops below the 0.382 Fib and taking profit at the 0.618 Fib at 1.18238 — a setup with approximately 1.9:1 risk-reward at current levels.
| Level | Price | Type | Significance |
|---|---|---|---|
| Fib 0.618 | 1.18238 | Resistance | Key Fibonacci retracement — major recovery target |
| Fib 0.5 | 1.17450 | Resistance | Midpoint retracement — critical bull confirmation level |
| Current Price | 1.16944 | — | Today’s close — above 0.382 Fib |
| Fib 0.382 | 1.16660 | Support | Bounce origin — key demand zone |
| Fib 0.236 | 1.15658 | Support | Secondary support — recent base of correction |
| Fib 0 (Base) | 1.14111 | Major Support | Fibonacci base — ultimate downside target if structure breaks |
EUR/USD has bounced from the 0.382 Fibonacci support at 1.16660 with a strong bullish daily candle supported by the DXY falling below 99. The setup targets the 0.618 Fib at 1.18238 — a 153-pip profit target against an 80-pip stop loss (R/R 1.9:1). Entry on a pullback to 1.16700 keeps the entry inside the support zone. Invalidation below 1.15900 (below the 0.236 Fib) confirms the recovery has failed. Watch for the 0.5 Fib at 1.17450 as a decision level — a daily close above it accelerates momentum to target.
Fundamental View
GBP/USD is today’s standout performer in the forex market, surging 1.13% as the combination of a weak dollar and risk-on conditions provides a powerful tailwind for sterling. The pound has historically been one of the most volatile of the G10 currencies in response to global risk sentiment shifts — given the UK’s twin current account and fiscal deficits, sterling tends to underperform in risk-off periods and outperform sharply when risk appetite returns. Today’s Iran ceasefire represents exactly that kind of catalyst, and GBP/USD has responded with a forceful reclaim of the 0.382 Fibonacci level.
The Bank of England is holding rates at 3.75%, with the MPC maintaining a data-dependent stance. UK inflation has been stickier than expected, and the UK’s trade exposure to US tariffs is limited compared to Germany and the EU, which gives GBP a relative advantage in the current forex market tariff environment. The UK–US trade deal framework that maintains a 10% reciprocal tariff cap provides certainty that other European nations lack. This fundamental backstop — combined with today’s risk-on catalyst — makes GBP/USD one of the strongest recovery candidates in the current cycle.
The primary risk for GBP/USD today remains the fragility of the ceasefire. Sterling’s twin deficits mean it would be a prime target for selling if geopolitical risk were to re-escalate overnight. Position sizing should reflect this asymmetric tail risk.
Technical Structure
The GBP/USD daily chart has produced a decisive bullish reversal candle. From the low of 1.32841 — testing the 0.236 Fibonacci retracement support zone at 1.33488 — the pair has surged to close at 1.34423. This represents a near full-range candle that has recaptured the 0.382 Fib level at 1.34344, a significant technical development after the pair spent several sessions below this level during its mid-March to early-April decline.
The recovery from the 0.236 Fib zone (1.33488) has been sharp and carries the hallmarks of a momentum-driven reversal rather than a mean-reversion bounce. The next key resistance is the 0.5 Fibonacci retracement at 1.35173, followed by the 0.618 level at 1.36002. A pullback to the 0.382 Fib (1.34344) before the next leg higher would represent a healthy consolidation and an ideal re-entry point. The descending channel from the February high at 1.38686 is the longer-term structure that bulls ultimately need to break to confirm a genuine trend reversal in the forex market.
Key Fibonacci Levels: Resistance at 1.35173 (0.5 Fib), 1.36002 (0.618 Fib), 1.37182 (0.786 Fib). Support at 1.34344 (0.382 Fib), 1.33488 (0.236 Fib), 1.31659 (Fib base / 0 level).
GBP/USD has produced the strongest single-session reversal of all four pairs covered in today’s report. The pair fell to test the 0.236 Fib support zone (1.33488) before reversing sharply and reclaiming the 0.382 Fib (1.34344) — a two-level recovery in a single session is a high-conviction bullish signal in Fibonacci analysis. The best setup in today’s forex market report is a pullback buy toward 1.34200 targeting the 0.618 Fib at 1.36002, with a stop below the 0.236 Fib support at 1.33200. The risk-reward is approximately 1.8:1 at current levels, improving if entry is achieved on a deeper pullback.
| Level | Price | Type | Significance |
|---|---|---|---|
| Fib 0.786 | 1.37182 | Resistance | High Fib level — secondary recovery target |
| Fib 0.618 | 1.36002 | Resistance | Key Fibonacci resistance — primary take-profit target |
| Fib 0.5 | 1.35173 | Resistance | Midpoint — intermediate resistance to clear |
| Current Price | 1.34423 | — | Today’s close — just above 0.382 Fib |
| Fib 0.382 | 1.34344 | Support | Reclaimed today — must hold on any pullback |
| Fib 0.236 | 1.33488 | Support | Bounce origin today — key demand zone |
| Fib 0 (Base) | 1.31659 | Major Support | Fibonacci base — ultimate downside risk level |
GBP/USD is today’s highest conviction setup in the forex market. The pair has reclaimed the 0.382 Fib after a clean bounce from the 0.236 Fib zone — a two-level recovery on a single risk-on catalyst carries strong momentum. Entry on a pullback to 1.34200 (just above the 0.382 Fib at 1.34344 offers a tight risk level) with a stop below the 0.236 Fib support at 1.33200. The target at the 0.618 Fib (1.36002) gives an 1.8:1 risk-reward. The ceasefire-driven reversal is the catalyst; the technical structure provides the framework. A daily close above 1.35173 (0.5 Fib) would significantly accelerate momentum toward the 0.618 target. R/R 1.8:1.
Fundamental View
NZD/USD has delivered the largest single-session gain of the four pairs covered today — up 2.01% — reflecting the kiwi’s status as one of the most risk-sensitive currencies in the G10 forex market. The New Zealand dollar is structurally a high-beta, risk-on currency that amplifies both global risk appetite recoveries and risk-off selloffs. Today’s Iran ceasefire announcement has triggered a sharp reversal from the multi-week lows near 0.57000, with the pair surging through multiple intraday resistance levels.
Fundamentally, NZD has been under structural pressure in recent months due to the RBNZ’s aggressive easing cycle — the central bank has cut rates by 3.25 percentage points since August 2024, the largest reduction by any G10 central bank in the current cycle. This rate differential headwind has been the primary reason NZD underperformed other G10 currencies even as the DXY declined in 2025. However, the RBNZ is approaching the end of its easing cycle as New Zealand growth stabilises. The 15% US tariff has had a limited impact on New Zealand’s total trade exposure — exports to non-US markets are growing at approximately 11% annually, with dairy and meat exports holding up well and China remaining a solid destination. This improving fundamental backdrop, combined with today’s risk-on catalyst, creates the conditions for a sustained NZD recovery.
Technical Structure
The NZD/USD daily chart shows a dramatic reversal from the lows near 0.57179 — just above the Fibonacci 0 base at 0.56777 — with the pair surging to close at 0.58460. This recovery has brought the pair back above the 0.382 Fibonacci retracement at 0.58380, which now acts as critical near-term support. The 0.236 Fib at 0.57752 provided an intraday support point during the session before the full reversal took hold.
The Fibonacci structure on NZD/USD shows the next key resistance at 0.5 Fib (0.58840), followed by the 0.618 Fib at 0.59330. A consolidation above the 0.382 Fib (0.58380) would be a constructive technical signal for further upside. The broader corrective structure from the February high at 0.60908 remains technically intact — to fully negate that structure, NZD/USD would need a daily close above the 0.618 Fib at 0.59330. Key downside risk: if price returns below 0.57500, the recovery loses credibility and the 0.56777 Fib base becomes the next test.
Key Fibonacci Levels: Resistance at 0.58840 (0.5 Fib), 0.59330 (0.618 Fib), 0.60024 (0.786 Fib). Support at 0.58380 (0.382 Fib), 0.57752 (0.236 Fib), 0.56777 (Fib base / 0 level).
NZD/USD’s 2% single-session surge is the most dramatic move in today’s forex market coverage. While the directional signal is clearly bullish, the pace of the move raises the possibility of a short-term pullback before the next leg higher. Technically, the pair needs to hold above the 0.382 Fib (0.58380) on any retracement to confirm the recovery is sustainable. The buy setup targets the 0.618 Fib at 0.59330 from a pullback entry near 0.58300, with a stop below the 0.57500 area. Risk-reward is approximately 1.3:1 given the proximity of entry to current price — a more patient entry on a deeper pullback would improve the ratio.
| Level | Price | Type | Significance |
|---|---|---|---|
| Fib 0.786 | 0.60024 | Resistance | Fibonacci high — secondary recovery target |
| Fib 0.618 | 0.59330 | Resistance | Primary upside target for recovery trade |
| Fib 0.5 | 0.58840 | Resistance | Intermediate resistance — consolidation zone |
| Current Price | 0.58460 | — | Today’s close — just above 0.382 Fib |
| Fib 0.382 | 0.58380 | Support | Reclaimed today — key near-term support |
| Fib 0.236 | 0.57752 | Support | Secondary support — intraday low zone |
| Fib 0 (Base) | 0.56777 | Major Support | Fibonacci base — ultimate downside level |
NZD/USD has surged 2.01% today — the largest single-session move in the pairs covered — from near the Fibonacci 0 base to above the 0.382 Fib (0.58380). The directional signal is clear: risk-on flows strongly favour the kiwi. Entry on a pullback to 0.58300 (inside the 0.382 Fib zone) targets the 0.618 Fib at 0.59330, with a stop below 0.57500 which would indicate the recovery has failed. R/R 1.3:1 at these levels. This is a lower conviction setup than EUR/USD and GBP/USD due to the RBNZ’s structural easing overhang and the pair’s proximity to the entry point after the large move. Patience on entry is key.
Fundamental View
USD/CAD is falling today as two forces converge against the US dollar side of the pair. First, the broad DXY weakness triggered by the Iran ceasefire and geopolitical premium unwind provides the headline driver. Second, the Canadian dollar benefits from risk-on conditions as a commodity-linked currency — with oil and broader commodity markets responding positively to the Strait of Hormuz reopening prospect, CAD is receiving a dual tailwind from both the dollar’s decline and the improvement in risk sentiment. The Bank of Canada has been navigating a challenging domestic environment, but the current risk-on shift in the global forex market overrides near-term BoC uncertainty as the primary driver.
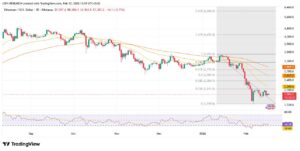
From a structural perspective, USD/CAD has been in a recovery phase since the pair bottomed near 1.34772 (the Fib 1 level / base) in January 2026. The pair rallied from that low through the Fibonacci retracement levels — briefly touching near the Fibonacci 0 level at 1.39619 before this week’s reversal. Today’s pullback to 1.38320 puts the pair back below the 0.236 Fib (1.38487) and testing the 0.382 Fib zone (1.37768). If the risk-on environment persists through the week, a full retracement to the 0.5 Fib at 1.37196 is the next logical target for USD/CAD bears in the current forex market.
Technical Structure
On the daily chart, USD/CAD has produced a bearish reversal candle from the 0.236 Fibonacci retracement resistance zone near 1.38487–1.39003. The pair tested this zone over several sessions before today’s rejection, and the current candle close at 1.38320 confirms that the 0.236 Fib is acting as a meaningful resistance ceiling. This structure is consistent with a classic Fibonacci resistance rejection, where the pair rallied into a key level and is now fading.
The next Fibonacci support levels below current price are the 0.382 Fib at 1.37768 (approximately 55 pips below), followed by the 0.5 Fib at 1.37196. A break below 1.37196 would represent a significant technical deterioration and open the path toward the 0.618 Fib at 1.36624. On the upside, a close above the 0.236 Fib at 1.38487 would neutralise the current sell setup and suggest the recovery from the January lows has resumed. Traders should watch the descending trendline from recent highs — price is currently trading below it, which adds bearish confluence.
Key Fibonacci Levels: Resistance at 1.38487 (0.236 Fib), 1.39619 (Fib 0 level / base). Support at 1.37768 (0.382 Fib), 1.37196 (0.5 Fib), 1.36624 (0.618 Fib), 1.35810 (0.786 Fib).
USD/CAD is presenting a clean sell setup from the 0.236 Fibonacci resistance rejection. The pair has stalled and reversed from the 1.38487–1.39003 zone on multiple sessions before today’s broader risk-off breakdown accelerated the move lower. The confluence of technical rejection at the 0.236 Fib, the broad DXY sell-off, and CAD’s positive correlation with risk-on flows makes this a well-supported bearish setup. The primary target is the 0.5 Fib at 1.37196. The sell setup offers approximately 1.9:1 risk-reward from current levels with entry at 1.38500 and stop above 1.39200.
| Level | Price | Type | Significance |
|---|---|---|---|
| Fib 0 (Base) | 1.39619 | Resistance | Fibonacci base — prior cycle high zone |
| Fib 0.236 | 1.38487 | Resistance | Rejected today — active resistance ceiling |
| Current Price | 1.38320 | — | Today’s close — below 0.236 Fib |
| Fib 0.382 | 1.37768 | Support | First downside target — key demand zone |
| Fib 0.5 | 1.37196 | Support | Primary take-profit level for sell setups |
| Fib 0.618 | 1.36624 | Support | Secondary target — major Fib support |
| Fib 1 (Range Low) | 1.34772 | Major Support | January 2026 base — cycle low |
USD/CAD has been rejected from the 0.236 Fibonacci resistance zone (1.38487) with a clean bearish daily candle. The setup sells any recovery toward 1.38500 — inside the 0.236 Fib resistance zone — targeting the 0.5 Fib at 1.37196 for a 130-pip gain against a 70-pip stop loss above 1.39200 (above the Fib 0 base resistance). R/R 1.9:1. The fundamental backdrop of USD weakness and CAD risk-on bid supports the directional bias. If the ceasefire holds and oil markets stabilise favourably for Canada, this setup could extend to the 0.618 Fib at 1.36624 for a higher-conviction target.
Execute Today’s Setups with Zero Slippage
High-volatility geopolitical catalysts — like today’s Iran ceasefire — can move pairs 100+ pips in minutes. Your entry and exit prices matter more than ever.
High & Medium Impact Events — April 8, 2026
| GMT Time | Currency | Event | Forecast | Previous | Actual | Impact |
|---|---|---|---|---|---|---|
| All Day | USD/ALL | Iran Ceasefire Negotiations Watch | — | — | Developing | HIGH |
| 09:00 | EUR | ECB Economic Bulletin | — | — | Pending | MEDIUM |
| 12:30 | CAD | Ivey PMI (March) | 54.0 | 55.3 | Pending | MEDIUM |
| 18:00 | USD | FOMC Meeting Minutes | — | — | Pending | HIGH |
| Thurs | NZD | RBNZ Rate Decision | 3.50% | 3.75% | Tomorrow | HIGH |
| Fri | USD | US CPI (MoM — March) | +0.3% | +0.2% | Friday | HIGH |
Traders’ Questions — April 8, 2026
Today’s Forex Market Conclusion — April 8, 2026
The forex market has undergone a decisive shift today. The Iran ceasefire announcement has catalysed a broad dollar sell-off that brought the DXY below 99 for the first time in four weeks, unwinding the geopolitical safe-haven premium that had kept USD elevated since the Strait of Hormuz closure. All four pairs covered in this report are moving against the dollar: EUR/USD bouncing from 0.382 Fib support, GBP/USD executing a two-level Fibonacci recovery, NZD/USD surging 2% from near the Fib base, and USD/CAD rejecting from its 0.236 Fib ceiling.
GBP/USD is the top setup, combining the clearest technical signal with the strongest fundamental backdrop — a Fibonacci reclaim of the 0.382 level from the 0.236 support zone, supported by a risk-on environment and the UK’s relatively tariff-protected position. EUR/USD offers a solid secondary buy from the 0.382 Fib bounce targeting 1.18238, and USD/CAD provides a clean sell from the 0.236 Fib rejection targeting 1.37196. NZD/USD’s 2% surge is notable but warrants patience on entry given the proximity to the large move and Thursday’s RBNZ meeting.
The critical caveat for all setups today is the inherent fragility of the ceasefire framework. The two-week window is a negotiating period, not a resolved settlement — any deterioration in talks would immediately restore safe-haven dollar flows and reverse today’s moves. Maintain defined risk levels as specified in each setup, and watch FOMC minutes (18:00 GMT today) and US CPI (Friday) as the next major catalysts.