Geopolitical Risk Alert — Elevated: US–Iran conflict continues. Strait of Hormuz disruption persists. WTI crude remains elevated (~$92). The US Dollar is drawing safe-haven inflows, pushing DXY to its strongest level since November 2025. Reduce position sizing by 30–50% and widen stops against normal volatility thresholds. US PCE + GDP + UoM data due today — expect high-volatility windows around 08:30–10:30 ET.
01
Top Market News — Last 10 Hours
GEO
US–Iran War: Strait of Hormuz Remains Disrupted. Iran’s new supreme leader Mojtaba Khamenei pledged to keep the Strait of Hormuz closed “out of necessity,” with Tehran intensifying attacks on regional oil and transport facilities. The US military has signalled it may tap foreign shipping capacity to ease a domestic energy crunch. Roughly 20% of globally traded oil passes through the Strait — this disruption is the single largest driver of current FX volatility, sustaining risk-off flows into the USD and JPY.
MACRO
DXY Surges to 99.81 — Highest Since November 2025. The Dollar Index extended gains for a fourth consecutive session, breaking above 99.5. Markets are pricing stronger inflation expectations driven by elevated oil, with the Fed now widely expected to hold rates at 3.50–3.75% at the March 17–18 FOMC. Markets are now pricing only one 25bp rate cut for all of 2026, likely in September — a significant hawkish repricing from earlier expectations of two to three cuts.
MACRO
US PCE + GDP + UoM Due Today (08:30–10:00 ET). The Personal Consumption Expenditures (PCE) Price Index for January 2026 drops today at 08:30 ET — the Fed’s preferred inflation gauge. Alongside it, the GDP Second Estimate for Q4/Full Year 2025 and the Flash University of Michigan Consumer Sentiment for March. These are the most market-moving data points of the week. A hot PCE reading would amplify USD strength and pressure EUR/USD toward 1.14; a soft reading could see a sharp short-covering rally to 1.16.
CB
BoE Repricing: Markets Now Pricing Rate HIKE by Year-End. In a dramatic shift over the past two weeks, BoE market expectations swung from three rate cuts in 2026 to a ~70% probability of a rate hike by December 2026 — a 100bp swing in policy expectations. MPC member Taylor previously warned of “deficient demand” risk, but PM Starmer’s hint at energy household support packages has complicated the outlook. This BoE hawkishness is keeping GBP/USD relatively supported versus pure dollar-strength rivals like AUD.
CB
ECB: Bullish EUR Positioning Has Softened. President Lagarde struck a cautious tone, confirming the ECB remains data-dependent with inflation expected to return to 2% in the medium term. Markets currently price ~38bp of tightening by year-end. However, CFTC positioning data shows bullish EUR speculative positioning has softened slightly from recent highs, leaving EUR/USD vulnerable to further downside if today’s US data comes in firm.
RISK
Oil Eases from Highs as IEA Proposes Reserve Release. WTI crude has pulled back from its March 9 spike high of ~$107.50 to the $88–93 range as the International Energy Agency proposed its largest-ever release of crude oil from strategic reserves (approximately 400 million barrels). This has reduced some safe-haven pressure and allowed EUR/USD to stage modest intraday bounces, though the fundamental bid in the USD remains dominant while Strait of Hormuz concerns persist.
MACRO
US Jobless Claims: 212K — In Line. Initial weekly jobless claims came in at 212,000 yesterday, broadly in line with prior readings and consistent with a resilient US labour market. This supports the Fed’s cautious stance. The US trade deficit in January also narrowed, providing a marginal tailwind for USD fundamentals. Markets now look to today’s JOLTS Job Openings data for further confirmation of labour market health.
GEO
China CPI/PPI Remain Deflationary — AUD Headwind. China’s February CPI printed at +0.5% year-on-year with PPI at −2.1%, signalling persistent deflationary pressure in the world’s second-largest economy. Given Australia’s deep export ties with China (~33% of exports), this keeps a structural ceiling on AUD/USD recovery. Combined with the current risk-off environment, AUD/USD remains the most vulnerable of the four major pairs to further downside today.
02
Economic Calendar — High-Impact Events, March 13, 2026
All times in GMT. Events rated HIGH impact only. Any significant deviation from consensus can move major pairs by 50–120 pips within the session. Today’s US data cluster is the heaviest risk event of the week.
Time GMT
Country
Event
Impact
Previous
Forecast
Pairs Affected
Trader Note
00:30
🇯🇵 Japan
Industrial Production (MoM, Jan Final)
MED
−0.4%
+0.3%
USD/JPY, JPY crosses
Soft print could push JPY weaker; limited near-term impact given geopolitical dominance
01:30
🇨🇳 China
Industrial Production (YoY, Feb)
HIGH
+5.1%
+4.8%
AUD/USD, NZD/USD, risk tone
China data miss amplifies AUD/USD downside; beat could trigger short-covering bounce
01:30
🇨🇳 China
Retail Sales (YoY, Feb)
HIGH
+3.7%
+3.5%
AUD/USD, risk sentiment
Watch for composite China read alongside IP — both together define the China risk-pulse
07:00
🇬🇧 UK
GDP MoM (January)
HIGH
+0.1%
+0.2%
GBP/USD, EUR/GBP
A positive surprise supports the BoE hawkish re-pricing; miss could drag GBP toward 1.3253
07:00
🇬🇧 UK
Industrial & Manufacturing Production (Jan)
HIGH
−0.2%
+0.1%
GBP/USD
Companion release to GDP; soft pair = double GBP-negative
07:00
🇬🇧 UK
Trade Balance (January)
MED
−£19.0B
−£18.5B
GBP/USD
Narrowing deficit = mild GBP support; market focus remains on GDP headline
13:30
🇺🇸 USA
PCE Price Index MoM & YoY (January) ⭐
HIGH
+0.3% / +2.6%
+0.3% / +2.7%
ALL USD pairs
Key event of the day. Hot PCE → USD rallies, EUR/USD → 1.14. Soft PCE → broad USD pullback, EUR/USD → 1.16
13:30
🇺🇸 USA
Core PCE Price Index MoM & YoY (Jan) ⭐
HIGH
+0.2% / +2.8%
+0.3% / +2.8%
ALL USD pairs
Core PCE is the Fed’s primary inflation watch. Stickiness here locks in September as earliest cut
Labour market resilience metric; holds importance ahead of March FOMC next week
— Ongoing
🇦🇺 Australia
RBA Policy Stance — No Meeting, Data-Watch Week
MED
4.10%
—
AUD/USD
RBA easing cycle ongoing. Next decision April 1. China data today more relevant for AUD than RBA
— Ongoing
🇯🇵 Japan
BoJ Policy — Gradual Normalisation in Progress
MED
0.75%
—
USD/JPY, JPY crosses
BoJ hiked 25bp in Dec 2025. Intervention risk zone remains 160.00 on USD/JPY
⚡ High-Volatility Windows Today: 07:00 GMT (UK GDP cluster) & 13:30–15:00 GMT (US PCE + GDP + UoM). These windows can generate 50–120 pip moves in under 20 minutes. Avoid entering new positions 10 minutes before any HIGH-impact release unless your strategy specifically trades news.
03
Central Bank Policy Watch
🇺🇸 Federal Reserve (Fed)
3.50 – 3.75%
On hold. FOMC March 17–18 — no change expected. Focus will be on the updated dot plot and Powell’s tone. Markets pricing just 1 cut in 2026 (September). Stagflation risk from elevated oil complicates the picture. Hot PCE today could delay even that solitary cut.
🇪🇺 European Central Bank (ECB)
~2.75%
Cautious data-dependent stance. Markets price ~38bp tightening by year-end. Inflation near target. Germany’s €1T fiscal package supports Eurozone growth. ECB unlikely to move at March meeting. ECB rate support is a floor for EUR — but US data today is the dominant driver.
🇬🇧 Bank of England (BoE)
~4.50%
Dramatic hawkish repricing in 2 weeks: from 3 expected cuts to 70% probability of a hike by year-end. BoE Gov. Bailey spoke Thursday. Energy support package risk from PM Starmer could complicate fiscal-monetary interaction and weigh on GBP if bonds sell off.
🇯🇵 Bank of Japan (BoJ)
0.75%
Hiked 25bp in December 2025 — its second hike since 2007. JGB tapering continues. Gradual normalisation. JPY remains structurally weak due to PM Takaichi’s expansionary fiscal policy creating fiscal credibility concerns. Intervention risk is active above 160.00.
🇦🇺 Reserve Bank of Australia (RBA)
4.10%
Easing cycle underway. Next meeting April 1. Potential for further cuts if inflation sustainably returns to the 2–3% target band. China’s deflationary signal from this week’s CPI/PPI data is a headwind to AUD recovery and may accelerate the RBA’s easing timeline.
🇨🇳 People’s Bank of China (PBoC)
3.10% LPR
Accommodative stance. CPI at +0.5% YoY and PPI at −2.1% YoY (Feb) signal persistent deflationary pressure. PBoC has scope to ease further. CNY managed — not directly tradeable but China economic data today is the primary driver for AUD/USD and commodity-linked FX.
04
Market Snapshot — Friday, 13 March 2026
EUR/USD
1.1492
▼ −0.61% (−70 pips)
● Bearish
GBP/USD
1.3360
▼ −0.31% (−42 pips)
● Mildly Bearish
USD/JPY
157.84
▲ +0.42% (+66 pips)
● Bullish
AUD/USD
0.6218
▼ −0.55% (−34 pips)
● Bearish
DXY
99.81
▲ +0.09% | 2-month high
WTI Crude
$92.40
▲ +1.2% | Strait risk
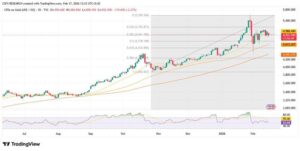
Gold (XAU)
$5,127
▲ +0.3% | Safe haven
Risk Sentiment
RISK-OFF
Iran war premium
Fed Rate
3.50–3.75%
FOMC: Mar 17–18
Overall Geopolitical Risk
HIGH — 85%
USD Strength Conviction
HIGH — 78%
EUR Recovery Probability (24hr)
LOW — 25%
05
EUR/USD — Technical Analysis & Trade Setup
The euro has been under sustained selling pressure since failing to consolidate above the 1.22 resistance level earlier in Q1 2026. Last week the pair broke below the critical Target Zone at 1.1628–1.1650, confirming a medium-term bearish shift. As of this morning, EUR/USD is trading near 1.1492 — the lowest print since late January — and the macro backdrop offers little reason for bulls to mount a significant comeback until after today’s US PCE release.
Bearish EngulfingThree Black CrowsShooting Star (W-close)
The daily chart printed a Bearish Engulfing at 1.1650 resistance last Tuesday, followed by two more bearish closes forming a Three Black Crows pattern — classically one of the most reliable reversal formations. This confirmed the rejection from the upper boundary of the prior ascending channel. A Shooting Star printed on the weekly close, adding confluence. No bullish reversal signal is present on either the daily or 4H charts at this time.
Preferred Trade Setup — EUR/USDSELL / SHORT
Entry Zone
1.1540 – 1.1560
Stop Loss
1.1640
Target 1 / Target 2
1.1440 / 1.1350
Risk : Reward
1 : 1.8 / 1 : 2.6
Rationale: Wait for a retracement into the former support-turned-resistance at 1.1540–1.1560 (aligns with broken Target Zone and declining 9-EMA) before entering short. Stop above the 1.1640 swing high. TP1 at 1.1440 (intraday support confluence), TP2 at 1.1350 (weekly pivot). Invalidation: A daily close above 1.1650 on strong volume would signal bearish thesis failure — exit and reassess. Note: Avoid entry in the 30 minutes surrounding the 13:30 GMT PCE release.
06
GBP/USD — Technical Analysis & Trade Setup
Cable is extending its losing streak into a third consecutive session, trading around 1.3360. The near-term bias is mildly bearish — price sits below both the declining 9-day EMA and the flatter 50-day EMA, and the rejection from the mid-1.36s has been decisive. However, GBP/USD is showing relative strength against EUR/USD and AUD/USD thanks to the dramatic BoE hawkish repricing. Today’s UK GDP data (07:00 GMT) will be a key catalyst: a beat could support GBP to the 1.3420 zone, while a miss accelerates the downmove.
GBP/USD printed a Dark Cloud Cover at the channel resistance near 1.3485, a two-candle bearish reversal that set the tone for the current decline. A subsequent Bearish Harami on the following session confirmed indecision at resistance has resolved to the downside. RSI at ~38 shows persistent selling pressure without being oversold — meaning sellers still have room to push lower before any meaningful bounce is expected. The pattern of lower daily highs is the clearest technical signal.
Preferred Trade Setup — GBP/USDSELL / SHORT
Entry Zone
1.3390 – 1.3420
Stop Loss
1.3490
Target 1 / Target 2
1.3300 / 1.3253
Risk : Reward
1 : 1.3 / 1 : 1.9
Rationale: Enter short on a pullback into the 1.3390–1.3420 zone, which aligns with the declining 9-EMA and the channel lower boundary. Stop placed above the recent swing high at 1.3490. TP1 at the 1.3300 psychological level; TP2 at the December 3 three-month low of 1.3253. UK GDP release at 07:00 GMT is a binary event — if GDP prints +0.3% or above, the short thesis weakens and 1.3420 resistance becomes more robust. Consider waiting for GDP before entering. Invalidation: Daily close above 1.3490.
07
USD/JPY — Technical Analysis & Trade Setup
USD/JPY is the standout bullish pair of the session. The pair has surged from the 155.00 zone to test 157.84 on a combination of safe-haven USD demand (Iran war), JPY structural weakness under PM Takaichi’s expansionary fiscal program, and oil-driven import cost concerns that widen Japan’s current account deficit. The structure of higher highs and higher lows on the daily chart is intact. The critical 160.00 intervention zone looms above, but the current geopolitical premium gives the pair a genuine pathway toward it.
Bullish MarubozuThree White SoldiersPiercing Line (4H)
Following the initial Iran-shock volatility, USD/JPY printed a Bullish Marubozu — a full-bodied bull candle with minimal upper/lower wicks — signalling decisive buyer control. This was immediately followed by two more bullish sessions forming a textbook Three White Soldiers pattern: classically the most powerful bullish continuation signal. On the 4H chart, a Piercing Line formed at the 156.27 launch zone, now acting as the base of the current rally. Bulls are clearly in full control.
Preferred Trade Setup — USD/JPYBUY / LONG
Entry Zone
156.80 – 157.20
Stop Loss
155.80
Target 1 / Target 2
158.80 / 159.80
Risk : Reward
1 : 1.6 / 1 : 2.6
Rationale: Look to buy pullbacks into the 156.80–157.20 zone (prior resistance turned support, 9-EMA on 4H). Stop below 155.80 to clear the prior launch zone at 156.27. TP1 at 158.80, TP2 at 159.80 (approaching the critical 160.00 level — close or trail before that zone). ⚠ Intervention risk: Any USD/JPY print approaching 159.50–160.00 elevates Japanese government intervention probability significantly. Either take profits or tighten stops aggressively near 159.50. Do NOT hold through 160.00 without a defined exit.
08
AUD/USD — Technical Analysis & Trade Setup
AUD/USD is the most vulnerable of the four pairs in today’s risk-off environment. The Australian dollar is caught in a triple headwind: a broadly stronger USD, a risk-off market driven by the Iran war, and China’s deflationary economic data. Trading around 0.6218, the pair is consolidating near its 200-day EMA but shows no technical reversal signal. RSI at ~47–48 suggests the pair has further room to fall before becoming technically oversold. However, CFTC speculative positioning remains net-long AUD — the largest since 2017 — which creates a risk of a sharp short-covering rally if China data surprises to the upside today.
Evening Star (Weekly)Bearish Spinning TopInside Bar (indecision)
The weekly chart shows an Evening Star pattern — a three-candle reversal where a bullish candle is followed by a spinning top and then a decisive bearish close. This is a classic top-formation signal. On the daily timeframe, a Bearish Spinning Top near 0.6280 resistance showed seller indecision turning to control. An Inside Bar consolidated the range before the current downleg. No bullish reversal pattern is visible — the path of least resistance remains lower while 0.6180 holds as support.
Preferred Trade Setup — AUD/USDSELL / SHORT
Entry Zone
0.6250 – 0.6280
Stop Loss
0.6330
Target 1 / Target 2
0.6180 / 0.6100
Risk : Reward
1 : 1.4 / 1 : 2.3
Rationale: Sell rallies into the 0.6250–0.6280 resistance zone, which aligns with the prior support-now-resistance and the 50-day EMA. Stop above 0.6330 to clear the recent swing high. TP1 at the 200-day EMA (0.6180); TP2 at 0.6100. Key wildcard: China Industrial Production and Retail Sales (01:30 GMT) — a strong China beat can trigger an aggressive AUD short squeeze back to 0.6280+. If China data is strong, this short entry should be delayed or sized conservatively. Conversely, a China miss accelerates the downmove toward TP1 without needing the pullback entry.
Trade Setup Summary — All Four Pairs
Pair
Bias
Entry Zone
Stop Loss
Target 1
Target 2
R:R (T1)
Trigger / Key Risk
EUR/USD
SHORT
1.1540–1.1560
1.1640
1.1440
1.1350
1 : 1.8
PCE data; avoid entering 30 min before 13:30 GMT
GBP/USD
SHORT
1.3390–1.3420
1.3490
1.3300
1.3253
1 : 1.3
UK GDP 07:00 GMT — wait for print before entering
USD/JPY
LONG
156.80–157.20
155.80
158.80
159.80
1 : 1.6
Intervention risk at 160.00 — close/trail near 159.50
AUD/USD
SHORT
0.6250–0.6280
0.6330
0.6180
0.6100
1 : 1.4
China data 01:30 GMT — strong beat delays/negates short
Position Sizing Reminder: Given elevated geopolitical volatility and today’s major US data cluster, use 30–50% of your normal position size across all setups. Geopolitical headline risk can generate 50–80 pip spikes in under 60 seconds. Wider stops are necessary — but this also means these setups are best suited to swing traders with a 1–3 day horizon, not intraday scalpers operating right around news releases.
09
Frequently Asked Questions (FAQ)
Why is the US Dollar so strong today despite earlier weakness in 2026?
The dollar’s broad weakness from H2 2025 was driven by Fed rate-cut expectations and improving global growth. However, the outbreak of the US–Iran war and the closure of the Strait of Hormuz have fundamentally altered the near-term playbook. Safe-haven demand has flooded back into the USD, while the oil price surge has rekindled inflation expectations — pushing back the timeline for Fed rate cuts and driving the DXY to its highest level since November 2025. This is a classic “risk-off + inflation shock” regime that tends to favour the dollar even against structural bearish forecasts.
Why is USD/JPY rising if the Yen is also a safe-haven currency?
Historically, both USD and JPY attract safe-haven flows simultaneously. However, Japan imports approximately 90% of its oil — largely through Strait of Hormuz-dependent routes. The oil price surge directly widens Japan’s current account deficit, creating fundamental JPY selling pressure that is overriding any generic safe-haven buying. Additionally, PM Takaichi’s expansionary fiscal policy has undermined long-term BoJ credibility on inflation normalisation, further structurally weakening the yen. This combination means USD/JPY is rising despite the flight-to-safety environment — a nuance that catches many traders off-guard.
What will PCE data released today actually mean for forex markets?
PCE (Personal Consumption Expenditures) is the Federal Reserve’s preferred inflation gauge. A hotter-than-expected reading today (e.g., Core PCE MoM above +0.3%) would reinforce the narrative that inflation is sticky and that the Fed has no room to cut rates — even with one cut already priced for September 2026. This would push the DXY higher, EUR/USD lower toward 1.14, and further stress AUD/USD. Conversely, a soft PCE (Core below +0.2% MoM) could trigger a sharp short-covering rally in EUR and GBP, as traders reassess the Fed’s flexibility. Today’s PCE lands just five days before the March FOMC, giving it outsized market impact.
Why is GBP/USD falling when the Bank of England is becoming more hawkish?
This is one of the more nuanced FX dynamics right now. The BoE hawkish repricing is genuine — a 100bp swing in expected policy direction is remarkable. However, GBP/USD also depends on the USD side of the equation, and the USD’s current geopolitical safe-haven premium is overwhelming the GBP hawkish support. The net result is that GBP is falling against USD (as the dollar surges), but outperforming against EUR, AUD, and other non-safe-haven currencies. Experienced traders should track GBP/JPY and EUR/GBP alongside GBP/USD to get a cleaner read on pure sterling strength.
What level on USD/JPY would trigger Japanese government intervention?
The 160.00 level on USD/JPY has historically been a line-in-the-sand for Japan’s Finance Ministry. The intervention episode of July 2024 was triggered in this zone, and subsequent comments from officials have reaffirmed it as a threshold of concern. Trading significantly above 159.50 without any BoJ/Finance Ministry warnings would be unusual. Active traders should monitor the Japanese verbal intervention ladder: first come “concerned about excessive moves,” then “taking decisive action if necessary,” and finally coordinated action. At current levels of 157.84, the market is approaching the early-warning zone. Position accordingly.
Is AUD/USD a buy given China’s recovery narrative for 2026?
Structurally, the AUD/USD bull case for 2026 is real — CFTC data shows speculative net-long positioning in AUD at its highest since 2017, reflecting institutional conviction in the China recovery and commodity cycle. However, today is not that trade. China’s latest CPI and PPI data (Feb 2026) continue to show deflationary pressure, and the current risk-off environment suppresses commodity demand. The structural long AUD/USD thesis remains valid for medium-term positioning (Q2–Q3 2026) but requires patience. Short-term traders should respect the current bearish momentum rather than fighting the near-term trend with early structural longs.
What’s the key level to watch in EUR/USD for the next 24 hours?
The 1.1450 level is the most critical floor in the immediate 24-hour window. A break and daily close below 1.1450 would expose the 1.1350 zone and then the 1.1200 psychological support. On the upside, 1.1560 (former support now resistance, aligned with the declining 9-EMA) is the first meaningful hurdle for any recovery. A move and daily close above 1.1650 — the broken Target Zone — would be needed to genuinely neutralise the current bearish thesis. Given today’s data calendar and geopolitical backdrop, sustained EUR recovery above 1.1560 looks unlikely unless PCE comes in materially soft.
Conclusion — Forex Market Outlook, March 13, 2026
Today’s forex market operates under two dominant themes that are reinforcing each other in a way rarely seen outside of genuine macro shock environments: geopolitical safe-haven USD demand (US–Iran war, Strait of Hormuz closure) and re-accelerating US inflation expectations driven by the oil price surge. Together, these have pushed the DXY to its strongest level since November 2025 and imposed a clean bearish regime on most major pairs against the dollar.
Among the four pairs covered today, USD/JPY is the clearest directional opportunity — the Three White Soldiers pattern, intact higher-high/higher-low structure, and the unique Japan current-account deterioration story all align on the bullish side. The critical discipline here is respect for the 160.00 intervention zone. EUR/USD and AUD/USD both offer short setups with clear technical confluences, though both require patience around the 13:30 GMT US data window. GBP/USD’s relative resilience from BoE hawkishness makes it the least attractive short candidate of the three — but the direction remains lower as long as DXY holds above 99.50.
The next 24 hours are dominated by today’s PCE release and early Monday’s follow-through into the FOMC week. Any trader who navigates the PCE window cleanly — by waiting for the dust to settle before entering rather than anticipating the direction — will be far better positioned than those chasing the initial spike. As always, in elevated volatility environments: smaller size, clearer levels, disciplined exits.
Next scheduled full briefing: Monday, March 16, 2026 — FOMC Week Preview Edition. Watch for real-time intraday updates on PCE and UK GDP reaction.