Global Index Market Analysis – March 10, 2026 | Nasdaq 100 · S&P 500 · DAX 40

Markets Hold Their Breath: CPI Eve, Oil Retreat and the Battle for Key Technical Levels
U.S. equities entered Tuesday under pressure as Wall Street’s Monday relief rally fades into pre-CPI caution. With February inflation data dropping Wednesday at 8:30 AM ET, oil prices stabilising near $90, and geopolitical uncertainty over Iran lingering, every major index sits at a pivotal technical crossroads. Here is your full actionable breakdown.
Live Market Snapshot
Key index and macro readings as of Tuesday March 10, 2026 – US pre-market / European session open.
What’s Driving Markets Right Now
Four interconnected forces are shaping price action across all three indices today. Understanding their interplay is essential before placing any directional trade.
Iran War & Oil Shock
The US-Israeli military campaign against Iran triggered a historic oil spike last week — WTI surged over 35% to nearly $120 per barrel, its biggest single-week move since futures trading began in 1983. The Strait of Hormuz closure sent energy markets into panic. President Trump’s comments on Sunday that the war is “very complete, pretty much” sparked Monday’s relief rally, but oil remains near $90 — still elevated. Any reversal in ceasefire hopes will instantly re-price risk assets lower.
February CPI — Tomorrow’s Flash Point
The single most important scheduled event for the next 24 hours is Wednesday’s February CPI release (8:30 AM ET, March 11). January CPI came in at +2.4% YoY. Markets fear that rising oil prices may have already bled into February’s data. A surprise print above 2.6% would likely crush any recovery rally. A softer reading could be the catalyst bulls need. All three indices are essentially “frozen” ahead of this release.
AI & Tech Earnings Cycle
Oracle reports earnings Tuesday after the close — a key bellwether for enterprise AI spending. Monday’s tech-led recovery (+1.38% Nasdaq) was driven by semiconductors: AMD, Broadcom, and Nvidia all rallied 2–5%. The AI investment thesis remains intact structurally, but near-term earnings expectations must clear the bar. Adobe follows on Thursday, providing another read on software demand.
Fed Policy Uncertainty
Geopolitical stagflation risk has complicated Fed communications. Markets had been pricing rate cuts in mid-2026 before the Iran conflict raised oil-driven inflation fears. The surprise February payroll decline of −92,000 (reported Friday, March 6) pointed toward a weakening labour market, while oil threatens higher inflation — a difficult combination. The FOMC’s next meeting on March 18–19 (post-ECB quiet period) is now highly uncertain.
Economic Events: Next 24–72 Hours
Filtered for high-impact releases from the USA, UK, Europe, Japan, Australia, and China only. These events have direct market-moving potential for the three indices covered in this report.
| Date & Time (ET) | Country | Event | Impact | Forecast | Previous | Index Relevance |
|---|---|---|---|---|---|---|
| Mon Mar 10 Already out |
🇨🇳 China | CPI (February) Consumer inflation – Lunar New Year effects |
HIGH | +0.4–0.5% YoY | +0.2% YoY | DAX, global risk |
| Mon Mar 10 Released |
🇨🇳 China | PPI (February) Factory gate deflation — 40th consecutive negative month expected |
MEDIUM | −1.3% YoY | −1.4% YoY | DAX, industrials |
| Tue Mar 10 07:30 ET |
🇩🇪 Germany | Trade Balance & Industrial Production (Jan) PMI data indicated best reviving pace in ~4 years |
HIGH | — | — | DAX 40 direct |
| Tue Mar 10 Post-close |
🇺🇸 USA | Oracle Earnings (Q3 FY2026) Enterprise AI software bellwether |
HIGH | EPS est. ~$1.72 | — | Nasdaq 100, S&P 500 |
| Wed Mar 11 08:30 ET ⚡ |
🇺🇸 USA | CPI – February 2026 Most critical scheduled release of the week |
EXTREME | ~2.5% YoY | 2.4% YoY | ALL THREE INDICES |
| Wed Mar 11 08:30 ET |
🇺🇸 USA | Core CPI (ex-food & energy) Fed’s preferred inflation gauge for rate decisions |
HIGH | ~3.1% YoY | 3.0% YoY | ALL THREE INDICES |
| Wed Mar 11 15:00 ET |
🇺🇸 USA | Monthly Budget Statement (February) | MEDIUM | — | — | Bonds, risk sentiment |
| Tue Mar 10 19:50 ET |
🇯🇵 Japan | GDP Q4 2025 (Final Revision) Expected: modest growth; BOJ rate path implications |
HIGH | +0.4% QoQ | −0.2% QoQ | Global risk, Nikkei |
| Tue Mar 10 — |
🇦🇺 Australia | Westpac Consumer Confidence (March) Key read on domestic demand + RBA outlook |
MEDIUM | — | — | Risk sentiment |
| Fri Mar 13 02:00 ET |
🇬🇧 UK | GDP (January 2026) PMI surveys signalled a pickup; BOE rate cut implications |
HIGH | +0.1% MoM | +0.1% MoM | FTSE, DAX, EUR/GBP |
| Fri Mar 13 08:30 ET |
🇺🇸 USA | PCE Price Index (January) + GDP 2nd Est. Q4 Fed’s core inflation metric + growth revision |
HIGH | PCE ~2.5% YoY | 2.4% YoY | ALL THREE INDICES |
Nasdaq 100 (NDX) — Full Technical Analysis

The Nasdaq 100 was already printing a descending triangle breakdown from its January 2026 all-time high of ~26,054 when the Iran war accelerated the sell-off. The 200-day moving average (~24,100) has been decisively breached. Monday’s tech recovery was encouraging but structurally insufficient to flip the trend. The index has now broken below the floor of its medium-term rising channel, signalling a deceleration of the bull case at minimum.
S&P 500 (SPX) — Full Technical Analysis

The S&P 500 hit its all-time high above 7,002 in late 2025 before pulling back through Q1 2026. The 200-day moving average sits near 6,582 — a level not broken since May 2025. A confirmed daily close below this level would be a major technical breakdown signal, opening the door to the 6,400–6,450 zone. Monday’s recovery to 6,795 was impressive but Tuesday’s reversal shows the bears remain in control heading into CPI.
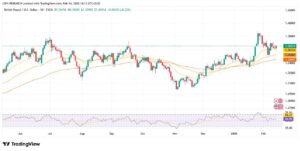
DAX 40 (GDAXI) — Full Technical Analysis

The DAX suffered its sharpest Iran-war correction of any major global index — falling from its January 13 all-time high of 25,507 to a low of 22,928, a drawdown of over 10%. The 50-day MA (~24,900) and 100-day MA (~24,732) are now firmly overhead resistance. The 200-day MA and the critical 23,488 level are the final supports before potential acceleration to 22,934. Critically, the long-term bull case driven by Germany’s €500 billion Sondervermögen investment programme and ECB easing capacity remains structurally intact.
Candlestick Patterns — March 9–10, 2026
Candlestick patterns layer contextual intelligence on top of structural indicators. Here are the most significant formations observed across the three indices over the last two sessions.
| Index | Pattern (Mon–Tue) | Signal | Reliability | Confirmation Required |
|---|---|---|---|---|
| Nasdaq 100 | Bullish Engulfing (Mon) + Gap Down (Tue) | Neutral | Low — failed to confirm | Close above 22,300 on volume >avg |
| S&P 500 | Hammer (Mon) + Indecision Doji (Tue) | Neutral | Medium — awaits CPI catalyst | Bullish close above 6,760 post-CPI |
| DAX 40 | Inside Bar at oversold support (Tue) | Bearish lean | Medium-High — deep RSI oversold | Hold above 23,000; break below = sell |
Consolidated Trade Setups — March 10, 2026
| Index | Bias | Setup Type | Entry Zone | Stop Loss | Target 1 | Target 2 | R:R Ratio | Pre-CPI Risk |
|---|---|---|---|---|---|---|---|---|
| Nasdaq 100 | Bearish | Fade rally into resistance | 22,100–22,300 | 22,700 | 21,400 | 21,000 | ~1:2.5 | Very High |
| S&P 500 | Bearish | Short on 200-DMA rejection | 6,720–6,760 | 6,820 | 6,550 | 6,450 | ~1:2 | Very High |
| DAX 40 | Bullish (LT) | Accumulate dip at key support | 23,000–23,200 | 22,700 | 24,200 | 25,000 | ~1:3 | Medium |
Expert Q&A for Active Index Traders
The Bottom Line for March 10–11, 2026
Patience Over Precision: Let the CPI Print Do the Work
Tuesday is, without question, a pre-event positioning day. Every serious index trader should recognise that the most important price discovery of the entire week will occur tomorrow morning at 8:30 AM ET when the Bureau of Labor Statistics releases February’s CPI data. With oil having surged 35% last week, a jobs report that printed a surprise −92,000, and geopolitical uncertainty still alive despite President Trump’s optimistic Iran comments, the macro backdrop is unusually complex.
Technically, all three indices are under pressure. The Nasdaq 100 remains structurally the most damaged — a broken 200-day MA, descending triangle, and the highest sensitivity to rate expectations make it the most vulnerable to a hot CPI print. The S&P 500 is testing its 200-day moving average at 6,582 — a level that must hold to preserve the long-term bull narrative — while Monday’s hammer candle offers a faint technical lifeline. The DAX 40 presents the paradox of the session: the most technically damaged in the short term, yet the best risk-reward opportunity for the medium term, thanks to deeply oversold RSI readings, robust structural support from Germany’s fiscal bazooka, and ECB flexibility.
The professional trade today is restraint. Reduce leverage, respect your stops, and let the CPI data print set the stage for your next directional trade. Those who manage risk through Wednesday’s data release will be in the strongest position to capitalise on whichever direction the market ultimately decides to move.