Capital Street FX | Index Market Report — Nasdaq 100, S&P 500, FTSE 100 | April 1, 2026
Iran De-escalation Fuels Sharp Relief Bounce
Global equity markets are staging their most significant single-session rally since May 2026, driven by a rapid reassessment of geopolitical risk following President Trump’s declaration on Tuesday that US forces will exit Iran “in two or three weeks, whether we have a deal or not.” The Nasdaq 100 is gaining +3.43%, the S&P 500 +2.91%, and the FTSE 100 +1.80%, as Brent crude retreats sharply from its recent $118 peak toward the $100 level. A planned presidential address to the nation at 21:00 ET tonight on the Iran situation is the single most critical catalyst for all three indices in the near term, with markets pricing a significant probability of de-escalation confirmation — and carrying substantial reversal risk if the message disappoints.
Prices sourced from TradingView and Yahoo Finance. Snapshot as of approximately 13:30 GMT, 1 April 2026. 52-week ranges reflect chart data from uploaded CSFX-Research TradingView charts.
The defining macro narrative for global equities in April 2026 remains the five-week-old US-Iran war, which has acted as the primary driver of volatility across all three indices covered in this report. Wall Street posted its best single-session performance since May on March 31 after the Wall Street Journal reported that President Trump had told aides he was willing to end the military campaign against Iran even if the Strait of Hormuz remained largely closed. The S&P 500 surged 2.9% and the Nasdaq Composite jumped 3.8% in that session, representing a recovery of roughly 30% of the total drawdown since hostilities began.
On Tuesday April 1, Trump went further during a White House press gaggle, stating the US would “probably” halt attacks within two to three weeks “whether we have a deal or not,” while simultaneously suggesting allied nations should “build up some delayed courage” and take responsibility for reopening the strait. The White House also confirmed a prime-time presidential address to the nation at 21:00 ET Wednesday, billed as delivering an “important update on Iran.” Markets have treated this as the single largest near-term catalyst for directional movement.
Iran’s position, however, remains complex. Tehran’s foreign ministry spokesperson publicly stated there have been no direct negotiations in 31 days of war — only messages passed via intermediaries including Pakistan and China. Iran previously rejected a 15-point US ceasefire proposal that demanded nuclear dismantlement, cessation of proxy funding, and Strait of Hormuz reopening, counter-proposing reparations and sovereignty guarantees. Trump paused energy plant strikes until April 6 pending Tehran’s formal response. The April 6 deadline now looms as the critical binary event: escalation resumes, or a de-escalation framework takes shape.
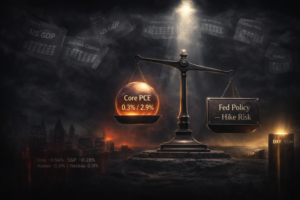
The Federal Reserve held its benchmark rate steady at 3.6% at its most recent meeting, marking the second consecutive hold. Chair Jerome Powell’s Summary of Economic Projections maintained a median forecast of one rate cut in 2026, unchanged from December’s projection, signalling that the central bank is not inclined to respond to the oil shock from the Iran war with additional tightening. At Harvard University on March 30, Powell stated clearly that rates are “in a good place” and that it would be inappropriate to hike in response to an energy price shock that is likely temporary in nature. Following those remarks, market pricing of a rate hike by December 2026 collapsed from above 50% to just 2.2%.
The broader picture for US data has deteriorated in Q1 2026. Job creation has slowed significantly, with Powell himself acknowledging “essentially zero” net job creation in recent months. Today’s ADP Nonfarm Employment Change for March came in at 62,000, above the 41,000 consensus, offering a slightly more constructive labour market signal ahead of Friday’s official NFP release. ISM Manufacturing PMI data due at 14:00 GMT today, with consensus at 52.3 against a prior of 52.4, will provide further texture on whether the real economy is weathering the energy shock or beginning to contract.
Powell’s term as Fed Chair expires May 15 and his nominated successor Kevin Warsh has yet to be confirmed in the Senate, partly due to the political distraction of the DOJ investigation into Powell’s renovation testimony. A resolution of the Iran war would likely lift the fog of uncertainty over the Fed’s next move and allow rate cut pricing to re-emerge more forcefully, a structural positive for both the S&P 500 and Nasdaq 100.
The Bank of England held interest rates at 3.75% at its most recent monetary policy meeting, a decision that landed in line with consensus but against the backdrop of elevated energy-driven inflation that continues to complicate the UK’s disinflation narrative. The decision sent the FTSE 100 down 2% in the immediate aftermath, as markets had been tentatively pricing in the possibility of a more dovish pivot signal. The pound rose 0.2% against the dollar following the hold, reflecting the view that the BoE remains cautious about cutting into an inflationary environment.
The UK economy faces a distinct set of pressures compared to the US. As a major net energy importer, higher Brent crude prices disproportionately weigh on UK household energy costs and corporate margins within energy-intensive FTSE 100 sectors. The recent surge in oil above $110 — caused directly by the closure of the Strait of Hormuz — compressed real disposable incomes and stoked concern about services inflation remaining sticky. A credible Iran de-escalation, which is what today’s presidential address is expected to deliver, would represent a significant disinflationary tailwind for the UK and could allow the BoE to signal earlier cuts at its next meeting.
The FTSE 100’s composition also provides it with a degree of structural insulation not available to US indices. Its heavy weighting in energy producers (Shell, BP), commodity majors, and defensives means the index tends to be a partial beneficiary when oil prices rise — but it also means the current rally, driven by falling crude prices, carries more nuance. Sectors like travel, housebuilding, and consumer discretionary are the primary gainers from today’s de-escalation trade, while energy components may give back some recent gains as oil retreats.
The energy market is at the centre of every macro calculation in April 2026. Brent crude surged more than 50% in a single month as the US-Iran conflict effectively closed the Strait of Hormuz, through which approximately 20% of global oil supply transits. At its peak, Brent reached approximately $118 per barrel — its highest close since June 2022. BlackRock CEO Larry Fink warned this week that oil could reach $150 and trigger a global recession if the Strait remains closed after the war ends. Oxford Economics cut its global industrial growth forecast to 2.5% for 2026, citing severe cost spikes in energy-intensive sectors.
The sharp reversal in crude on April 1 — with Brent dropping toward $100 — reflects the market pricing a peace premium ahead of Trump’s address tonight. However, the fundamental supply disruption has not been resolved. Major logistics firms have been rerouting around the Cape of Good Hope — a costly adaptation — and Iranian-threatened Kuwaiti tankers remain a live risk. Even if a ceasefire is announced, the process of reopening the strait and restoring normal transit volumes is expected to take weeks. This means the inflation impact of the oil shock will remain embedded in consumer price data through Q2 2026, regardless of near-term diplomatic progress.
For equity indices, the interplay between falling oil prices and their impact on margins, consumer spending, and central bank policy is complex. Lower oil is straightforwardly positive for growth expectations and risk assets in the near term. The 10-Year Treasury yield has retreated to approximately 4.32% as inflation expectations moderate, providing a supportive backdrop for equity valuations, particularly in rate-sensitive tech and growth stocks that dominate the Nasdaq 100 and S&P 500.
Professional market participants have been operating with thin liquidity and lighter-than-usual positioning throughout the Iran war period, which has amplified both the down-moves and the relief rallies. Analysts at Global X ETFs describe markets as “struggling because they are trying to price two competing paths at once” — a ceasefire rally versus a prolonged energy disruption shock. This positioning dynamic means that even rumour-driven price action has been outsized relative to confirmed information.
The consensus across strategists covered by CNBC and Fortune is broadly “grin and bear it” — with Ed Yardeni of Yardeni Research noting that “geopolitical crises in the past have almost always been buying opportunities.” RBC Wealth Management’s executive director Gautam Chadda reports that institutions have been repositioning toward beneficiaries of regional turmoil — fertilizer producers, defence manufacturing, helium suppliers — while also adding high-quality long-term equity holdings during the dips. This bifurcated positioning explains why today’s relief rally has been broad-based but not yet technically confirmed as a trend reversal on daily timeframes.
The VIX, which peaked near the high 30s during peak Iran war anxiety, has retreated to approximately 24-25 on today’s session, still elevated relative to its 2025 norms but reflecting a genuine reduction in near-term implied volatility. For all three indices, the key question is whether today’s rally represents a sustainable re-rating lower of the geopolitical risk premium, or a temporary relief bounce ahead of what remains a highly uncertain presidential address tonight and Friday’s NFP data.
| Time (GMT) | Event | Currency | Impact | Index Implication |
|---|---|---|---|---|
| 12:15 | ADP Nonfarm Employment Change (Mar) | USD | HIGH | Actual 62K vs 41K forecast — beat reduces immediate rate cut pressure, marginally positive for equities but leaves NFP as the decisive labour market test on Friday. |
| 13:30 | Core Retail Sales (Mar) | USD | HIGH | Forecast +0.3%; a strong reading signals consumer resilience despite energy-driven cost pressures, supportive for S&P 500 consumer discretionary components. |
| 13:45 | S&P Global Manufacturing PMI (Mar, Final) | USD | MEDIUM | Forecast 52.4; a print above 50 confirms manufacturing expansion despite energy shock, positive for industrials in both the SPX and FTSE 100. |
| 14:00 | ISM Manufacturing PMI (Mar) | USD | HIGH | Forecast 52.3 vs prior 52.4; a beat supports the risk-on tone across all three indices and reinforces the view that the real economy is resilient enough for equities to sustain today’s relief rally. |
| 14:30 | EIA Crude Oil Inventories (Weekly) | USD | HIGH | Forecast -1.3M barrels vs prior +6.9M; a draw would indicate tightening supply conditions and could limit the pace of today’s crude oil price decline, capping energy-driven disinflation hopes for the FTSE and SPX energy sectors. |
| 02:00 (Thu) | Trump National Address on Iran | All | HIGH | Prime-time address at 21:00 ET / 02:00 GMT Thursday — the single most significant near-term catalyst; confirmation of a ceasefire or military withdrawal timeline would likely send all three indices sharply higher in overnight futures, while ambiguity or escalation risks a complete reversal of today’s gains. |
with Precision — Capital Street FX

The Nasdaq 100 daily chart presents a Fibonacci retracement structure drawn from the all-time swing high at 26,175.07 — recorded in early 2026 — down to the recent swing low at 22,835.92. The index has spent the past several weeks in a controlled decline below the 0.618 retracement at 24,899.52 and the 0.500 midpoint at 24,505.50, with today’s +3.43% surge now bringing price directly into contact with the 0.236 retracement level at 23,623.96. The session high of 23,789.60 briefly exceeded this Fibonacci marker, and the key question is whether bulls can sustain a daily close above 23,624 to formally reclaim this structural level.
The moving average configuration remains firmly bearish on the daily timeframe. The 50-day SMA, currently declining through the 23,751 area, is acting as a confluence resistance zone alongside the 0.236 Fibonacci — making the 23,624–23,789 band a critical technical test. RSI at approximately 42.50 (per chart) has recovered from its deeply oversold readings near 39 but remains below the 50 neutral threshold, confirming that momentum recovery is nascent rather than confirmed. MACD reads -132.40, a sell signal, though the histogram is narrowing, indicating bearish momentum is losing force. The two moving averages on the chart — the yellow (short-term) and orange (long-term) — have diverged bearishly, with price trading below both, confirming the medium-term downtrend structure.
For the near term, the bull case requires a closing print above 23,624 (0.236 Fib) and ideally a daily candle close above the 50-day SMA at 23,751 to build momentum toward 24,111 (0.382 Fib). Failure at this zone — particularly if tonight’s presidential address delivers an ambiguous or hawkish message on Iran — would confirm the 0.236 level as resistance and leave the 22,835.92 swing low exposed as the next structural support. The 5-day SMA at 23,281 sits below current price and represents near-term dynamic support on any pullback.
| Indicator | Value | Signal |
|---|---|---|
| Overall Daily Signal | — | Strong Sell |
| MA Alignment | 2 Buy / 10 Sell | Sell |
| RSI (14) | ~42.50 | Neutral |
| MACD | -132.40 | Sell |
| 5-Day SMA | 23,281.84 | Buy |
| 50-Day SMA | 23,751.28 | Sell |
| Fibonacci Pivot | 23,287.16 | — |
| Fibonacci Level | Price | Role |
|---|---|---|
| 1.000 — Swing High | 26,175.07 | Resistance |
| 0.786 | ~25,400.40 | Resistance |
| 0.618 | 24,899.52 | Resistance |
| 0.500 | 24,505.50 | Resistance |
| 0.382 | 24,111.48 | Target 2 |
| 0.236 | 23,623.96 | Target 1 / Current Test |
| ▶ CURRENT PRICE | 23,740.19 | Testing 0.236 |
| 0.000 — Swing Low | 22,835.92 | Support / Stop Zone |

The S&P 500 daily chart shows a Fibonacci retracement drawn from the January 2026 all-time high at 7,007.01 down to the recent swing low at 6,319.99, establishing a structural range that has been the dominant analytical framework through the Iran war selloff. Today’s +2.91% session has lifted the index from the 6,395 area — where it opened — back through the 0.236 Fibonacci retracement at 6,482.13 and toward the 0.382 level at 6,582.44. The session high of 6,539.05 sat between these two markers, meaning the index is currently in a technically contested zone: above the first structural support/resistance level, but yet to close above the more significant 0.382 retracement.
The moving average structure on the daily chart is bearish across all major durations. The 5-day SMA at 6,396 now sits just below the opening price, representing near-term dynamic support. The 50-day SMA at 6,508 has been crossed intraday by today’s rally, a notable development — but a sustained close above 6,508 is needed to give this any technical weight. The 200-day SMA at 6,717 remains far above current price, continuing to act as significant overhead resistance. RSI at 48.78 is approaching the 50 neutral level from below, while the MACD at -30.74 remains a sell signal but is showing convergence, consistent with the momentum recovery visible in today’s large green candle.
The daily chart descending channel — visible in the chart structure from the February 2026 peak — represents the overriding technical constraint. A break above the upper channel line, currently in the 6,600–6,650 area, would represent a meaningful structural shift. Until that occurs, this rally — however powerful intraday — remains a potential bear-market bounce within a confirmed downtrend channel. The 0.786 retracement at 6,859.99 and the 0.618 at 6,744.57 remain the upper structural targets if de-escalation becomes definitive.
| Indicator | Value | Signal |
|---|---|---|
| Overall Daily Signal | — | Strong Sell |
| MA Alignment | 0 Buy / 12 Sell | Strong Sell |
| RSI (14) | 48.78 | Neutral |
| MACD | -30.74 | Sell |
| 5-Day SMA | 6,396.28 | Buy |
| 50-Day SMA | 6,508.04 | Sell |
| Fibonacci Pivot | 6,423.11 | — |
| Fibonacci Level | Price | Role |
|---|---|---|
| 1.000 — Swing High | 7,007.01 | Resistance |
| 0.786 | 6,859.99 | Resistance |
| 0.618 | 6,744.57 | Resistance |
| 0.500 | 6,663.50 | Target 2 |
| 0.382 | 6,582.44 | Target 1 |
| ▶ CURRENT PRICE | 6,528.52 | Between 0.236 & 0.382 |
| 0.236 | 6,482.13 | Near-term Support |
| 0.000 — Swing Low | 6,319.99 | Support / Stop Zone |

The FTSE 100 daily chart shows a Fibonacci structure drawn from the all-time swing high at 10,924.68 down to the swing low at 9,412.73, covering the broad range of the index’s recent price action. Today’s session has pushed the index to 10,359.98, directly into the 0.382 retracement level at 10,347.11 — a level of significant structural importance. The daily high of 10,388.96 exceeded this Fibonacci marker intraday, and the question for London’s close is whether the index can sustain a print above 10,347 to confirm the level has been reclaimed as support. The context is notable: the FTSE was trading near 9,600 just weeks ago, meaning the current price represents a recovery of approximately 760 points from the war-driven lows.
The chart’s moving average structure shows an encouraging shift in the short-term. The yellow moving average (shorter-period) has begun curling upward from its lows, and price has crossed above it in today’s session — a constructive signal that was not present for much of Q1 2026. The orange moving average (longer-period) remains below and is still trending lower, reflecting the broader medium-term downtrend. RSI at 43.26 — below the 50 neutral mark but recovering from the extreme low of 41.68 shown in the chart — confirms that momentum is rebuilding but has not yet reached neutral, let alone bullish territory. MACD at -5.75 remains a sell, but the histogram’s slope is improving, consistent with the broader recovery narrative.
The 0.5 Fibonacci retracement at 10,168.70 served as intraday support at today’s session low (10,169.30), a textbook technical interaction that validates the Fibonacci grid. Above 10,347 (0.382), the next resistance is at 10,567.86 (0.236), with the swing high at 10,924.68 representing the ultimate bull case target if full de-escalation materialises. The descending trendline structure visible from the January–February 2026 peaks will also need to be contended with in the 10,400–10,500 area, adding to the confluence of overhead resistance. Today’s 1.80% gain is the most meaningful daily move in weeks for the Footsie, but it remains a data point within a bearish daily technical framework.
| Indicator | Value | Signal |
|---|---|---|
| Overall Daily Signal | — | Strong Sell |
| MA Alignment | 4 Buy / 8 Sell | Sell |
| RSI (14) | 43.27 | Sell |
| MACD | -5.75 | Sell |
| 5-Day SMA | 10,295.61 | Sell |
| 50-Day SMA | 10,303.13 | Sell |
| Fibonacci Pivot | 10,266.25 | — |
| Fibonacci Level | Price | Role |
|---|---|---|
| 1.000 — Swing High | 10,924.68 | Ultimate Resistance |
| 0.786 | ~10,754 | Resistance |
| 0.618 | ~10,847 (est.) | Resistance |
| 0.500 | 10,168.70 | Support (tested today) |
| 0.382 | 10,347.11 | Current Test |
| ▶ CURRENT PRICE | 10,359.98 | Just above 0.382 |
| 0.236 | 10,567.86 | Target 1 |
| 0.000 — Swing Low | 9,412.73 | Ultimate Support |
All three indices covered in this report — the Nasdaq 100, S&P 500, and FTSE 100 — are posting significant intraday gains on April 1, 2026, driven by a single, dominant macro catalyst: President Trump’s declaration that the United States will withdraw from its military campaign against Iran within two to three weeks regardless of whether a formal deal has been reached. The technical signals across all three indices remain classified as Strong Sell on the daily timeframe per Investing.com’s summary, reflecting the damage done to chart structure during the five-week war-driven selloff. Today’s rally, while sizeable, has not yet produced the pattern of confirmed daily closes above key Fibonacci resistance levels that would reclassify the medium-term outlook as bullish. It is a relief bounce operating within broader bearish daily structures.
The macro narrative is tightly connected to the technical setups. All three indices have Fibonacci entry zones that correspond to levels where de-escalation buying meets structural resistance: the NDX 0.236 at 23,624, the SPX 0.382 at 6,582, and the UKX 0.382 at 10,347. These are the levels to watch into the London close and overnight US session. The Federal Reserve’s hold at 3.6% with one cut projected for 2026, the Bank of England’s hold at 3.75%, and the ADP beat of 62,000 for March all provide a backdrop of economic resilience that — if accompanied by credible de-escalation — could support a sustained rally in the weeks ahead. Friday’s NFP and the April 6 Iran strike deadline remain the two most significant binary risk events beyond tonight’s presidential address.
Traders should enter all three setups with reduced size ahead of Trump’s national address at 21:00 ET / 02:00 GMT Thursday. The rally is built on anticipation, not confirmation. A credible ceasefire or withdrawal timeline would validate Target 1 levels for all three — 24,111 for NDX, 6,582 for SPX, and 10,568 for FTSE. Ambiguity or a hawkish development would erase today’s gains rapidly and expose the respective swing lows as the next downside targets.