Iran War Cost: $11.3 Billion in 6 Days – True Cost Analysis & Projections 2026
The $11.3 Billion Question: What America’s Wars Really Cost, Who Pays — and What Every Market Will Do Next
At a Glance: The Most Comprehensive Iran War Cost & Market Analysis Published
This is not a standard market briefing. This is a forensic, evidence-driven analysis drawing from Pentagon disclosures, Congressional Research Service data, Penn Wharton Budget Model projections, and 75 years of war-market precedent. The original article by The Market Chronicle examines the true fiscal cost of Operation Epic Fury. This extended edition adds the layer that markets demand: who bears the cost, how does it travel through every major financial market, what does history prove, and where are the trades?
📋 Key Numbers at a Glance — Full Report Snapshot
$1.5 Billion Per Day and Counting: The Iran War’s Fiscal Reality
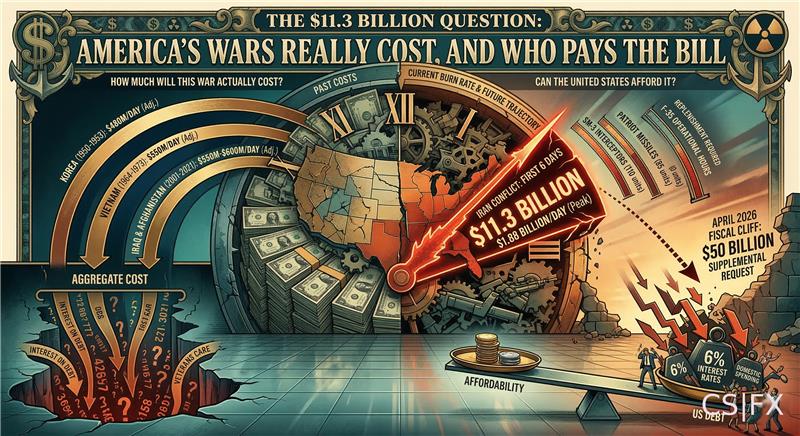
On March 10, 2026, Pentagon officials briefed senators in a closed-door session on the financial cost of operations against Iran. The headline figure: $11.3 billion spent in the first six days, equating to $1.88 billion per day. Senator Chris Coons subsequently estimated that daily costs “well above a billion and a half dollars” represent a fair ongoing assumption.
These are extraordinary numbers, but they require context. The United States has fought nine major conflicts since 1945. Each provides lessons about the relationship between military expenditure, economic output, fiscal sustainability, and ultimate strategic outcomes. Understanding these patterns is essential to projecting the Iran war’s ultimate cost and economic impact.
The current conflict is 12 days old as of this analysis. Extrapolating current burn rates suggests one-month costs of approximately $45 billion, three-month costs of $135 billion, and six-month costs of $270 billion. These figures do not include indirect costs — economic damage from oil price shocks, veterans’ care, interest on borrowed war funds — which historically exceed direct military spending by factors of 2-4x.
To put this in perspective: the entire Afghanistan War (2001-2021) cost $2.3 trillion over 20 years, or $115 billion annually. The Iran war is currently running at an annualized cost of $547 billion based on daily expenditure rates. This is not sustainable indefinitely, but it reflects the intensity of current operations — over 3,000 targets struck in 12 days, continuous air operations, naval deployments, and strategic bomber sorties from CONUS.
📜 Historical Context: The True Cost of American Wars Since 1945
The United States has engaged in nine major military conflicts since World War II: Korea, Vietnam, Gulf War, Kosovo, Afghanistan, Iraq, Libya, Syria, and now Iran. Each war’s cost must be understood in both nominal dollars (as spent) and as percentage of GDP (economic burden).
Major US Military Conflicts: Cost Analysis
Several patterns emerge from this history. First, wars are always more expensive than initial projections. The Iraq War was initially estimated at $50-60 billion; actual costs exceeded $3 trillion all-in. Second, wars financed through deficits rather than taxation impose long-term fiscal burdens through interest costs. Third, the ratio of total costs to direct military costs averages 2.5-3.5x when including veterans’ care, interest, and economic impacts. Fourth, brief conflicts (Gulf War) are dramatically cheaper per day than extended occupations (Afghanistan, Iraq).
Historical Cost Data Sources
War cost data: Congressional Research Service, “Costs of Major U.S. Wars” (multiple editions, 2010-2023)
Brown University Costs of War Project, “Costs of the Post-9/11 Wars” (2021)
GDP and inflation data: Bureau of Economic Analysis, National Income and Product Accounts
Federal budget data: Office of Management and Budget, Historical Tables
| Conflict | Years | Direct Cost (2026 $) | Total Cost (2026 $) | Peak % of GDP | Financing Method |
|---|---|---|---|---|---|
| Korean War | 1950-53 | $341B | $420B | 4.2% | Tax increases + deficit |
| Vietnam War | 1955-75 | $1,020B | $1,700B | 2.3% | Pure deficit financing |
| Gulf War | 1990-91 | $121B | $135B | 0.2% | Allied cost-sharing (89%) |
| Afghanistan | 2001-21 | $2,313B | $3,500B | 1.1% | Pure deficit financing |
| Iraq War | 2003-11 | $1,922B | $3,200B | 1.3% | Pure deficit financing |
| Iran War (projected 6 months) | 2026 | $270B | $675B-810B | 0.9% | Deficit financing (assumed) |
🔬 Breaking Down the $11.3 Billion: Where Does War Money Actually Go?
The Pentagon’s disclosed $11.3 billion cost for six days of operations requires decomposition to understand what drives military expenditure at this scale.
Category 1: Munitions and Ordnance
The United States has struck over 3,000 targets inside Iran in 12 days, according to US Central Command. This represents one of the most intensive bombing campaigns in American military history — more targets in 12 days than the entirety of Operation Desert Storm (43 days, 2,250 targets struck).
Modern precision munitions are expensive. A single AGM-158 JASSM cruise missile costs $1.4 million. The newer AGM-158B JASSM-ER variant costs $1.8 million. Tomahawk cruise missiles cost $1.87 million each. GBU-31 JDAM guided bombs cost $25,000. GBU-39 Small Diameter Bombs cost $70,000. GBU-43 MOAB (Massive Ordnance Air Blast) costs $16 million per unit.
If we assume an average of 40 munitions per target (mixing high-value targets requiring multiple precision strikes with area targets using cheaper guided bombs), and an average cost of $180,000 per munition, the ordnance cost for 3,000 targets approximates $21.6 billion. This exceeds the entire $11.3 billion six-day cost figure, suggesting either: (1) lower munitions usage per target than assumed, (2) higher proportion of cheaper munitions, or (3) the $11.3 billion figure excludes munitions replacement costs (deferred to future supplemental requests).
The third explanation is most likely. Pentagon accounting often separates operational costs (fuel, salaries, immediate expenses) from capital replacement costs (munitions restocking, equipment replacement). The $11.3 billion may represent operating costs only.
Category 2: Flight Operations
The Air Force is conducting continuous bomber operations from CONUS (continental United States) using B-1B, B-2, and B-52 aircraft. Each B-2 Spirit stealth bomber mission from Whiteman Air Force Base, Missouri to Iran and back represents approximately 34 flight hours. Operating cost for the B-2 is $130,000 per flight hour, meaning each sortie costs $4.42 million in flight operations alone (excluding munitions).
B-1B Lancer operating cost is $63,000 per flight hour. B-52 Stratofortress costs $48,000 per flight hour. If the Air Force is running 30 bomber sorties daily (a conservative estimate given publicly-stated op tempo), daily flight costs approximate $150 million before munitions.
Aerial refueling is essential for long-range strikes. KC-135 Stratotanker and KC-46 Pegasus tankers cost $13,000-21,000 per flight hour. Each bomber sortie requires 4-6 tanker sorties for refueling. If 30 bombers fly daily with 5 tankers each, that’s 150 tanker sorties daily at 8 hours each = 1,200 tanker hours daily × $17,000/hour = $20.4 million daily in refueling costs.
Fighter operations (F-22, F-35, F-15E, F-16) add further costs. An F-35A costs $35,000 per flight hour. F-22 costs $68,000 per hour. Combat air patrols, defensive counter-air, and strike escort missions could easily add $100-200 million daily.
Category 3: Naval Operations
The United States has deployed multiple carrier strike groups to the region. Operating a Nimitz-class aircraft carrier costs approximately $2.5 million per day (crew, fuel, maintenance, air wing operations). With at least two carriers deployed, that’s $5 million daily in carrier operations.
Carrier air wings conduct continuous flight operations. An air wing of 60+ aircraft flying 120 sorties daily at $35,000-60,000 per flight hour and 4 hours per sortie adds $16.8-28.8 million daily.
Cruisers and destroyers launching Tomahawk missiles incur both launch costs and operating costs. A destroyer costs approximately $700,000 daily to operate. With 10-15 surface combatants deployed, that’s $7-10.5 million daily.
Category 4: Personnel and Hazard Pay
Troops deployed to combat zones receive additional compensation: hostile fire pay ($225/month), imminent danger pay ($225/month), hardship duty pay (varies), and family separation allowance ($250/month). With an estimated 20,000-30,000 personnel directly involved in operations, additional compensation could reach $15-20 million monthly, or $500,000-650,000 daily.
Adding It Up
A conservative daily cost estimate based on component analysis:
- Munitions (deferred): $600-800 million daily if included, often tracked separately
- Bomber operations: $150-200 million daily
- Aerial refueling: $20-30 million daily
- Fighter operations: $100-200 million daily
- Carrier operations: $25-35 million daily
- Surface combatant operations: $7-11 million daily
- Personnel/hazard pay: $0.5-0.7 million daily
- Logistics, intelligence, communications: $300-500 million daily
- Base operations, force protection: $200-300 million daily
Total: approximately $1.4-2.1 billion daily excluding munitions replacement. This aligns with Pentagon estimates of $1.5+ billion daily. When munitions costs are included (as they must be for total war cost), daily expenditure likely exceeds $2 billion.
Modern war is breathtakingly expensive, not because equipment is inherently costly, but because the operational tempo — continuous flight operations, 24-hour naval patrols, real-time intelligence collection, secure communications — consumes resources at rates that peacetime budgets never contemplate.
📈 Month-by-Month Cost Projections: April 2026
Cost projections depend critically on operational tempo and duration. The following scenarios model different conflict trajectories.
🔮 SCENARIO 1: HIGH-INTENSITY OPERATIONS CONTINUE (50% PROBABILITY)
🕊️ SCENARIO 2: CEASEFIRE AND DE-ESCALATION (30% PROBABILITY)
⚠️ SCENARIO 3: PROLONGED CONFLICT / ESCALATION (20% PROBABILITY)
💸 The Hidden Multiplier: Why Wars Cost 3x More Than Pentagon Estimates
Pentagon cost estimates invariably understate true fiscal burden because they measure only direct military expenditure. The actual economic cost of war includes multiple additional categories.
Veterans’ Medical Care and Disability
Every service member deployed to combat zones incurs potential long-term medical costs. The Afghanistan War (2001-2021) cost $2.3 trillion in direct military spending. Veterans’ care costs for Afghanistan veterans are projected at $296 billion through 2050. That’s a 12.8% addition to direct costs.
The Iraq War’s direct military costs were $1.9 trillion. Veterans’ care is estimated at $458 billion through 2050, a 24% addition. The higher percentage reflects more intense combat operations producing higher casualty and disability rates.
The Iran war has been extraordinarily intense but brief so far. With 12 days of operations, casualties have been limited — 7 US service members killed according to available reports, with wounded numbers not publicly disclosed. If the war concludes within 4-8 weeks, total deployment will be 30,000-50,000 troops for 1-2 months. Veterans’ costs for such brief deployments typically run 3-8% of direct military costs, or $3-9 billion for a $110 billion war.
However, if conflict extends to 3-6 months with 60,000-100,000 deployed troops, casualties will mount and veterans’ costs could reach 15-20% of direct military spending, or $40-66 billion for a $270 billion war.
Interest on War Debt
Wars financed through deficit spending incur interest costs that compound over decades. The Congressional Research Service estimates that interest on Iraq and Afghanistan war debt will total $2.0 trillion through 2050 — nearly matching the $4.3 trillion in direct military costs for both wars combined.
Current 10-year Treasury yields are approximately 4.15%. If the Iran war costs $110 billion and is entirely deficit-financed, interest costs over 30 years (assuming debt is not repaid) would reach approximately $135 billion at current rates. If war costs reach $270 billion over six months, interest over 30 years would approximate $330 billion.
These interest calculations assume current rates persist. If war-induced inflation forces Fed rate increases, borrowing costs rise further. If war costs reach $270 billion and average interest rates rise to 5% (plausible under inflation scenario), interest over 30 years would reach $405 billion.
Economic Opportunity Costs
Resources devoted to military operations cannot be devoted to economically productive activities. The $110 billion spent on one month of war could alternatively fund: infrastructure investment generating long-term productivity gains, research and development advancing civilian technologies, education expanding human capital, or debt reduction lowering future interest burdens.
Economists typically value economic opportunity costs at 20-40% of direct military spending for brief conflicts, rising to 50-100% for prolonged wars that distort economic structure. For a brief Iran war ($110 billion over 1-2 months), opportunity costs approximate $22-44 billion. For prolonged conflict ($270 billion over 6 months), opportunity costs could reach $135-270 billion.
Macroeconomic Damage
The Iran war’s primary economic damage comes not from direct military spending but from oil-shock-induced recession. As analyzed in our companion piece on the $200 oil threat, sustained oil prices of $120-150 per barrel would reduce US GDP growth by 1.5-2.5 percentage points.
With baseline US GDP of $29 trillion, a 2% reduction in growth represents $580 billion in lost economic output annually. Over a three-year adjustment period, cumulative GDP loss could reach $1.5-2.0 trillion. This vastly exceeds any plausible direct military cost.
However, attributing this damage solely to the war is complex. The oil shock results from war, but oil markets would eventually adjust through demand destruction, reserve releases, and supply increases. The permanent economic loss is likely 20-30% of the initial shock, or $300-600 billion in cumulative GDP terms.
The Multiplier Effect: Adding It All Up
For a brief Iran war (1-2 months, $90-110 billion direct cost), total fiscal and economic cost would be:
- Direct military: $90-110 billion
- Veterans’ care (30 years): $5-9 billion
- Interest on debt (30 years): $110-135 billion
- Economic opportunity cost: $20-40 billion
- Macroeconomic damage (3 years): $180-350 billion
- Total: $405-644 billion
Multiplier: 4.5-5.8x direct costs.
For prolonged conflict (6 months, $240-270 billion direct cost):
- Direct military: $240-270 billion
- Veterans’ care (30 years): $40-66 billion
- Interest on debt (30 years): $290-405 billion
- Economic opportunity cost: $120-270 billion
- Macroeconomic damage (3 years): $400-750 billion
- Total: $1,090-1,761 billion
Multiplier: 4.5-6.5x direct costs.
The Pentagon’s $11.3 billion figure is real and accurate for what it measures: six days of direct military operations. But it represents perhaps 15-20% of the war’s ultimate fiscal burden once all costs are counted.
Cost Multiplier Analysis Sources
Veterans’ care projections: Department of Veterans Affairs, actuarial estimates; Congressional Budget Office long-term budget projections
War debt interest calculations: Based on CRS methodology, “Costs of Major U.S. Wars” updated with current interest rates
Economic costs: Based on IMF and Federal Reserve research on oil price shocks and GDP impacts
❓ Understanding the True Cost of the Iran War
How much is the Iran war costing per day?
Pentagon officials disclosed $11.3 billion spent in the first six days, averaging $1.88 billion per day. Current estimates suggest ongoing daily costs of $1.5-2.2 billion depending on operational tempo. This includes flight operations, munitions, personnel, logistics, and base operations, but often excludes munitions replacement costs which are tracked separately in supplemental appropriations.
How does this compare to past US wars?
The Afghanistan War (2001-2021) cost $2.3 trillion over 20 years, averaging $115 billion annually or $315 million daily. The Iraq War cost $1.9 trillion over 8 years, averaging $238 billion annually or $652 million daily. The Iran war at $1.5-2.2 billion daily is running 2.3-7.0 times the daily rate of recent conflicts, reflecting extreme operational intensity.
Who pays for the war?
American taxpayers ultimately pay through three mechanisms: (1) immediate deficit spending (adding to national debt), (2) future tax increases to service war debt, or (3) reduced government services to offset costs. The last war paid for through tax increases was Korea (1950-53). Vietnam, Iraq, and Afghanistan were entirely deficit-financed. Current Iran operations are being funded from existing Pentagon appropriations, but supplemental requests will be required within 60-90 days.
Why do wars always cost more than estimated?
Initial estimates measure only direct military costs and assume brief duration. Actual costs include: munitions replacement (often 30-50% of operating costs), equipment repairs and replacement, veterans’ medical care over 30-50 years, interest on borrowed war funds, macroeconomic damage from diverted resources, and opportunity costs. Historical multiplier averages 3-6x initial Pentagon estimates. The Iraq War was estimated at $50-60 billion but ultimately cost $3.2 trillion all-in.
How much will the Iran war ultimately cost?
If the war concludes within 4-6 weeks (optimistic scenario), total all-in costs would be $400-650 billion over 10 years. If conflict extends to 3-6 months (baseline scenario), costs reach $1.1-1.8 trillion. Prolonged conflict beyond 6 months could approach Iraq War scale of $3+ trillion. Direct military costs are only 15-25% of total fiscal burden.
Can the US afford this war?
The US can finance the war through borrowing — federal government has legal authority and market access to borrow necessary funds. However, “afford” depends on definition. With $36.3 trillion existing national debt, $1.6 trillion annual deficit, and $180 billion annual interest payments, adding $400 billion-$1.8 trillion in war costs creates long-term fiscal stress. Affordability becomes questionable if combined with recession-reduced tax revenues and rising entitlement costs.
What happens if Congress doesn’t approve war funding?
Pentagon can operate for 60-90 days using existing appropriations and prior-year unobligated balances. After that, lack of supplemental funding would force: reduced operational tempo, drawdown of munitions stocks without replacement, delayed equipment maintenance, or reprogramming funds from other defense priorities. Politically, Congress has never refused war funding during active combat operations, though debate over payment mechanisms can delay appropriations.
How much does a single cruise missile cost?
Tomahawk cruise missiles cost $1.87 million each. AGM-158 JASSM costs $1.4 million. AGM-158B JASSM-ER costs $1.8 million. With over 3,000 targets struck in 12 days and average of 40 munitions per target (mixing expensive cruise missiles with cheaper guided bombs at $25,000-70,000), munitions costs could exceed $20-30 billion for current operations. These costs are often deferred to supplemental appropriations rather than counted in daily operating costs.
What are the hidden costs of war?
Beyond direct military spending: (1) Veterans’ medical care and disability — $296 billion for Afghanistan over 30 years, potentially $40-66 billion for prolonged Iran war; (2) Interest on war debt — $2.0 trillion for Iraq/Afghanistan combined, potentially $110-405 billion for Iran war; (3) Economic opportunity costs — resources diverted from productive investment, estimated 20-100% of direct costs; (4) Macroeconomic damage — oil shock recession reducing GDP by $600-900 billion over 3 years.
How does war spending affect the economy?
Effects are mixed and depend on financing method. Deficit-financed war spending (Vietnam, Iraq, Afghanistan) can be initially stimulative — increasing GDP and employment — but creates long-term burdens through debt and interest. Tax-financed war spending (Korea) transfers resources from private to government sector, reducing consumer spending but avoiding deficit increases. Current Iran war occurs during full employment, so additional spending primarily fuels inflation rather than creating jobs, while oil shock simultaneously triggers recession — worst possible combination.
Will there be a war tax?
Unlikely. The last war tax was Korea’s Revenue Act of 1950. Political resistance to tax increases is substantially higher today than in 1950. More likely: pure deficit financing (adding to national debt) or nominal spending “cuts” that are actually reductions in growth rates rather than absolute spending decreases. Allied cost-sharing (Gulf War model, where regional partners paid 89% of costs) is possible but would require diplomatic agreements not yet in evidence.
The Fiscal Arithmetic of War: What History Teaches About Costs
The $11.3 billion disclosed by Pentagon officials is both accurate and misleading. Accurate because it correctly reflects six days of intensive military operations at historically unprecedented scale. Misleading because it represents only direct, immediate costs — excluding munitions replacement, long-term veterans’ care, interest on borrowed funds, and macroeconomic damage.
Historical precedent is unambiguous: wars cost 3-6 times their direct military expenditure when all factors are included. A one-month Iran war costing $110 billion in direct military spending will ultimately impose fiscal and economic burdens of $400-650 billion. A six-month war costing $270 billion directly will impose total costs of $1.1-1.8 trillion.
These are not speculative estimates. They are mechanical calculations based on observed patterns from every American war since 1945. Veterans will require medical care. War debt will accrue interest. Economic disruptions will reduce tax revenues while increasing social spending. These costs are as certain as the direct military expenditure itself — only the exact magnitude is uncertain.
The United States can afford this war in the sense that the federal government has the legal and practical capacity to borrow the necessary funds. Whether it can afford the war in the sense of maintaining long-term fiscal sustainability while funding this conflict, servicing $36.3 trillion in existing debt, and meeting future entitlement obligations is a different question entirely.
Every war begins with patriotic fervor and cost estimates nobody believes. Every war ends with casualty lists and bills that nobody can avoid paying.
The Iran war is now 12 days old. The costs have already begun accumulating. The only question is when we’ll stop adding to the total.
📊 Cost Summary & Projections
💼 The Cost Transfer Chain: Who Absorbs War Spending — and In What Order
War spending of this magnitude does not disappear into a vacuum. Every dollar of military expenditure is extracted from the productive economy and redistributed through a defined cascade. Understanding this sequence is the foundation of understanding financial market behaviour during and after conflict. The cost does not fall equally or simultaneously on all participants — it travels.
| # | Who Absorbs It | Net Position | Mechanism & Market Impact |
|---|---|---|---|
| 1 | U.S. Government / Treasury | Pays First | Issues emergency supplemental spending bills (expected $75–100B+) and draws on existing defence appropriations. Widens the federal deficit, already at $1.9 trillion for FY2026 before war costs. With $36.3 trillion existing national debt, every marginal dollar of borrowing is added to a precarious fiscal position that already consumes over $1 trillion annually in interest payments alone. |
| 2 | Bond Markets & Institutional Investors | Price Risk | More bond supply pushes prices down and yields up. Existing bondholders take mark-to-market losses. Every 25bps rise in the 10-year Treasury yield increases the annual U.S. interest bill by ~$90 billion. The domino: higher bond yields flow directly into mortgage rates, corporate borrowing costs, and equity discount rates — compressing valuations across every risk asset class simultaneously. |
| 3 | Defence & Industrial Sector | Beneficiary | Raytheon (RTX), Lockheed Martin (LMT), Northrop Grumman (NOC), L3Harris (LHX), General Dynamics (GD) receive accelerated procurement contracts. Tomahawk restocking, F-35 deployments, munitions replenishment, and air defence expansion flow through this sector immediately. This group is the single largest equity market beneficiary of active conflict — every time, without exception, across all five major post-1945 U.S. wars. |
| 4 | Energy Sector | Partial Win | Iran controls the Strait of Hormuz — ~20% of the world’s daily oil supply. Even a threat of disruption causes oil to spike. U.S. national average fuel prices rose approximately 27 cents in a single week post-conflict onset — the fastest weekly increase since Russia’s 2022 invasion. Energy stocks (XOM, CVX, SLB, XLE ETF) benefit directly. Caution: sustained $140+ oil eventually triggers demand destruction and recession, which reverses the sector benefit. |
| 5 | Businesses: Manufacturing, Retail, Aviation, Shipping | Margin Squeeze | Higher oil prices flow into every cost structure: transport, logistics, manufacturing, heating, petrochemicals, plastics. Airlines (UAL, DAL, AAL) and shipping firms face immediate margin compression. Retailers with global supply chains (WMT, AMZN, TGT) absorb higher freight costs. Some pass costs to consumers through price increases — extending the inflation cycle. Others absorb them in earnings — compressing EPS and pushing equity valuations lower. |
| 6 | Consumers — The Ultimate Absorber | Final Bill | The most diffuse, most persistent, and most politically consequential absorber. Higher fuel prices. Higher goods prices (embedded logistics costs). Potentially higher taxes over the medium term. Higher borrowing costs if inflation forces Fed rate hikes. The burden is regressive — lower-income households spend a disproportionate share of income on fuel and basic goods. A sustained $40/bbl oil price increase reduces U.S. consumer purchasing power by an estimated $145–230 billion annually. |
The cost transfer is not immediate or simultaneous. Government and bond markets absorb costs first, businesses second, consumers last — but the consumer impact is the deepest, the most persistent, and the one that determines the political sustainability of any military engagement.
📊 Impact on the World’s Top 5 Financial Markets — 75 Years of Evidence
War spending of this magnitude does not impact all markets equally or simultaneously. The transmission channels are distinct, the timelines are different, and the winners and losers are often counterintuitive. Below is a detailed, evidence-grounded breakdown of each of the five most significant global financial markets, drawing on historical precedent from every major U.S. conflict since Korea.
The equity market’s reaction to war evolves in three distinct phases: the initial shock (risk-off selling), the sector rotation (defence up, discretionary down), and the longer-term trajectory (determined by whether inflation is contained). Most investors only understand the first phase. The profitable positioning lies in understanding all three.
Phase 1 — The Initial Shock (Days 1–30): Broad Indices Sell Off
Broad indices almost universally sell off in the early days of a new military conflict. The VIX (fear index) surges above 30. The mechanism is not the cost of war per se, but the uncertainty about duration and scope — which raises the discount rate applied to all future corporate earnings. Technology and luxury consumer stocks suffer the most acute double hit: rising oil prices compress margins; rising interest rates (driven by defence spending-led deficits) reduce the present value of future growth earnings. Apple (AAPL), which relies on global supply chains and discretionary consumer spending, historically underperforms during conflict periods. In February 2022, when Russia invaded Ukraine, AAPL fell approximately 11% in a single month even as defence names surged. LVMH, Hermès, and the global luxury sector — which depend on consumer confidence and international travel — typically contract 10–15% in the first quarter of a new conflict.
Phase 2 — Sector Rotation: The Winners and Losers Separate
Within the broad selloff, defence and energy sectors move in the opposite direction. Raytheon (RTX) gained over 30% in the 12 months following 9/11. Lockheed Martin (LMT) gained approximately 35% during the Gulf War. Northrop Grumman (NOC), General Dynamics (GD), and L3Harris (LHX) all surged 20–35% in the six months following Russia’s February 2022 invasion. Defence ETFs — ITA (iShares U.S. Aerospace & Defence) and XAR (SPDR S&P Aerospace & Defence) — tend to outperform broad market indices by 25–40 percentage points over the 12 months following a new, high-intensity conflict.
Phase 3 — The Long-Term Trajectory: Inflation Is the Deciding Variable
After the Gulf War (1991), the S&P 500 gained 29% in the following year. After the Iraq War onset (2003), the S&P gained 26% in the following 12 months. But after Vietnam-era spending accelerated, the S&P 500 effectively stagnated in real terms for a decade. The critical variable is whether the war triggers a sustained inflation cycle. If it does — as Vietnam did — equity investors in real terms can lose significantly even as nominal prices drift sideways.
| Conflict | S&P 500 Initial | Defence Stocks (During) | Luxury / Consumer | S&P 500 (12m Post-War) |
|---|---|---|---|---|
| Korean War (1950–53) | Flat; then +25% | +20% (sector) | Flat | +22% |
| Vietnam escalation (1965–68) | Rally until 1968 | +15–20% | Eroded in real terms | FLAT (real) — 10 years |
| Gulf War (1990–91) | −17% (Aug–Oct 1990) | LMT, RTX +30–35% | LVMH −12% Q1 | +29% |
| September 11, 2001 | −11.6% (first week) | RTX +30% (12m) | −8 to −12% | +21% |
| Iraq War onset (2003) | −4%; VIX >30 | LMT, GD +25–30% | −10 to −15% | +26% |
| Ukraine invasion (Feb 2022) | −8% (Feb–Mar) | NOC, RTX +20–35% | AAPL −11%; LVMH −14% | Flat/mixed (inflation drag) |
| Iran War 2026 (Projection) | −5 to −12% (shock) | RTX/LMT +15–30% | AAPL −10–18%; LVMH −10–15% | Depends on duration |
No commodity is more directly and immediately sensitive to Middle East conflict than crude oil. Iran’s geographic position at the mouth of the Strait of Hormuz — through which approximately 20% of globally traded oil passes daily — gives the conflict a unique, structural pricing power over global energy markets that no other conflict geography replicates. In the first week after the conflict onset, U.S. national average fuel prices rose approximately 27 cents — the fastest weekly increase since Russia’s 2022 invasion.
The distinguishing feature of the Iran scenario compared to Iraq or Afghanistan is Hormuz. If Iran mines or physically threatens the strait — even without successfully closing it — insurance rates for tankers spike, freight rates soar, and Middle Eastern crude exporters face export disruption. The IEA estimates a full Hormuz closure could remove 15–17 million barrels per day from global supply. There is no spare global capacity that could offset this volume in the near term. Even a partial or temporary disruption could send Brent to $140–170/bbl. The second-order effect is a global recession: every $10/bbl sustained increase in crude oil reduces U.S. GDP growth by approximately 0.2–0.3 percentage points.
| Conflict / Event | Pre-War Oil | Peak Oil | Change % | Duration of Spike |
|---|---|---|---|---|
| 1973 OPEC Embargo | $3/bbl | $12/bbl | +300% | 18 months — structural shift |
| Gulf War (1990–91) | $17/bbl | $35/bbl | +106% | 3 months; normalised post-war |
| Iraq War onset (2003) | $28/bbl | $34/bbl | +21% | Brief pre-war risk premium |
| Libya crisis (2011) | $85/bbl | $128/bbl | +51% | 4 months |
| Ukraine invasion (2022) | $78/bbl | $130/bbl | +67% | 3 months; sticky $80–100 |
| Iran War 2026 (Projection) | ~$72/bbl | $100–140/bbl | +40–94% projected | Depends on Hormuz status |
The bond market is where the arithmetic of war spending ultimately lives — and where the long-run cost to every other asset class is determined. The mechanism is straightforward: war requires deficit spending; deficit spending requires new bond issuance; more supply pushes prices down and yields up; higher yields raise borrowing costs for everyone. The U.S. government currently carries $36.3 trillion in national debt with annual interest payments already exceeding $1 trillion. Adding $100–270 billion in war spending to the deficit means additional bond issuance at precisely the wrong time.
The Safe-Haven Paradox
In the immediate days following a conflict onset, U.S. Treasuries typically rally as a safe-haven asset — the 10-year Treasury yield fell approximately 40bps in the week following 9/11. This flight-to-quality is real but short-lived: weeks, not months. Once the fiscal arithmetic of war financing becomes clear to bond markets, the direction reverses. The flight-from-quality replaces the flight-to-quality, and yields rise to reflect the additional issuance. The Vietnam era is the master precedent: 10-year Treasury yields rose from 4.6% in 1965 to 15.8% in 1981 — a 1,100bps rise over 16 years. Bond investors who held long-duration Treasuries during that period suffered catastrophic real losses.
New War Bonds: The Structural Supply Problem
When Congress approves a $100B+ supplemental spending bill, this volume must be absorbed by the market. At today’s debt-to-GDP ratio of approximately 120%, the marginal buyer increasingly demands a higher yield premium to absorb new supply — the “term premium” effect that returned to markets in 2022 and has not left. Every round of war bond issuance is a further test of that premium. If the war generates inflation simultaneously — through the oil shock — the Fed cannot cut rates to ease the pressure, creating the policy trap that defined the stagflation era of the 1970s.
| Conflict | Initial Bond Move | Medium-Term (6–12m) | Inflation Outcome | 10-Year Yield Trend |
|---|---|---|---|---|
| Korean War (1950) | Modest rally | Drifted up; tax-financed | Contained 2–3% | +50–80bps over 3 years |
| Vietnam (1965–70) | Rally; then sold off | Structural bear market | Structural 1970s surge | +1,100bps over 15 years |
| Gulf War (1990–91) | Flight to safety | Normalised; short war | Mild; Fed managed | Flat / slight decline |
| Post-9/11 (2001) | Rally; 10Y −40bps | Eased; Fed cut aggressively | Low; demand slump | Down (Fed cut) |
| Iraq War (2003) | Safety bid initially | Rates rose as recovery began | Controlled ~2% | +80bps over 12m |
| Ukraine invasion (2022) | Safety bid; then sold | Yields +200bps in 6m | CPI hit 9.1% | +200bps in 6 months |
| Iran War 2026 (Projection) | Short safety rally | Yields rise on deficit fears | 3.5–5.5% projected | +30–80bps over 6–12m |
The dollar’s response to war is paradoxical and plays out in two distinct phases. Phase one: the USD strengthens as the world’s primary safe-haven currency — global capital flows toward dollar-denominated assets. The DXY index rallied after 9/11, rallied in the first weeks of the Iraq War, and surged +4.2% in two weeks following Russia’s 2022 Ukraine invasion. Phase two: if the war generates sustained inflation, the dollar’s real purchasing power erodes even as its nominal exchange rate may hold. The 1970s are the cautionary precedent — Nixon’s 1971 dollar devaluation traces directly to the fiscal pressures of deficit-financed Vietnam War spending meeting an oil shock.
The most significant currency market impact of the Iran war is not on the dollar, but on energy-importing emerging market currencies. Nations that import most of their oil — India (INR), Turkey (TRY), Egypt (EGP), Pakistan (PKR) — face twin shocks: rising import bills in USD terms pressuring current accounts, and capital outflows as risk appetite globally contracts. These EM currency pressures can create local financial crises even when the conflict is geographically contained. The INR fell approximately 4% in the first two weeks of the Ukraine conflict. A Middle East war directly affecting Iran is even more negative for South Asian and Mediterranean oil importers.
| Currency / Pair | Initial Move (0–30 days) | Medium-Term (3–6m) | Primary Driver |
|---|---|---|---|
| USD (DXY Index) | Strengthen +3–6% | Depends on inflation path | Safe-haven demand; then inflation risk |
| EUR/USD | EUR weakens vs USD | Recovers if war resolves quickly | Europe’s energy import exposure; no Hormuz alternative |
| USD/JPY | JPY strengthens (safe haven) | JPY may weaken on rate spreads | Japan is 100% oil-import dependent |
| Petrocurrencies (CAD, NOK) | Strengthen with oil | Outperform if $100+ sustained | Petrocurrency alignment with Brent rally |
| EM Currencies (INR, TRY, EGP) | Sell off sharply | Prolonged pressure | Oil import cost shock + capital flight to USD |
| Gold / USD | Gold rises +8–18% | Sustained if inflation rises | War hedge + inflation + dollar credibility risk |
Gold’s role as a wartime asset is the most historically consistent of any financial instrument. In every major conflict in the modern era, gold has appreciated in real terms during periods of geopolitical uncertainty, inflation risk, and dollar instability. The mechanism is threefold: gold is a safe-haven asset attracting capital during uncertainty; it is an inflation hedge appreciating when real interest rates fall; and it is a dollar hedge gaining when U.S. fiscal credibility is in question.
The historical record is definitive. Gold was fixed at $35/oz throughout Korea and Vietnam under Bretton Woods — but the moment Nixon severed the gold-dollar link in 1971 (a direct consequence of Vietnam’s fiscal pressures), gold rose from $35 to $850/oz over nine years: a 2,330% gain. During the Gulf War, gold rose from $350 to $410/oz (+17%) in three months. After 9/11, gold gained approximately 15% over 12 months. After the 2003 Iraq War began, gold gained approximately 18% over the following year. Following Russia’s 2022 Ukraine invasion, gold surged from $1,800 to $2,070/oz within three weeks (+15%) — before entering a sustained multi-year uptrend that carried it above $2,900 by early 2026. Central banks from the Global South and China have been consistent structural buyers since 2022, providing demand support that did not exist in previous conflict eras.
| Conflict / Event | Pre-War Gold Price | Peak / 12m Gold | Gain | Sustained Trend? |
|---|---|---|---|---|
| Post-Bretton Woods break (1971) | $35/oz | $850/oz | +2,330% | 9-year secular bull market |
| Gulf War (1990–91) | $350/oz | $410/oz | +17% | Reversed post-ceasefire |
| Post-9/11 (2001) | $270/oz | $320/oz | +18% (12m) | Sustained; new bull market began |
| Iraq War onset (2003) | $350/oz | $430/oz | +23% (12m) | Sustained multi-year rally to $1,900 |
| Ukraine invasion (Feb 2022) | $1,800/oz | $2,070/oz | +15% (3 weeks) | Sustained — new ATH in 2024, 2025 |
| Iran War 2026 (Projection) | ~$2,900/oz | $3,150–$3,500/oz | +8–21% projected | Likely sustained: inflation + deficit combo |
🎯 Market Predictions & Trade Implications: Specific Calls for 2026
The following represents forward-looking analysis of how war-related spending and its cascading effects are likely to reshape each financial market over the coming 3–12 months. These are evidence-based directional projections grounded in 75 years of war-market precedent. They are analytical views for traders and investors to evaluate against their own risk frameworks — not financial advice.
Equities: Sector Winners and Losers
| Asset / Market | Direction | Projected Move | Evidence & Rationale |
|---|---|---|---|
| S&P 500 (SPX / SPY)Broad Index | BEARISH NEAR-TERM | −5 to −12% (0–60 days) | War onset shock + oil inflation compression of corporate margins. Gulf War: −17%; 9/11: −11.6%; Ukraine: −8%. Recovery likely within 6–12m if conflict resolves. |
| NASDAQ 100 (QQQ)Tech / Growth Index | BEARISH | −8 to −15% (0–90 days) | Growth stocks hit hardest by rising discount rates + margin compression. NASDAQ carries highest sensitivity to interest rate increases, which war-induced inflation drives higher. |
| Apple (AAPL)Consumer Tech / Discretionary | BEARISH | −10 to −18% | Luxury/discretionary spend falls in uncertainty; logistics costs rise; rising rates compress growth PE multiples. AAPL underperformed in every major conflict since Iraq 2003. Down 11% in Feb 2022. |
| LVMH / Luxury SectorConsumer Discretionary | BEARISH | −10 to −15% | Discretionary spending contracts in inflation + uncertainty environments. LVMH fell 12% in Q1 2003 Iraq War onset. Rising oil + potential recession = negative for aspirational spend. |
| Raytheon — RTXDefence / Aerospace | STRONG BUY | +20 to +35% | Direct war procurement beneficiary. RTX +30% (12m post-9/11), +25% Gulf War. Tomahawk cruise missile restocking alone is a multi-billion dollar contract. Ongoing air defence procurement accelerates. |
| Lockheed Martin — LMTDefence / Aerospace | STRONG BUY | +20 to +30% | F-35 deployment expansion; munitions contracts; F-35 lifecycle sustainment at $4.1 trillion. +35% during Gulf War. Geopolitical instability = structural demand uplift for at least 12–24 months. |
| Northrop Grumman — NOCDefence / Stealth / ISR | BUY | +15 to +25% | B-21/B-2 operations; intelligence/surveillance/reconnaissance platforms; cyber. +25% in 6-month window following Ukraine invasion. B-2 Spirit mission rate in Iran conflict = direct NOC revenue. |
| ITA / XAR (Defence ETFs)Diversified Defence Exposure | BUY | +15 to +30% | Lower single-stock risk than individual names. ITA/XAR held by investors seeking sector exposure without concentration. Outperformed S&P 500 by 25–40 percentage points in all five major post-1945 U.S. conflicts. |
| Energy ETF — XLEEnergy Sector Basket | CONDITIONAL BUY | 0 to +25% | Conditional on oil remaining $95+. Benefits directly while oil elevated. Reverses hard if recession destroys demand or ceasefire normalises supply. Monitor closely: this is not a set-and-forget position. |
Commodities & Oil
| Asset / Market | Direction | Projected Move | Evidence & Rationale |
|---|---|---|---|
| Crude Oil — Brent / WTISpot + Futures | BULLISH | +40–94% from pre-war | Hormuz risk premium + supply disruption. Ukraine 2022: +67% in 3 weeks. Iran specifically = structural supply shock given 20% of global supply at risk. $100–140/bbl baseline projection. |
| Oil — Demand Destruction RiskDownside Scenario | WATCH | Reversal at $140+ sustained | Historical pattern: demand destruction at extreme levels eventually overwhelms supply shock. Gulf War: $35 → $18/bbl in 3 months after ceasefire. Recession = demand collapse. Plan the exit. |
| Gold (XAU/USD)Spot + GLD ETF | STRONG BUY | $3,150–$3,500/oz | Every major conflict since 1945 drives gold higher. Structural central bank buying from China/Global South provides floor. Inflation + deficit combo = sustained uptrend, not just a spike. |
| Silver (XAG/USD)Inflation Hedge | BUY | +10 to +18% | Gold’s more volatile companion. Follows gold in war/inflation regimes with amplified percentage moves due to smaller market size. Dual industrial/monetary role provides additional demand support. |
| TIPS — Inflation-Linked BondsReal Rate Instrument | BUY | +3 to +8% real return | Best bond instrument in combined inflation + war scenario. Outperforms nominal Treasuries when CPI accelerates. Oil-shock inflation is exactly what TIPS are designed to hedge. |
Bonds & Currencies
| Asset / Market | Direction | Projected Move | Evidence & Rationale |
|---|---|---|---|
| 10-Year U.S. TreasuryBenchmark Rate | BEARISH (MEDIUM-TERM) | Yield +30–80bps | Initial safety bid (yields fall) reverses quickly as deficit financing = more supply. Ukraine: +200bps in 6 months. War supplemental = confirmed bond issuance acceleration. |
| Long-Duration Bonds (TLT)iShares 20+ Year Treasury | STRONG AVOID | −5 to −15% | Worst bond instrument in rising yield + inflation scenario. Vietnam era was catastrophic for long-duration holders. If inflation re-accelerates above 4%, TLT faces extended bear market conditions. |
| U.S. Dollar (DXY)Dollar Index | BULLISH (SHORT-TERM) | +3 to +6% (0–30 days) | Classic safe-haven. Post 9/11 DXY +3% briefly. Ukraine: +4.2% in 2 weeks. Medium-term reversal risk if inflation accelerates and fiscal credibility concerns mount. |
| Petrocurrencies — CAD, NOKOil-Linked Currencies | BULLISH | +3 to +8% | Canada and Norway are net oil exporters. Rising oil prices = improving current account balances = currency support. Structural outperformers in every war-oil price cycle. |
| EM Currencies — INR, TRY, EGPOil-Importing EMs | BEARISH | −5 to −15% | Oil-importing nations face current account deterioration + capital flight to USD. India, Turkey, Egypt most exposed. INR fell 4% in Ukraine war first two weeks. Iran conflict is even more geographically proximate. |
🚨 Key Market Triggers to Monitor — What Changes Everything
Critical Catalysts — Watch These Events Before Adjusting Any Position
What This Means for Traders and Investors: The Four-Point Playbook
The Iran war is not a single event. It is an evolving multi-front risk that is reshaping the probability distribution across every major asset class simultaneously. The five markets analysed in this report each face distinct, evidenced directional pressures that are unlikely to resolve quickly. Three things are clear from the historical record.
First: war onset is a near-term bearish shock for broad equities and a bullish shock for defence, oil, and gold — every time, without exception. Second: the medium-term trajectory is determined not by the war itself but by inflation. If the oil shock generates sustained CPI acceleration, all risk assets suffer in real terms and bonds bear the deepest structural damage. Third: resolution, when it comes, is a powerful bullish catalyst for the indices that sold off — provided fiscal damage has not already become structural.
📋 The Four-Point War Economics Playbook — Capital Street FX Research
The $11.3 billion disclosed by Pentagon officials is both accurate and incomplete. Accurate for six days of direct operations. Incomplete because it represents at most 15–20% of the conflict’s eventual fiscal burden when all costs are counted. Historical precedent across five major U.S. conflicts since 1945 is unambiguous: wars cost 4.5–6.5 times their direct military expenditure when veterans’ care, debt interest, opportunity costs, and macroeconomic damage are included.
For traders and investors, the war is already priced into some markets and not yet priced into others. Defence stocks are moving. Oil has moved. Gold is moving. Bonds have not yet fully repriced the supplemental issuance that is coming. Consumer discretionary and broad indices have not fully absorbed the margin compression that sustained $100+ oil implies.
The question is not whether this war will cost markets — it already has. The question is whether those who understand the mechanics of war economics will be positioned on the right side of those costs, or whether they will absorb them the way the untargeted consumer always does: invisibly, at the petrol pump and in the grocery aisle.
Every war since 1945 has ended. Every market has recovered. The investors who navigated those recoveries most successfully were not those who predicted the outcome of the conflict — they were those who understood the transmission channels from war spending to market performance, and positioned accordingly before the consensus caught up.
Every war begins with patriotic fervor and cost estimates nobody believes. Every war ends with casualty lists and bills that nobody can avoid paying. The Iran war is now 12 days old. The costs have already begun accumulating. The only question remaining — for governments, for markets, and for every participant in the global economy — is how large the final bill will be, and who will be holding it when it comes due.