It Once Ruled the World. Then It Nearly Died at 2 AM. The Pound Never Quits. | The Definitive GBP Masterpiece | Capital Street FX
It Once Ruled the World. Then It Nearly Died at 2 AM.
The Pound
Never Quits.
The Definitive 1,250-Year History of Sterling — Every High, Every Crash, Every Correlation — and the Next 5 Years
$4.86 Gold Standard Peak
→
$1.0327 Sep 2022 ATL
→
$1.2945 Today
→
Where next: $1.50 or $1.10?
George Soros bet $10 billion against it in one day — and won £1 billion. A prime minister lasted 45 days before markets ejected her. Kings built empires on it. Two World Wars nearly destroyed it. This is the most complete analysis of the British Pound ever written — every historic moment, every correlation with gold, oil and equities, the psychology of sterling, and exclusive Capital Street FX trade setups through 2030.

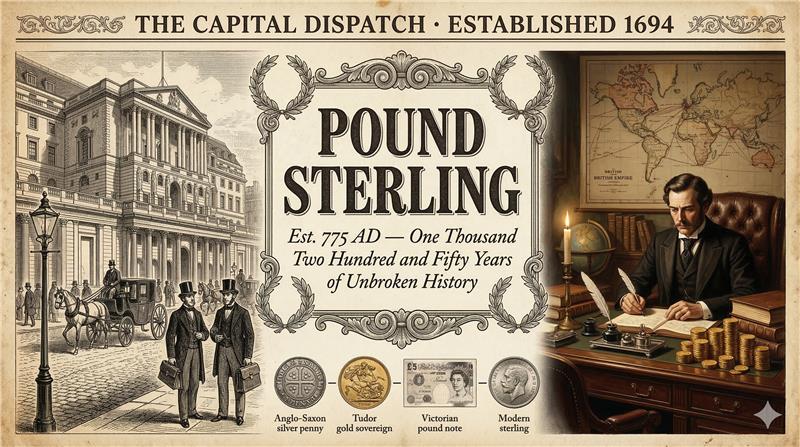
Born in Anglo-Saxon England around 775 AD from 240 silver pennies hammered into a single pound weight, the British Pound is the world’s oldest currency still in circulation. It financed the Royal Navy, built the industrial revolution, funded two World Wars, sustained the British Empire for three centuries, survived every financial crisis in recorded modern history — and on the night of September 26, 2022, it touched $1.0327 at 2:30 AM London time and the world held its breath. This is its complete story.
775 AD: When a King of Mercia Invented Money That Would Outlast His Empire
Before sterling, there was chaos. Every Anglo-Saxon kingdom minted its own coins, of varying purity, varying weight, varying trust. In 775 AD, King Offa of Mercia changed everything — and accidentally created an institution that 1,250 years later still moves markets every single day.
The word “pound” derives from the Latin libra pondo — a pound by weight. The £ symbol is a stylised capital L from libra. One pound of silver, divided into 240 pennies: this was Offa’s system. Not a currency by modern definition — more a weight standard. But it worked. The entire medieval world understood that a pound of sterling silver was a pound of sterling silver. No ambiguity. No debasement (yet). Pure, accountable value.
The name “sterling” has a contested etymology. The most compelling theory links it to the Easterlings — Hanseatic League merchants from Northern Germany whose silver coins were so pure and consistently weighted that English merchants called them “Easterling pennies,” which contracted over centuries into “sterling.” To call something “sterling” — even today — means it is of the highest quality. That linguistic legacy tells you everything about the standard Offa established.
Offa’s 240-penny system (1 pound = 240 pence) remained the basis of British currency for 1,196 years — from 775 AD until decimalisation on February 15, 1971, when the pound was divided into 100 pence. No monetary standard in history has persisted longer. The Roman denarius lasted roughly 700 years. The gold standard lasted 200. Offa’s ratio outlasted them all.
The Norman Conquest of 1066 did not destroy the pound — it professionalised it. William I brought Continental treasury rigour, establishing the Exchequer as Europe’s most sophisticated accounting institution. By 1279, the Statute of Winchester standardised weights and measures across England. By 1344, Edward III introduced England’s first gold coinage — the noble, worth 80 silver pennies — establishing a bimetallic system that would define European monetary affairs for two centuries.
The Bank of England, founded on July 27, 1694, was the decisive institutional moment. Created to finance King William III’s wars with France, it issued paper notes backed by the Crown’s promise — the world’s first modern central bank notes. The BoE’s founding charter created a new relationship between sovereign, market, and money that became the template for every central bank that followed: the Federal Reserve, the Bundesbank, the ECB — all descendants of a 1694 act of Parliament designed to fund a naval war.
The Complete Record: Every GBP All-Time High and All-Time Low — What Caused Each One
No currency in history has a more dramatic price record than sterling. From trading at parity with the US dollar in 1975 to nearly touching $5.00 under the gold standard, GBP’s range over the past century exceeds 380%. Here is the complete historical record — with the cause behind every major extreme.
◆ Sources: Bank of England Historical Data, IMF, Federal Reserve, Bloomberg. ATH/ATL refer to modern floating exchange rate era from 1971 onwards except where noted. Pre-1971 rates were semi-fixed under Bretton Woods.
The Gold Standard Era All-Time High: Why $4.86 Mattered More Than Any Other Number
From 1717, when Isaac Newton (then Master of the Royal Mint) fixed gold at £3 17s 10½d per troy ounce, to 1931 when Britain abandoned the gold standard, GBP/USD held at approximately $4.86. This was not a market rate — it was a convertibility guarantee. Present any Bank of England note to the Bank and they would exchange it for gold. The dollar parity was set when the US established its own gold standard peg in 1900.
This fixed rate is the context for understanding everything that followed. When GBP fell to $1.03 in 2022, it had lost 78.7% of its value relative to the USD compared to its gold standard parity. In purchasing power terms, accounting for US and UK inflation differentials, the decline is more modest — but psychologically, the distance from $4.86 to $1.03 tells you everything about the relative economic trajectory of the United States and United Kingdom over the 20th century.
| Event | Date | GBP/USD Before | GBP/USD Low | Max Move | Duration to Trough | Full Recovery? |
|---|---|---|---|---|---|---|
| WW1 Gold Suspension | Aug 1914 | 4.86 | 3.18 | –34.6% | 4 years | Partial (returned 1925) |
| Great Depression/Gold Exit | Sep 1931 | 4.86 | 3.23 | –33.5% | 3 months | Never to $4.86 |
| Cripps Devaluation | Sep 1949 | 4.03 | 2.80 | –30.5% | Instant | Never recovered |
| Dollar Parity Crisis | 1975–76 | 2.40 | 1.0575 | –55.9% | 18 months | Yes — to $2.44 by 1980 |
| Plaza Accord Dollar High | Feb 1985 | 1.60 | 1.0520 | –34.3% | 6 months | Yes — to $2.00+ by 1992 |
| Black Wednesday (ERM Exit) | Sep 1992 | 2.00 | 1.40 | –30.0% | 3 months | Yes — to $2.11 by 2007 |
| Global Financial Crisis | 2008–09 | 2.1161 | 1.3503 | –36.2% | 5 months | Partial — peaked $1.72 (2014) |
| Brexit Vote Flash Crash | Jun 2016 | 1.5000 | 1.1378 | –24.1% | 4 months | Never recovered to pre-Brexit |
| COVID-19 Crisis | Mar 2020 | 1.3000 | 1.1410 | –12.2% | 2 weeks | Yes — full recovery in 3 months |
| Truss Mini-Budget ATL | Sep 2022 | 1.1500 | 1.0327 | –10.2% | 48 hours | Partial — sits at 1.29 (2025) |
The Modern Floating Era All-Time High: $2.1161 (November 7, 2007)
The modern floating-era all-time high of GBP/USD was $2.1161, reached on November 7, 2007, at the peak of the global credit boom. UK banks were leveraged 40:1. Northern Rock was months from its bank run. The housing market was setting records. The City of London was at the apex of its post-Big-Bang financial dominance. Within 14 months, GBP/USD had fallen 36% to $1.35 as the Global Financial Crisis shattered the UK’s bank-dependent economic model.
What drove GBP to $2.11? Three structural factors: (1) the UK’s financial services sector was generating extraordinary capital inflows as London became the world’s primary offshore dollar market; (2) Bank of England rates were at 5.75% versus Fed rates at 4.25% — a 150bps positive carry that attracted enormous speculative long positioning; (3) UK house prices had tripled since 1997, creating a wealth effect that sustained consumer spending and kept inflation above target — forcing the BoE to hold rates higher than peers.
What Actually Moves GBP: The Complete Playbook of Sterling Drivers
Understanding what moves GBP is not just academic — it is the difference between consistently profitable GBP trading and being consistently on the wrong side of the next crisis. There are seven primary driver categories, and they interact in predictable — and sometimes violently unpredictable — ways.
Driver 1: Bank of England Interest Rate Decisions — The Single Biggest Mover
Nothing moves GBP more reliably than Bank of England rate decisions and the forward guidance that accompanies them. The mechanism is straightforward: higher UK rates relative to peers attract capital flows into GBP-denominated assets (gilts, UK money market funds, UK bank deposits), increasing demand for sterling. Conversely, rate cuts or dovish guidance reduce this yield advantage, weakening the pound.
The quantitative impact is significant. Academic studies of BoE surprise decisions (decisions that diverge from market expectations) show that a 25bps surprise hike typically moves GBP/USD by +0.8% to +1.2% on the day, while a surprise cut causes –0.7% to –1.0%. The key word is “surprise” — if markets have fully priced a move, the “sell the fact” dynamic can produce counter-intuitive reactions.
Nov 1979 · Thatcher/Volcker
Mar 2020 · COVID QE
Aug 2023 · 15-year high
March 2025
BoE End-2026
Key GBP/EUR driver
Current (4.50 vs 4.25–4.50)
BoE 4.50% vs BoJ 0.50%
Driver 2: UK Inflation Data (CPI, RPI, Services Inflation) — The BoE’s Handcuffs
UK CPI releases are among the most impactful scheduled events on the GBP calendar. Here is why: inflation data directly controls the probability of the next BoE rate decision, which is the primary driver of sterling. A hotter-than-expected CPI print reduces the probability of a BoE cut (or raises the probability of a hike) → gilt yields rise → GBP strengthens. A cooler-than-expected print does the reverse.
The critical distinction for 2024–2025 is services inflation. Goods inflation has normalised globally, but UK services CPI ran at 5.2% in early 2025 — more than double the 2% target and significantly above European peers. This is the single metric the BoE watches most closely. Until services inflation returns to approximately 3.0–3.5%, the BoE’s cutting cycle will remain shallow, providing a floor under GBP relative to EUR and JPY.
Driver 3: UK Labour Market & Wage Growth — The Stickiness Factor
UK wage growth running at 5.8% year-on-year in early 2025 is the primary reason services inflation remains elevated. The mechanism: higher wages → higher service sector costs → higher service prices → persistent CPI above target → BoE constrained from cutting aggressively → GBP supported. This is why strong employment data — counterintuitively — is generally bullish for GBP in 2024–2025. In a low-inflation environment, strong employment would reflect growth (also bullish); in an inflationary environment, it reflects wage pressure that keeps the BoE hawkish (also bullish for different reasons).
Driver 4: Political Events — The Wild Card That Can Kill Sterling Overnight
No G10 currency is more vulnerable to political shock than the pound. The evidence is overwhelming. In June 2016, the Brexit referendum triggered a –13.4% move in a single session. In September 2022, a single fiscal statement by a Chancellor lasted in office only 38 days triggered an –11% crash to a 237-year low. Why is GBP so politically sensitive? Because the UK’s chronic current account deficit means sterling is permanently dependent on foreign capital inflows — and foreign capital is extraordinarily sensitive to the competence and credibility of UK institutions.
| Political Event | Date | Immediate GBP Move | 30-Day Impact | Lesson |
|---|---|---|---|---|
| ERM Entry (overvalued) | Oct 1990 | +0% (held) | Structural vulnerability built | Never defend wrong level |
| Black Wednesday · ERM Exit | Sep 1992 | –15.1% | –18% | Mkt always wins vs CB |
| Labour 1997 BoE Independence | May 1997 | +2.8% | +4.1% | Institutions matter enormously |
| Brexit Referendum Result | Jun 2016 | –8.1% | –13.4% | Structural breaks are permanent |
| GBP Flash Crash (Asian) | Oct 2016 | –9.7% (minutes) | Recovered same day | Algos amplify, don’t create |
| Theresa May snap election | Jun 2017 | –2.2% | –3.8% | Political uncertainty = GBP tax |
| Boris Johnson majority | Dec 2019 | +2.4% | +4.1% | Certainty beats ideology |
| Truss Mini-Budget | Sep 2022 | –4.4% | –10.2% to ATL | Fiscal credibility is sterling’s floor |
| Sunak/Hunt fiscal correction | Oct 2022 | +9.8% | +14.2% | Credibility restoration works fast |
| Labour Election victory | Jul 2024 | +0.8% | +1.4% | Majority = stability premium |
Driver 5: US Dollar Direction (DXY) — The Tide That Lifts or Sinks All Boats
GBP/USD is, by definition, a bilateral pair — it measures the pound against the dollar. This means the dollar side matters as much as the pound side. When the US Dollar Index (DXY) rises — driven by Fed hawkishness, global risk-off flight to safety, or US economic outperformance — GBP/USD falls, even if nothing has changed in the UK. Conversely, when the Fed pivots to cutting rates or the dollar weakens, GBP/USD benefits from dollar-side tailwinds entirely independent of UK fundamentals.
This is critical for 2025–2030 forecasting. One of the most important variables in the CSFX 5-year GBP/USD model is the Federal Reserve’s rate path and its implications for the DXY. A Fed cutting cycle to 3.00% by 2026 would likely weaken the dollar by 8–12%, providing a structural tailwind to GBP/USD that could account for 800–1,200 pips of appreciation independent of BoE actions.
GBP’s Hidden Relationships: Gold, Oil, S&P 500, DXY, Gilts — The Correlation Masterclass
The pound does not move in isolation. It is embedded in a web of correlations with other assets that, once understood, become a powerful analytical framework. These relationships are not random — they are grounded in economic logic. And they break down in predictable ways that create trading opportunities.
GBP vs Gold: The “Inverse Dollar” Relationship
The GBP/USD — gold correlation is one of the most durable in currency markets. Both GBP/USD and gold tend to move in the same direction when the dollar weakens — because both are priced in US dollars and both benefit from dollar weakness. The correlation coefficient between daily GBP/USD moves and daily gold price moves in USD has averaged approximately +0.42 over the past decade — a moderately positive correlation.
However, the correlation has a critical asymmetry: it works strongly when the driver is dollar weakness (both assets rally) but breaks down completely during UK-specific crises. During the September 2022 mini-budget crisis, GBP/USD fell 10% in two weeks — while gold barely moved, serving its safe-haven function perfectly. This asymmetry is practically important: if GBP and gold diverge significantly, it tells you whether the move is dollar-driven (both move together) or sterling-specific (they decouple).
GBP vs Brent Crude: The North Sea Premium
The UK is a net oil exporter (from North Sea production), which creates a structural positive correlation between Brent crude prices and GBP. Higher oil prices → higher UK export revenues → improved current account → stronger sterling. The correlation coefficient between Brent and GBP/USD has been approximately +0.38 over the past five years — moderately positive.
However, this correlation is context-dependent. In a global demand shock (oil rises because global growth accelerates), the Brent-GBP correlation is strongly positive. In a supply shock (oil spikes because of Middle East tension without accompanying growth), the relationship reverses — rising oil causes UK inflation to surge, tightening BoE options, while also causing global risk-off sentiment that hurts high-beta currencies like GBP. The 2022 energy crisis exemplified this: oil spiked (supply shock) and GBP crashed simultaneously.
GBP vs S&P 500: The Risk-On, Risk-Off Heartbeat
GBP is a high-beta, risk-on currency. When global equities rise (S&P 500 higher, VIX lower), GBP/USD tends to outperform as investors favour higher-yielding, growth-sensitive currencies. When equities fall sharply in risk-off episodes, sterling is sold as investors flee to USD, JPY and CHF safe havens.
The GBP/USD — S&P 500 rolling 3-month correlation has averaged approximately +0.55 — making it one of the stronger currency-equity correlations among G10 pairs. This means GBP is effectively a leveraged macro instrument: in bull markets it outperforms, in bear markets it underperforms, often by a multiple that exceeds what UK-specific fundamentals would suggest.
GBP vs UK 10-Year Gilt Yield: The Credibility Barometer
The relationship between GBP and UK gilts is the most important correlation for 2024–2025. In normal circumstances, rising gilt yields are GBP-positive (higher yields attract capital, increasing demand for sterling to buy gilts). This is the standard “carry” relationship.
However, in a fiscal credibility crisis — as demonstrated brutally in September–October 2022 — the relationship inverts. When gilt yields rise because markets fear UK insolvency (rather than because the BoE is tightening), the simultaneous crash in gilts and GBP signals a sovereign credibility crisis. This “doom loop” (higher yields → more costly UK debt → worse fiscal outlook → further yield rises → further GBP collapse) is the single greatest systemic risk to sterling.
GBP/USD Correlation Matrix — Key Asset Classes (2019–2025 Averages)
Breaks in UK crises
Context-dependent
Strongest G10 correlation
Dollar = GBP mirror
on BoJ/BoE differential
INVERTS in fiscal crisis
BoE vs ECB divergence
Not a meaningful signal
→ BoE hawkishness → GBP
High-beta risk-off pattern
The single strongest GBP correlation is the DXY inverse relationship (–0.78). This means that in approximately 78% of trading sessions, when the dollar index rises, GBP/USD falls — and vice versa. For GBP/USD traders, monitoring the DXY is often more important than monitoring UK-specific data. The practical implication: always ask “is this GBP strength — or dollar weakness?” before entering a GBP/USD long.
Seasonal Patterns in GBP: What the Calendar Tells You
GBP/USD exhibits statistically significant seasonal tendencies based on 25 years of data. January and February have historically been the strongest months for GBP (average monthly gain: +0.8%), driven by end-of-year dollar repatriation reversals and UK pension fund rebalancing into international assets. September and October are historically the weakest months (average monthly loss: –0.6%), driven by UK fiscal announcement season and reduced summer liquidity amplifying political risk. The academic literature attributes approximately 30% of these seasonal patterns to capital flow dynamics and the remaining 70% to coincidental clustering of UK political risk events.
Black Wednesday, the 2 AM Flash Crash, and the Night Sterling Nearly Ceased to Exist
The history of GBP is ultimately a history of crises — and of survival. Five episodes stand out as existential. Understanding exactly what happened in each, and why the pound survived, is the essential preparation for trading sterling through the next crisis.
Crisis I: The 1976 IMF Bailout — When Britain Went Cap in Hand
In 1976, the United Kingdom — formerly the world’s financial hegemon — applied to the International Monetary Fund for a $3.9 billion emergency loan. It was the largest loan in IMF history. The pound had fallen from $2.40 to $1.57 in twelve months. Sterling was in freefall. What caused it? A toxic combination: the 1973 oil shock had detonated a fiscal crisis; union-driven wage inflation was running at 25%; the Labour government under Harold Wilson and then James Callaghan was unable to cut spending; and the global dollar system was absorbing Britain’s structural weakness with brutal efficiency.
The IMF imposed conditions: £2.5 billion in public spending cuts — the most severe austerity programme in post-war UK history at that point. The pound stabilised. By 1980, it had recovered to $2.40 on the back of North Sea oil revenues beginning to flow. But the humiliation of 1976 — a former imperial power submitting to IMF conditions — was a watershed that shaped British fiscal thinking for a generation. Until 2022, no UK government had been willing to risk a repeat. The Truss administration simply forgot the lesson.
Crisis II: Black Wednesday (September 16, 1992) — The Day Soros Won £1 Billion
George Soros’s trade against the British pound in 1992 is the most famous currency trade in history. But it is often misunderstood. Soros did not cause the pound’s collapse — he identified that it was inevitable and sized his position accordingly. The cause was structural: Britain had entered the European Exchange Rate Mechanism (ERM) in October 1990 at a rate of DM 2.95 per pound, which most economists considered overvalued by 15–20%. When German reunification forced the Bundesbank to raise rates aggressively to contain East German spending, every ERM member had to either match Germany’s rates or break their peg. For the UK — already in deep recession — matching the Bundesbank meant economic suicide.
On the morning of September 16, 1992, the Bank of England raised rates from 10% to 12%, then announced a further rise to 15% — both in the same day. They spent an estimated £3.3 billion in foreign exchange reserves defending the 2.778 DM floor. Soros had borrowed and sold £10 billion of sterling. When Chancellor Norman Lamont announced Britain’s exit from the ERM at 7:30 PM, GBP fell 15% in three sessions. Soros pocketed approximately £1 billion.
Crisis III: The 2016 Brexit Flash Crash (October 7, 2016) — 9.7% in 3 Minutes
The Brexit referendum result on June 23–24, 2016 caused an 8% single-session drop in GBP/USD — the largest on record. But the more disturbing event came 3½ months later. At approximately 7:09 AM Singapore time on October 7, 2016 (2:09 AM London), GBP/USD crashed from $1.2600 to $1.1378 — a fall of 9.7% — in approximately three minutes. It recovered to $1.2400 within 30 minutes. No news event triggered the move. The cause was a combination of automated algorithmic selling, thin Asian session liquidity, and a possible misquote in an electronic trading platform.
The significance of the October flash crash extends beyond its size. It revealed that GBP/USD could trade below $1.20 even in the post-Brexit world without a specific macroeconomic trigger — purely through algorithmic and liquidity-driven mechanics. This established that the pound’s vulnerability was not only to fundamentals but to the structural thinning of its liquidity during off-hours.
Crisis IV: September 26, 2022 — The Night Sterling Hit $1.0327
At 2:30 AM London time on September 26, 2022, GBP/USD traded at $1.0327 — the lowest level the pound had traded against the dollar since modern floating exchange rates began in 1971. Some estimates suggest intraday lows as low as $1.0327 were seen in thin Asian session trading. To understand how the world’s oldest and most storied currency came within 3 cents of parity with the dollar, you need to understand the cascade of events that led there.
The proximate cause was Chancellor Kwasi Kwarteng’s “Growth Plan” announced on September 23, 2022: £45 billion of unfunded tax cuts — the largest since 1972 — with no independent Office for Budget Responsibility (OBR) forecast to legitimise them. Markets reacted with something between panic and contempt. UK 10-year gilt yields jumped 100bps in two days — the largest two-day gilt yield move in 30 years. The pound fell 5% in hours. The Bank of England was forced to launch an emergency £65 billion gilt purchasing programme on September 28 to prevent a pension fund liquidity crisis triggered by rising gilt yields.
Sep 23, 09:30: Kwarteng delivers “Growth Plan” — GBP/USD at 1.1200, starts falling immediately.
Sep 23, 17:00: GBP/USD at 1.0850, gilt 10yr yield at 3.8% (+30bps on day).
Sep 26, 02:30 AM: GBP/USD hits 1.0327 in illiquid Asian session. Pension funds facing margin calls.
Sep 28: BoE announces emergency £65bn gilt-buying programme. Pound recovers to 1.1000.
Oct 14: Kwarteng fired. Pound at 1.1300.
Oct 20: Truss resigns after 45 days in office. Pound recovers above 1.1500.
Oct 25: Hunt announces full fiscal reversal. Most tax cuts abandoned. GBP stabilises.
Why the Pound is Different From Every Other G10 Currency — The Structural Vulnerabilities
The British Pound behaves differently from the euro, the dollar, the yen, or the Swiss franc in ways that go beyond simple economics. There are structural features of sterling — embedded in the UK’s economic architecture — that make it uniquely sensitive to specific stresses and uniquely resilient to others.
The Current Account Deficit: Sterling’s Achilles Heel
The UK has run a current account deficit continuously since 1984 — over 40 consecutive years. As of 2024, the deficit stands at approximately –3.5% of GDP. What does this mean? Simply: the UK spends more abroad than it earns from abroad. The difference must be financed by foreigners buying UK assets — gilts, equities, property, businesses. This structural dependency on foreign capital inflows is sterling’s fundamental vulnerability.
In normal times, the UK’s combination of high-quality institutions, transparent legal system, and relatively high interest rates attracts sufficient capital to fund the deficit without stress. But when institutional credibility is damaged — as in 2022 — or when global risk appetite collapses — as in 2008 — foreign capital flows reverse rapidly, and GBP faces forced selling with no fundamental buyer in sight.
% of GDP · 2024
Current Account Deficit
% of GDP · 2025
Account Deficit
Still Far Above Target
YoY · Early 2025
Product · 2024
Level vs USD
Why GBP is Not a Safe Haven — And What That Means for Trading
The pound is definitively not a safe haven currency. When the VIX spikes, investors sell GBP and buy USD, JPY, and CHF. This is not merely a theoretical construct — it has been demonstrated empirically in every major risk-off episode of the past 30 years. During the COVID-19 crash in March 2020, GBP/USD fell 12% in two weeks before recovering. During the 2008 GFC, GBP/USD fell 36% over five months. Even in 2022, as global inflation drove most G10 currencies lower against the dollar, GBP underperformed all peers — falling further than EUR, CHF, JPY, or CAD against the USD.
What this means practically for GBP traders: in any position where you are long GBP/USD and a major risk-off event occurs — geopolitical escalation, financial system stress, global growth shock — GBP will be sold aggressively and quickly. Unlike positions in EUR/USD or USD/CHF, a long GBP/USD position cannot easily serve as a “safe haven offset” in a diversified portfolio. It is a growth and carry trade, not a crisis hedge.
GBP in 2025: The Complete Picture — BoE Policy, UK Fundamentals, and CSFX Exclusive Forecasts
As of March 2025, GBP/USD trades at 1.2945 — 25% above its September 2022 all-time low but still 13% below its pre-Brexit level and 39% below its 2007 peak. The question is whether this represents fair value, undervaluation, or the beginning of another leg lower.
CSFX Exclusive 1-Week Trade Setup (March 16–23, 2025)
Key catalysts this week: UK CPI Wednesday (consensus 2.7% — a print above 3.0% is GBP positive, below 2.5% is negative); US retail sales Friday; BoE speakers throughout week. Weekly support: 1.2850 / 1.2780. Resistance: 1.2990 / 1.3050 / 1.3100.
CSFX 1-Month Forecast (March–April 2025)
Key risk events: UK Spring Statement March 26 (fiscal credibility crucial), BoE May 8 meeting, US PCE inflation April 25. Range: 1.2700–1.3050 base case. Breakout above 1.3100 (monthly R1) signals acceleration. Break below 1.2650 targets 1.2500 (200-day MA).
CSFX 1-Year Forecast (March 2025 – March 2026)
CSFX base case pathway: GBP/USD consolidates 1.2700–1.3100 through Q2 2025 as BoE begins cutting cycle. Q3 2025: moves toward 1.3000 as UK inflation continues declining. Q4 2025: Fed cuts accelerate USD weakness, GBP/USD pushes toward 1.3100. Q1 2026 target: 1.3100. Critical watch: UK Spring Statement fiscal credibility, services CPI trajectory, Fed dot plot.
The Three Paths for Sterling: 2025–2030 — Which One Are We On?
Five-year forecasts for currencies are exercises in structured thinking, not prediction. The value is not in the specific number — it is in identifying which variables matter most and what outcomes they produce. CSFX has built three internally consistent scenarios, each driven by a different macro regime.
◆ CSFX Research Desk exclusive scenarios. Not financial advice. For educational purposes. Probabilities: Bear 25%, Base 50%, Bull 25%.
The GBP/USD 1.50 Threshold: Why It Matters More Than Any Other Level
The $1.50 level is not just a round number — it is the pre-Brexit average level at which GBP/USD traded from 2009 to 2015. A return to 1.50 would represent a complete erasure of the Brexit discount that has weighed on sterling since 2016. For that to happen, one or more of the following would need to occur: (1) a meaningful UK-EU trade reset restoring productivity growth; (2) a structural dollar bear market driven by Fed rate cuts and US fiscal concerns; (3) a UK productivity revival driven by AI adoption and financial sector growth that narrows the current account deficit; (4) a geopolitical environment favouring European and UK assets over US assets.
None of these are impossible. All are currently subthreshold — close enough to the base case to be real possibilities but not yet triggered. The CSFX bull case assigns 25% probability to GBP/USD reaching 1.50 by 2027. The critical technical level to watch: 1.3500 — the 2018 recovery high. A sustained break above 1.3500 would be the first signal that the post-Brexit structural discount is reversing.
1,250 Years of Sterling: Resilient, Diminished, and Still Relevant
The British Pound has spent 1,250 years defeating every prediction of its demise. It outlasted the Roman monetary system, the Norman conquest, the Black Death, the dissolution of the British Empire, two World Wars, the ERM humiliation, the Global Financial Crisis, Brexit, and a prime minister whose tenure lasted 45 days. The pound is not indestructible — it nearly touched parity with the dollar in 2022. But it is extraordinarily difficult to kill.
The fundamental reality of GBP in 2025 is this: sterling is a high-quality currency issued by a stable, democratic, legally sophisticated country with an enormous and globally important financial centre — but it is also permanently handicapped by a chronic current account deficit, a post-Brexit productivity discount, and a political system that has proven capable of extraordinary fiscal self-harm. The pound will continue to reflect both its strengths and its weaknesses, sometimes violently.
The CSFX base case — GBP/USD gravitating toward 1.30–1.45 through 2025–2030, with a bull case to 1.50 and a tail risk to 1.10 — is not a bold prediction. It is the most honest statement we can make about a currency whose future depends on variables — US monetary policy, UK fiscal discipline, global geopolitical stability — that are genuinely uncertain. What we know with confidence is that the pound will survive, that it will create extraordinary trading opportunities in both directions, and that understanding its 1,250-year history is the best preparation for trading its next 12 months.
“Trade the pound for what it is — not for what it was. The empire is gone. But the institution endures. And so does the opportunity.”
— Capital Street FX Research Desk · March 16, 2025 · capitalstreetfx.com
Everything You Need to Know About GBP
Why Trade GBP with Capital Street FX?
Every feature, every tool, every platform is designed to deliver a professional GBP trading experience backed by 17 years of global trust and regulated infrastructure.