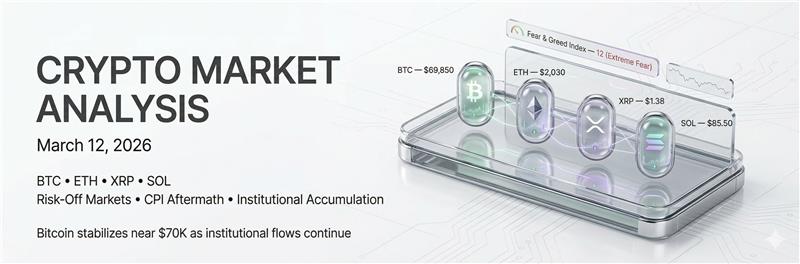
Crypto Market Analysis — March 12, 2026 | BTC · ETH · XRP · SOL | Capital Street FX
Crypto Market Analysis
March 12, 2026

Executive Summary & Market Snapshot
Thursday, March 12, 2026 finds the crypto market holding its ground in a compressed, risk-off environment shaped by three major forces: persistent Middle East geopolitical tension (Strait of Hormuz), the aftermath of Wednesday’s US CPI print, and ongoing institutional accumulation near the $70K Bitcoin level.
Wednesday’s February CPI data came in broadly at consensus — reported at 2.4% YoY — avoiding the feared above-2.6% stagflation scenario. Markets briefly exhaled, and Bitcoin reversed overnight losses to reclaim $70K before softening again into Thursday’s Asian session. The relief is partial: no Fed rate cut is priced for either March or April 2026, keeping the macro ceiling firmly in place.
The standout institutional development this week: Strategy Inc. confirmed the purchase of over 17,000 BTC at an average of $70,946, bringing their total treasury to a record 738,731 BTC. Separately, Arkham Intelligence flagged that BlackRock moved ~2,200 BTC ($149M) and ~2,417 ETH ($4.8M) to Coinbase — a move that signals ongoing custodial activity but also introduces near-term liquidity risk for both assets.
The Strait of Hormuz crisis continues to suppress risk appetite globally. Oil (WTI) remains elevated in the $95–$110/bbl range following Iranian drone strikes on the Ras Tanura refinery and reduced Iraqi/Kuwaiti output. Prediction markets currently assign a 72% probability that oil hits $120 before end of March — a scenario that historically delivers a double-blow to crypto via tighter monetary expectations and risk-off capital flight.
Top Crypto News — Last 10 Hours
| Time / Source | Headline | Impact | Bias |
|---|---|---|---|
| ~02:00 UTC CoinDesk | Bitcoin reverses overnight losses above $70K as oil renews decline CPI print in line with 2.4% forecast; no April rate cut priced. BTC staged intraday reversal from $69,200 low back above $70,500. | HIGH | ▲ Bull |
| ~04:30 UTC Arkham/BSCN | BlackRock transfers 2,200 BTC ($149M) & 2,417 ETH to Coinbase Large custodial movement flagged by Arkham Intelligence. Institutional activity signals continued market engagement; short-term liquidity risk for both assets. | HIGH | ⚠ Watch |
| ~06:00 UTC Investing.com | Strategy Inc. confirms 738,731 BTC total after buying 17,000+ BTC at ~$70,946 MicroStrategy parent signals ~$70K as “fair value zone.” Corporate treasury BTC accumulation narrative reinforced at current levels. | HIGH | ▲ Bull |
| ~07:15 UTC Investing.com | Bitcoin “hovering at $70K amid rangebound trading” as Hormuz conflict persists Risk-off macro backdrop caps upside. Geopolitical premium priced into energy markets spills into crypto via reduced risk appetite. | HIGH | ▼ Bear |
| ~09:00 UTC The Block | US Digital Asset Market Clarity Act (CLARITY Act 2026) advances toward a vote Defines SEC vs. CFTC jurisdiction for digital assets. XRP among the most sensitive to any positive regulatory development. Act passage would remove primary regulatory overhang. | HIGH | ▲ Bull (XRP) |
| ~10:00 UTC Motley Fool | Bitcoin 44% below Oct 2025 ATH; analysts debate bull correction vs. new bear market River Financial cites long-term holder profit-taking. Weekly RSI near historical oversold bottoms. Five consecutive red monthly closes since Oct 2025. | MED | ▼ Bearish Context |
| ~11:00 UTC CoinGecko | Total crypto market cap at $2.45T; DeFi volume $9.47B (9.43% of total) Stablecoin volume at $99.3B (98.9% of total market volume) — a sign of heavy risk-off positioning and flight to USD-pegged assets. | MED | ▼ Bear (Sentiment) |
Economic Calendar — High Impact Events Today
Thursday’s calendar is moderately active following Wednesday’s pivotal US CPI print. The key risk event remaining is the February PPI release and weekly Initial Jobless Claims at 08:30 ET — both capable of reshaping Fed rate expectations. For global markets, watch Japan’s trade data and ECB member speeches for Eurozone direction signals.
| Time (UTC) | Country | Event | Impact | Previous | Forecast | Crypto Relevance |
|---|---|---|---|---|---|---|
| 00:50 | 🇯🇵Japan | Trade Balance (Jan) | MED | ¥−2.70T | ¥−2.40T | JPY strength = mild risk-off pressure |
| 01:30 | 🇦🇺Australia | Unemployment Rate (Feb) | HIGH | 4.1% | 4.2% | RBA policy pivot signal; AUD-correlated assets |
| 07:00 | 🇬🇧UK | GDP Monthly Estimate (Jan) | HIGH | +0.1% | +0.1% | Sterling volatility; global risk sentiment barometer |
| 07:00 | 🇬🇧UK | Industrial Production (Jan) | MED | −0.7% | +0.2% | Secondary signal for UK economic trajectory |
| 09:00 | 🇪🇺Eurozone | Industrial Production (Jan) | HIGH | −1.1% | +0.5% | ECB rate path signal; EUR volatility impacts risk sentiment |
| 13:30 | 🇺🇸USA | 🔴 PPI (Feb) — MoM | HIGH ★ | +0.3% | +0.3% | CRITICAL: Hot PPI = rate cut delay = bearish BTC |
| 13:30 | 🇺🇸USA | 🔴 Initial Jobless Claims | HIGH ★ | 221K | 225K | Labour weakness = rate cut narrative = short-term bullish |
| 14:00 | 🇨🇳China | Industrial Production YoY (Feb) | HIGH | +5.4% | +5.3% | China macro health signals for global risk appetite & BTC mining |
| 14:00 | 🇨🇳China | Retail Sales YoY (Feb) | HIGH | +3.7% | +4.0% | Consumer strength in China = positive risk-on globally |
| Throughout | 🇪🇺ECB | ECB Member Speeches (Lane, Nagel) | MED | — | Dovish lean | Any rate cut hint = EUR-positive, mild crypto tailwind |
The US February PPI + Jobless Claims double-print at 13:30 UTC is today’s most critical catalyst window. With CPI already in at 2.4% (consensus), a PPI above +0.4% MoM would revive stagflation fears and likely send BTC below the $68K level. A PPI at or below +0.2% combined with claims above 235K could trigger a short-covering rally toward $72,000. Position sizing carefully around 13:00–14:30 UTC.
BTC · ETH · XRP · SOL — Full Setups

| Current Price | $69,850 |
| Immediate Resistance | $71,000 – $71,500 |
| Major Resistance | $74,100 – $74,800 |
| ATH Zone | $126,073 (Oct 2025) |
| Immediate Support | $67,000 – $68,000 |
| Critical (H&S neck) | $65,600 |
| Bear Target (neck break) | $59,500 |
| Cycle Low (Feb 2026) | $63,000 |
| Trend (Daily) | Bearish — Lower Highs |
| Trend (4H) | Tentative Recovery |
| 200-Day EMA | ~$72,600 (Price Below) |
| 50-Day EMA | Falling — ~$71,800 |
| 4H 50 MA | Rising — ~$68,500 |
| Weekly RSI | 27 — Extreme Oversold |
| Daily RSI | ~38 (Approaching OS) |
| MACD (Daily) | Negative — Not Crossed |
| Volume (24h) | $31.26B — Declining |
| Spot ETF Holdings | $88B+ (6% of supply) |
Bitcoin is in a technically corrective phase from its $126,073 ATH — now 44.6% down and printing five consecutive red monthly candles (Oct 2025 – Feb 2026). This is the defining bear argument.
The bull case: Weekly RSI at 27 has preceded major recoveries in every prior cycle. Institutional positioning remains intact ($88B in spot ETFs), and Strategy’s $70K accumulation sends a strong floor signal. The market is not in structural collapse — it’s in a painful but historically normal post-halving correction.
The deciding line is $65,600. Above it: range trade. Below it: new lows territory opens.

| Current Price | $2,030 |
| Bull Pivot (Must Reclaim) | $2,150 |
| Major Resistance | $2,300 – $2,400 |
| 200-Day EMA | ~$2,450 (Price Well Below) |
| Immediate Support | $1,950 – $2,000 |
| Strong Support | $1,800 – $1,850 |
| Bear Target | $1,600 (if $1,800 breaks) |
| Trend (Daily) | Bearish — Record 6-Month Red Streak |
| Trend (Weekly) | Bearish — Below All Major MAs |
| All EMAs (20/50/100/200) | Price Below All — Bearish Alignment |
| Daily RSI | ~35 — Near Oversold |
| MACD (Daily) | Recovering, No Bullish Cross Yet |
| Whale Accumulation | 100K–10M ETH wallets: Buying |
| ETH Market Share | ~60% Stablecoin + DeFi + RWA |
| BitMine Holdings | 4.4M ETH (~$7.4B unrealised loss) |
Ethereum’s technical picture is the weakest of the four pairs — but its fundamental narrative is strengthening in contradiction. With 60% dominance in stablecoins, DeFi, and tokenized RWAs, and a Glamsterdam upgrade roadmap active, the asset is building a structural case even as price suffers.
The critical headwind: BitMine Immersion Technologies holds 4.4M ETH with an estimated $7.4B unrealised loss. Any distress selling from this position would constitute a major supply event. Watch this carefully.
A daily close above $2,150 would be the first genuine sign bulls are back in control.

| Current Price | $1.38 |
| Immediate Resistance | $1.40 – $1.44 |
| Strong Resistance | $1.50 |
| CLARITY Act Bull Target | $1.80 – $2.00 |
| Immediate Support (50 EMA) | $1.33 – $1.35 |
| Critical Support | $1.30 |
| Bear Target (below $1.30) | $1.10 – $1.15 |
| Trend (Daily/Weekly) | Bearish — Lower Highs |
| Trend (1H) | Rising Channel (Short-Term) |
| RSI (Daily) | ~44 — Neutral to Bearish |
| 50 EMA (1H) | Rising — Key Dynamic Support |
| Exchange Balances | −57% Decline (Bullish Supply) |
| XRP ETF Inflows | $1.3B+ (US-Listed) |
| Macro Sensitivity | Highest Binary Risk (4 Pairs) |
XRP holds the most binary risk profile of the four majors. Its fundamental picture is constructive — Ripple’s XRPL payments network is gaining enterprise traction, US-listed XRP ETFs have attracted over $1.3B in inflows, and exchange balances have declined 57% (a structural bullish signal for supply).
However, the CLARITY Act (defining SEC vs. CFTC jurisdiction) remains the single largest unresolved catalyst. Any positive legislative signal would be disproportionately bullish for XRP given current positioning. Today’s Capitol Hill activity is worth monitoring closely.

| Current Price | $85.50 |
| Immediate Resistance | $90 – $92 |
| Major Resistance | $95 – $100 |
| Bull Confirmation Break | $100 (psychological) |
| Immediate Support | $82 – $83 |
| Strong Support | $78 – $80 |
| Cycle Low (Feb 2026) | $70 |
| Trend (Daily) | Bearish (macro) |
| Trend (4H) | Bullish — 50 MA Rising |
| 200-Day MA (4H) | Rising Since 05 Mar 2026 |
| RSI (4H) | ~55 — Recovering |
| Price vs. 4H 50 MA | Above — Bullish |
| Volatility (30-day) | 3.45% |
| SOL ETF Flows | Net Positive (vs. BTC/ETH outflows) |
| Developer Inflows ’25 | #2 After ETH — 11,500+ Devs |
Solana is the most structurally constructive setup among the four pairs this week. Three converging factors: (1) a textbook rounding bottom off the $70 February low, (2) dedicated Solana ETF products attracting net positive inflows while BTC and ETH ETF equivalents face redemptions, and (3) the 4H 200-day moving average began rising on March 5, 2026.
SOL also led the March 1 recovery with a 10.8% bullish engulfing day and ranks #2 after ETH for developer inflows with over 11,500 active developers. The Alpenglow upgrade (targeting 100ms finality) adds a long-term fundamental catalyst for H1 2026.
Four Pairs — Complete Summary Matrix
| Pair | Price | 24h Chg | Daily Trend | Key Pattern | Support | Resistance | RSI (D) | Bias |
|---|---|---|---|---|---|---|---|---|
| BTC/USDT | $69,850 | −0.87% | Bearish | H&S + 4H Rising Ch. | $67,000 | $71,000 | ~38 | Caution |
| ETH/USDT | $2,030 | −0.59% | Bearish | Demand Zone Bounce | $1,950 | $2,150 | ~35 | Accumulate |
| XRP/USDT | $1.38 | −1.26% | Neutral | BB Squeeze + 1H Channel | $1.33 | $1.44 | ~44 | Wait/Watch |
| SOL/USDT | $85.50 | −1.68% | Recovery | Rounding Bottom + Asc. Tri. | $82.00 | $92.00 | ~55 | Bullish Bias |
| Pair | Entry Zone | TP1 | TP2 | Stop Loss | R/R | Conviction |
|---|---|---|---|---|---|---|
| BTC Long | $67,000–68,200 | $71,500 | $74,100 | $65,400 | 1:2.3 | Medium |
| ETH Long | $1,950–$2,010 | $2,150 | $2,300 | $1,895 | 1:2.1 | Lower |
| XRP Long | $1.40–$1.42 (BO) | $1.50 | $1.65 | $1.33 | 1:1.9 | Catalyst-Dep. |
| SOL Long ★ | $82–$83.50 | $92–$100 | $108–$112 | $78.50 | 1:2.6 | Highest |
Frequently Asked Questions
A Market Holding Its Breath
Waiting for the Next Catalyst
March 12, 2026 finds the crypto market in a state of compressed tension. Bitcoin is anchored near $70,000 — supported by institutional buyers who see this as fair value, but capped by a macro environment that offers no room for speculative excess. The CPI print delivered relief on Wednesday; today’s PPI will either sustain it or reignite fears.
The four major pairs each tell a distinct story. BTC is defending a critical technical floor. ETH is underperforming but accumulating smart money below the surface. XRP is coiling ahead of a binary catalyst that could unlock one of the year’s biggest single-session moves. And Solana — carrying the strongest technical structure and the most constructive institutional flow data — looks like the cleanest long setup in the space right now.
For active traders: respect the macro ceiling, trade the setups that exist (not the ones you wish for), and scale into the PPI catalyst window with reduced size. The next directional impulse will likely define the rest of Q1 2026.