Crypto Market Report — BTC/USD, ETH/USD, DOGE/USD, SOL/USD | Capital Street FX Research Desk · April 2, 2026
Iran War Risk & $285M Drift Hack Slam Crypto
BTC, ETH, SOL & DOGE Slide Into Extreme Fear
Intraday crypto market analysis with exact entry prices, Fibonacci targets, stop-loss levels, and candlestick pattern confirmation for Bitcoin, Ethereum, Solana, and Dogecoin — everything a day trader needs before the next candle closes.
4 Live Crypto Trades — Enter Right Now
Exact entries, targets, and stops. All four tokens in a confirmed bearish structure — sell bounces at Fibonacci resistance and capture the move.
What Intraday Crypto Traders Need Before the Next Candle
All four tokens are printing confirmed bearish structures on the daily and 4H charts today. Risk-off macro conditions combined with the Drift Protocol $285M DeFi exploit have pushed BTC, ETH, SOL, and DOGE below key Fibonacci resistance levels. Each setup has a clearly defined entry zone, a Fibonacci-based target, and a hard stop-loss. This is not a narrative play — these are precise intraday levels for day traders and scalpers to work with right now.
Crypto Market — Current 24H Prices
Live cryptocurrency prices as of the European session, April 2, 2026. All prices from the Capital Street FX ALTX platform.
Session Recap — What Moved the Charts & Set Up Today’s Trades
The Asian crypto session was dominated by two simultaneous shocks. First, Trump’s overnight address confirmed continued Iran military operations without ceasefire — removing the de-escalation trade that had lifted crypto in the prior session. Bitcoin opened near $68,186 and sold off steadily through the Asian session, reaching a low of $66,180 before stabilizing.
The second and more Solana-specific catalyst was the Drift Protocol $285M hack, confirmed on April 1 but fully reported and understood by Asian session open. Blockchain analysts identified the attack as using “durable nonces” — a legitimate Solana feature — to pre-sign administrative transfers weeks in advance. SOL fell 9% to an intraday low of $78.60, the steepest loss among the top 10 crypto assets, as the Drift DRIFT token collapsed over 40%.
Ethereum ETF outflows extended to a seventh consecutive day (total $392.1 million in that streak), adding institutional sell pressure on ETH. The Kimchi premium in South Korea remained at a muted 0.75-0.82% — confirming Asian retail was in wait-and-see mode rather than panic capitulating. BTC dominance climbed to 56.1% as the crypto market rotated toward the relative safety of Bitcoin during the dual-catalyst selloff.
DOGE fell −3.17% in line with the broader meme coin selloff. Narrative-driven assets are always the first to be liquidated when macro fear spikes — and today’s dual catalysts provided ample reason for meme coin holders to reduce risk.
European traders opened to a crypto market already digesting two major negative catalysts. Bitcoin showed a mild recovery attempt to $67,339 as Iran signaled cooperation with Oman on a Strait of Hormuz management protocol — a modest de-escalation signal that trimmed some of the overnight panic. However, the recovery was shallow: BTC remained well below the critical 0.236 Fibonacci level at $69,171.
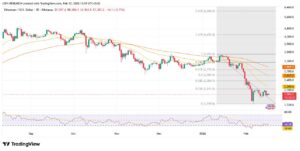
Ethereum continued to underperform despite the mild market bounce, trading near $2,028-$2,060. The combination of seven consecutive days of ETF outflows, the Ethereum Foundation’s ongoing narrative challenges, and on-chain analysis showing declining developer activity all weigh on ETH sentiment. Prediction markets now price an 81% probability of ETH falling below $1,750 — a sobering signal for the crypto market’s second-largest asset.
Solana’s recovery was even more muted — trading at $78.13 with no meaningful bounce above $80 as European institutional traders assessed the full scope of the Drift Protocol damage. Twelve Solana-based protocols were affected, several pausing operations as precautionary measures. The Chaikin Money Flow index for SOL showed a negative reading of -0.04, confirming institutional capital outflow. Spot SOL ETF inflows were zero for the ninth straight day prior to the hack.
The Circle USDC controversy — ZachXBT’s on-chain evidence that millions in stolen USDC were bridged from Solana to Ethereum during business hours without intervention — added a regulatory overhang to the crypto market that resonated particularly with institutional participants in the European session.
The US session opens with the crypto market in “flow-driven and headline-sensitive” mode — to borrow GSR analyst Slater Santer’s exact framing. Three catalysts converge in the next four hours that will determine whether today’s bearish crypto market extends or finds a temporary floor: Initial Jobless Claims at 12:30 GMT, ISM Services PMI at 13:45 GMT, and Fed’s Williams remarks at 14:30 GMT.
A weak ISM (below 51.0) combined with high Jobless Claims would revive Fed rate cut hopes, weakening the dollar and providing a relief bounce for Bitcoin from the $65,000-$66,000 support zone. This is the most bitcoin-positive short-term scenario in the crypto market — not because BTC fundamentals improve, but because dollar weakness and rate cut expectations historically correlate with crypto relief rallies.
Metaplanet (Japan) recently acquired 5,075 BTC, leaping to third largest corporate bitcoin treasury. This institutional demand story provides a structural floor narrative even in the current selloff. Bitcoin treasury companies have been under pressure with BTC down 24% in Q1 2026 — some firms are liquidating reserves to service debt, which creates sell-side flow that the Metaplanet purchases partially offset.
The US prior session (April 1) ended with stocks rising and USD trimming losses on stronger data — but that move was fully reversed by Trump’s overnight address. The US session today starts from a reset bearish baseline in the crypto market. Watch for derivatives data: CoinDesk reports traders are “piling into bearish bets” — a sign of momentum continuation rather than exhaustion at these levels.
On-Chain Fundamentals & Macro Drivers
Iran War — Crypto’s Macro Headwind: The 2026 Iran war has had a paradoxical effect on the crypto market. Initially, crypto outperformed as a “lightly owned” asset that benefited from the novelty of conflict-driven safe-haven bids. But as GSR’s Slater Santer notes, “as more concrete and persistent concerns about economic impacts have materialized, it’s not surprising to see crypto struggling as well.” The oil shock feeds directly into inflation expectations, which delays Fed rate cuts, which strengthens the dollar, which pressures crypto. BitMine Chairman Tom Lee described it succinctly: “The inverse correlation of crypto to oil is at the highest levels in the past year.” Today’s WTI at $104 is a direct headwind for the crypto market’s risk appetite.
Drift Protocol $285M Hack — DeFi’s Worst 2026 Moment: The exploit stands as the crypto market’s largest DeFi breach of 2026 and the second largest in Solana’s history after the 2022 Wormhole hack ($320M). The attacker used a compromised admin multisig key and “durable nonces” — a legitimate Solana blockchain feature — to pre-sign administrative transfers weeks before execution, bypassing Drift’s Security Council multisig in minutes. Eleven coordinated transactions drained 87% of Drift’s TVL — from $309M to $41M. North Korean hackers (Lazarus Group) are suspected based on cross-chain laundering patterns identified by Elliptic. The crypto market implications extend beyond SOL: any DeFi protocol using similar admin structures across all blockchains has seen a re-rating of security risk.
Bitcoin Dominance & Institutional Dynamics: BTC dominance at 56.1% reflects the crypto market’s flight to quality within the asset class. Bitcoin ETF inflows have remained “comparatively resilient” (CoinDesk) relative to ETH ETFs. Metaplanet’s 5,075 BTC purchase this week confirms institutional accumulation continues beneath the surface. However, the broader picture is challenging: some corporate bitcoin treasury holders and sovereign entities are liquidating reserves as prolonged price consolidation pressures their balance sheets. Bitcoin is on track to close Q1 2026 down more than 24% — the worst quarterly performance since 2022. Derivatives data shows hedge fund drawdowns at their worst since Q1 2022.
Ethereum’s Structural Challenge: ETH faces the most complex fundamental picture in the crypto market right now. The Fusaka upgrade has attracted criticism for “weakening tokenomics by collapsing fee revenues and enabling spam transactions.” ETH dominance at a near-record-low 10.4% has pushed Polymarket’s probability of ETH losing its #2 market cap ranking in 2026 to 59% — up from 17% in January. Seven consecutive days of ETF outflows totaling $392.1 million confirm institutional de-risking. The structural bear case: Ethereum Layer 2 solutions are cannibalizing L1 fee revenue, and Solana’s developer ecosystem — despite the Drift hack — continues attracting capital with superior throughput metrics.
Regulatory Clarity — A Positive Undercurrent: On March 23, the SEC and CFTC issued their first joint interpretive guidance, creating a clear taxonomy for crypto assets. SOL was explicitly classified as a “digital commodity” — not a security — placing it under CFTC oversight. Bitcoin and Ethereum already had this clarity. This regulatory development is structurally positive for the crypto market long-term but is not driving price action in today’s dual-catalyst risk-off environment. The expected CLARITY Act signing and a growing pipeline of crypto ETF applications (Bitwise forecasts 100+ new crypto-linked ETFs in 2026) represent the medium-term institutional infrastructure that would support a recovery.
Solana Ecosystem — Alpenglow on the Horizon: Despite the Drift hack, Solana’s underlying network metrics remain impressive: $57 billion in DEX volume in March 2026, record stablecoin transaction volume, and the Alpenglow consensus upgrade in development (targeting 150ms finality). DEX volume has dipped to $55.5B in March from higher levels, but Solana still surpasses all Layer 1 and Layer 2 networks. The SEC’s classification of SOL as a digital commodity removes a major regulatory headwind. The Drift hack is an ecosystem-specific shock, not a network failure — and the crypto market will likely distinguish between the two once the initial panic subsides.
Token-by-Token Breakdown — Entry Zones, Targets & Candle Confirmation
Institutional Pressure vs. Structural Support: Bitcoin is absorbing competing forces. On the bear side: Q1 2026 down 24%, some corporate treasury liquidations for debt service, oil-driven macro headwinds suppressing risk appetite, and derivatives data showing institutional traders piling into bearish bets. On the bull side: ETF inflows remain relatively resilient, Metaplanet’s 5,075 BTC purchase confirms continued institutional accumulation, and long-term holders continue accumulating at these levels. The crypto market for Bitcoin is in a classic “maximum fear / maximum long-term opportunity” setup reminiscent of late-2022.
Halving Cycle Context: Bitcoin’s April 2024 halving reduced block rewards to 3.125 BTC. The 12-18 month post-halving window has historically been Bitcoin’s strongest period — but the 2026 Iran war energy shock and “higher for longer” Fed posture have delayed the typical post-halving rally. Bitwise predicts BTC ETFs will buy more than 100% of annual new supply — a structural supply squeeze that hasn’t yet manifested in price due to the macro headwinds. The crypto market is effectively fighting a medium-term structural bull case against a near-term macro bear environment.
Treasury Company Dynamics: Public companies holding Bitcoin on their balance sheets face a “price compression doom loop” — lower BTC prices force mark-to-market losses, which pressure balance sheets, which can trigger forced selling, which pushes prices lower. This is a real but contained risk: most major bitcoin treasury holders (MicroStrategy, Metaplanet, MARA) have long-dated debt structures that don’t force liquidation at current prices.
Daily Chart — 10-Week Descending Channel: Bitcoin has been locked in a descending channel from the $98,769 Fibonacci 1.0 base since mid-January 2026. The channel has respected both upper and lower boundaries across 10+ weeks, making it one of the most durable bearish structures in the current crypto market. Price has progressively worked through the Fibonacci retracement levels from the top: 0.786 ($90,478) was the first major breakdown, followed by 0.618 ($85,970), 0.5 ($79,399), 0.382 ($74,827), and now consolidating around 0.236 ($69,171) after breaching it intraday.
Critical Level — 0.236 Fib ($69,171): This is the most important technical level for the Bitcoin crypto market right now. Current price at $66,263 is already below this level — a confirmed break. The Fibonacci 0.0 extension at $60,029 is the next major structural support and the level analysts are watching as the “ultimate bear test” that would confirm whether the bull cycle from 2024 remains intact or has structurally broken.
Weekly Context: On the weekly chart, Bitcoin is approaching the bottom of the descending channel, which intersects with the Fibonacci 0.0 support zone at $60,029 over the next 2-3 weeks. A weekly close below $60,029 would be the most significant bearish signal in the crypto market since the 2022 bear cycle low. Conversely, a weekly close back above $69,171 (0.236 Fib) would be the first meaningful bullish signal in 10 weeks.

Sequential Fibonacci Breakdowns — Bearish Acceleration: Bitcoin’s descent from the $98,769 high has followed the Fibonacci structure with remarkable precision. Each level has served as a temporary pause before the next breakdown — 0.786, 0.618, 0.5, 0.382, and now below 0.236. The crypto market is watching whether this is an acceleration into a climactic bottom or a controlled distribution to even lower levels. The fact that each breakdown has been accompanied by a bearish engulfing candle on the daily chart — where a large red body fully engulfs the prior session’s range — confirms institutional selling at each Fibonacci level rather than passive drift lower.
Doji Formation at Base Zone: In the $64,000-$67,000 zone, multiple doji and spinning top candlestick patterns have appeared on the daily chart — signalling indecision and potential accumulation. These patterns at a structural base (the Fibonacci 0.0 at $60,029 is 9% lower) suggest that buyers are beginning to emerge, but without the conviction to reverse the dominant downtrend yet. The crypto market needs to see a bullish engulfing or morning star pattern on the daily chart above the $60,029 level to confirm a structural bottom is in place.
RSI Approaching Oversold: The daily RSI at approximately 35 is approaching the oversold threshold of 30. In Bitcoin’s 2022 bear cycle, RSI reached oversold twice before the final bottom — and each time produced a 20-30% relief bounce before the ultimate low. In the current crypto market, an RSI bounce from oversold could produce a recovery to $72,000-$74,827 (0.382 Fib) before the trend reasserts lower. Trade bounces accordingly.
| Level Type | Price (USD) | Basis | Significance |
|---|---|---|---|
| All-Time High / Fib 1.0 | $98,769 | Jan 2026 Swing High | Ultimate recovery target — major resistance |
| Strong Resistance | $79,399 | Fib 0.5 + Channel Upper | Midpoint — reclaim needed to shift bias |
| Resistance Zone | $69,171 – $70,000 | Fib 0.236 + Psychological | S/R flip — former support now resistance |
| Current Price | $66,263 | — | Below 0.236 Fib — bearish momentum |
| Immediate Support | $64,000 – $65,000 | Doji Base Zone / Round Number | Accumulation zone — multiple doji formed |
| Critical Support | $60,029 | Fib 0.0 / January 2026 Low | Ultimate bear test — breakdown = structural break |
| Psychological | $50,000 | Round Number / 2024 Support | Extreme scenario — cited by Bloomberg analyst |
ETH’s Perfect Storm: Ethereum is navigating the most challenging fundamental environment in the crypto market in 2026. The combination of macro headwinds (Iran war, high oil, “higher for longer” Fed), structural competitive pressure (Solana L1 dominance, ETH L2s cannibalizing L1 fees), institutional outflows (7 consecutive days of ETF outflows totaling $392.1M in that streak), and narrative deterioration (Polymarket at 59% probability ETH loses #2 market cap ranking) has created a uniquely bearish setup.
ETF Flow Crisis: Ethereum spot ETFs recording seven consecutive days of outflows is the most concerning institutional signal in today’s crypto market. The last comparable streak preceded ETH’s December 2025 drop from $3,221 to $2,995. Current conditions are more dire: price is already at $2,028 and prediction markets are pricing 81% probability of sub-$1,750. A drop to $1,457 would liquidate $323.3 million in leveraged longs on Hyperliquid alone — a potential cascade that the crypto market risk managers are acutely aware of.
The Fusaka Upgrade Controversy: Critics argue the Fusaka upgrade “weakened tokenomics by collapsing fee revenues and enabling spam transactions” — a fundamental shift that has undermined one of ETH’s core value propositions. As Ethereum L2s successfully route volume away from L1, the ETH burn mechanism generates less deflationary pressure, reducing the investment thesis for ETH holders in the current crypto market.
Daily Chart — Descending Channel Below All Key Fibs: Ethereum has broken below every Fibonacci retracement level from its $3,252 swing high. The descent from $3,252 to the current $2,028 represents a 37.6% decline in 10 weeks. The daily chart shows a clean descending channel with lower highs and lower lows — one of the most technically confirmed bearish structures in the crypto market. Current price at $2,028 is below the 0.236 Fibonacci at $2,058 and approaching the critical $1,750 (Fib 0.0 base) structural support.
The $2,058 Level — Critical S/R Flip: The 0.236 Fibonacci at $2,058 has been violated on a closing basis — a critical development. This former support has now become resistance, and any intraday bounce into $2,058-$2,100 represents a high-probability selling zone for the crypto market’s most bearish major token.
Multi-Timeframe Bearish Confirmation: On the weekly timeframe, Ethereum is approaching its longest losing streak in 2026. On the 4-hour chart, every rally attempt has been capped by a combination of descending trendline resistance and EMA resistance (price is below EMA 20, 50, and 200 on all timeframes). The Bollinger Bands show price at the lower band — suggesting short-term mean reversion risk, but in the context of a strong trend, lower-band rides can persist for extended periods.

Today’s Bearish Engulfing: The most significant candle formation in the Ethereum crypto market today is the bearish engulfing that is forming on the daily chart as ETH breaks below the 0.236 Fibonacci at $2,058. A large red candle that engulfs the prior session’s entire range while simultaneously closing at a new recent low is the highest-conviction continuation signal in candlestick analysis — it confirms that sellers are overwhelmingly in control and the prior session’s bulls have been completely absorbed.
Death Cross Confirmed: Ethereum’s EMA 20 has crossed below EMA 50 on the daily chart — a classic death cross formation in the crypto market. Death crosses have historically preceded extended downtrends and are watched as a sentiment indicator by both technical traders and quantitative algorithms. The death cross combined with the descending channel and sequential Fibonacci breakdowns creates a triple-confirmation bearish setup.
The $1,750 Structural Decision: At the Fibonacci 0.0 base at $1,750, the crypto market for Ethereum faces its most important candlestick test of 2026. If price reaches this level with a hammer, dragonfly doji, or bullish engulfing candle, it would be a high-probability reversal signal for medium-term accumulation. Without such a reversal signal, the prediction market’s 68% probability of sub-$1,500 becomes increasingly relevant.
| Level Type | Price (USD) | Basis | Significance |
|---|---|---|---|
| Strong Resistance | $2,555 – $2,600 | Fib 0.618 + Descending Channel | Key sell zone on any recovery |
| Resistance Zone | $2,058 – $2,100 | Fib 0.236 — S/R Flip | Former support, now resistance — sell bounces |
| Current Price | $2,028 | — | Below 0.236 Fib — bearish confirmed |
| Immediate Support | $1,900 – $1,950 | Round Number + Channel Lower | Nearest intraday support level |
| Critical Support | $1,750 | Fib 0.0 / Structural Base | Must hold — 81% predict sub-$1,750 on Polymarket |
| Liquidation Cascade | $1,457 | Hyperliquid Data | Would liquidate $323M in longs — cascade risk |
| Psychological | $1,500 | Round Number | 68% Polymarket probability — extreme bear |
The Drift Hack — Idiosyncratic vs Systematic: The critical distinction for the crypto market is whether the Drift hack is an isolated protocol-level failure or evidence of a systemic Solana vulnerability. Security analysts are clear: this was not a Solana network bug. The “durable nonces” feature used by the attacker is a legitimate, documented Solana functionality. The failure was in Drift’s admin key management — a governance failure, not a blockchain failure. This distinction matters enormously for SOL’s recovery timeline once the initial panic subsides.
Institutional Flow Collapse: Spot SOL ETFs had recorded zero inflows for nine consecutive days before the hack. Post-hack, the probability of any meaningful institutional inflow in the near term is negligible. Circle’s failure to freeze the stolen USDC during the hack (per ZachXBT’s on-chain evidence) has added a stablecoin infrastructure risk narrative that will take time to resolve in the crypto market.
Structural Strengths Intact: Despite today’s chaos, Solana’s fundamentals remain strong. $57B in March DEX volume (record). SEC/CFTC explicitly classified SOL as a digital commodity (not a security). Alpenglow consensus upgrade in development targeting 150ms finality. BitGo’s new institutional lending platform using SOL as collateral. These structural positives will re-emerge as catalysts once the hack-related selling exhausts itself in the crypto market.
Daily Chart — Descending Parallel Channel: Solana has been tracking a descending parallel channel on the daily chart since mid-March, printing consistent lower highs and lower lows. The channel was already in place before the Drift hack — the hack has simply accelerated the existing downtrend rather than creating a new structure. Current price at $78.13 is testing the 0.236 Fibonacci retracement at $80.758, which has now become resistance after the breakdown through that level.
Fibonacci Structure: SOL’s Fibonacci retracement from the $128 swing high to the $66.09 base shows the token has now broken below the 0.236 level ($80.76) on both the daily chart and multiple 4H closes. The sequence of Fibonacci failures (0.618 at $104.50, 0.5 at $97.17, 0.382 at $89.83, and now 0.236 at $80.76) mirrors the Bitcoin structure — a controlled distribution to the Fibonacci base ($66.09) in a descending channel. The $75 support (Murrey Math Lines alignment) is the next key floor ahead of the $66.09 base.
Moving Average Death Sequence: The Chaikin Money Flow at -0.04 confirms institutional capital outflow. Price has fallen below all major EMAs (20, 50, 200). The descending channel’s lower boundary is near $72-$73 currently, meaning SOL has room to extend losses before reaching the channel floor in the crypto market.

Hack-Driven Volume Surge as Bearish Signal: On April 1-2, SOL trading volume surged 198% (per DRIFT token data) — an extreme volume spike coinciding with a price decline is one of the clearest bearish signals in the crypto market. High-volume breakdowns are more durable than low-volume ones because they reflect genuine selling conviction rather than thin liquidity moves. The combination of volume spike + price decline + channel breakdown + negative CMF creates a four-factor bearish confirmation rarely seen in isolation.
Bearish Marubozu Continuation: The March-to-April 2026 SOL decline has been characterized by a sequence of bearish marubozu candles — full-bodied red candles with minimal wicks — confirming that sellers have met no meaningful buyer resistance at any price point during the decline. This pattern is the most powerful momentum continuation signal in candlestick analysis for the crypto market. The lack of lower wicks on bearish marubozu candles tells you buyers are not stepping in during intraday weakness — they’re waiting for lower prices.
$75 Watch Level: The next key support area for SOL in the crypto market is $75 — aligned with the Murrey Math Lines pivot level identified by analysts. A hammer candle or bullish pin bar at $75 with a close above $77 would be the minimum reversal signal to neutralise the immediate bearish momentum. A break below $75 with a strong bearish candle would open the $66.09 Fibonacci base as the near-term target.
| Level Type | Price (USD) | Basis | Significance |
|---|---|---|---|
| Strong Resistance | $93 – $97 | Fib 0.382 + Channel Upper | Key sell zone for any hack-recovery bounce |
| Resistance Zone | $80.76 – $82 | Fib 0.236 — S/R Flip | Former support, now resistance — sell bounces here |
| Current Price | $78.13 | — | Below 0.236 Fib — bearish momentum |
| Immediate Support | $75.00 | Murrey Math Lines Pivot | Key technical floor — watch for reversal signal |
| Channel Lower | $72 – $73 | Descending Channel Lower | Short-term target on continuation |
| Critical Support | $66.09 | Fib 0.0 / Swing Base | Primary bear target — structural support |
| Recovery Signal | $93 | Former Resistance | Reclaim = hack narrative cooling, trend shift |
Meme Coins — First In, First Out: Dogecoin’s role in the crypto market has always been as a sentiment barometer: it surges most aggressively during retail euphoria and falls first and fastest during institutional risk-off episodes. Today’s combination of Iran war macro fear and the Drift hack’s DeFi contagion narrative has triggered exactly the kind of “flight to quality within crypto” that sees DOGE liquidated in favor of BTC. As one veteran analyst noted: “In a tight, cautious economic environment defined by geopolitical stress and high interest rates, narrative assets are the first to be liquidated.”
Elon Musk Catalyst Fading: The DOGE narrative that powered the 2021 and early-2025 rallies has materially weakened. Musk’s DOGE Department of Government Efficiency lost political momentum, reducing the token’s policy-driven speculative premium. Without a fresh Musk catalyst, DOGE in the current crypto market is trading on pure sentiment — which is firmly negative. The token is essentially glued to the $0.088-$0.093 range with no fundamental catalyst to break it higher.
No On-Chain Catalyst: DOGE has no meaningful on-chain development, staking mechanism, or DeFi ecosystem to provide fundamental support during periods of market weakness. Unlike BTC (institutional ETF demand), ETH (DeFi infrastructure), or SOL (DEX dominance), DOGE’s utility case in the crypto market is limited to payment speculation and Musk-adjacent narratives — neither of which is active today.
Daily Chart — Bearish Range Compression: DOGE has been trading in a compressing range since early February, oscillating between the 0.236 Fibonacci at $0.09013 (resistance) and the $0.07868 Fibonacci 0.0 base (support). The descending channel’s upper boundary has progressively capped every recovery attempt, while the base support has held on multiple tests. Current price at $0.08870 is below the 0.236 Fibonacci resistance, confirming the near-term bearish bias.
Fibonacci Compression: DOGE’s Fibonacci retracement from $0.12717 (Fib 1.0 swing high) to $0.07868 (Fib 0.0 base) shows price has been grinding between the 0.236 ($0.09013) and 0.0 ($0.07868) levels for over two months. This tight range compression in the crypto market typically resolves with a breakout — either a catalyst-driven spike above $0.09013 (meme/Musk news) or a sustained break below $0.07868 if macro conditions deteriorate further.
RSI Declining: The RSI on the daily chart is declining from mid-range toward oversold territory. The Stochastic oscillator has crossed bearish below 50. In a meme coin without a narrative catalyst, declining momentum indicators in the crypto market typically precede a grind toward the lower support rather than a recovery — DOGE is positioned to test $0.07868 if macro fear persists.

Repeated Rejection at 0.236 Fibonacci: DOGE’s crypto market structure over the past two months is defined by a series of rejections at the 0.236 Fibonacci level at $0.09013. Each attempt to break above this level has been met with a bearish spinning top or shooting star — both indicating buyer exhaustion at resistance. The most recent rejection occurred in mid-March, and today’s −3.17% decline is bringing price back toward the base support zone. In the context of the descending channel, these rejections confirm that the supply/demand balance in the DOGE crypto market strongly favors sellers at current resistance levels.
Bearish Range Exhaustion: When a price trades in a tight range (as DOGE has between $0.07868 and $0.09013 for 8+ weeks), the candlestick patterns within the range often provide the clearest directional signal. The predominance of spinning tops, doji, and small-bodied candles near the top of the range, combined with the descending channel structure, suggests that the energy within the crypto market for DOGE is building for a downside break rather than an upside one. The lack of any strong bullish candle (bullish engulfing or bullish marubozu) in 8 weeks is a powerful absence of evidence for the bull case.
The Binary Musk Risk: Unlike BTC, ETH, and SOL, DOGE carries a binary narrative risk that must be acknowledged. A single Elon Musk tweet, policy announcement, or social media engagement with DOGE could override all technical analysis and produce a 20-50% spike in minutes. This is both the token’s unique opportunity and its greatest risk as a tradeable instrument in the crypto market. Size DOGE positions accordingly — smaller than BTC/ETH/SOL — and always maintain a defined stop-loss.
| Level Type | Price (USD) | Basis | Significance |
|---|---|---|---|
| Strong Resistance | $0.10865 | Fib 0.618 + Channel Upper | Major recovery target — requires Musk catalyst |
| Resistance Zone | $0.09013 – $0.09200 | Fib 0.236 + Descending Channel | 8-week rejection zone — sell bounces here |
| Current Price | $0.08870 | — | Below 0.236 Fib — bearish near-term |
| Support Zone | $0.08500 – $0.08700 | Round Number + Intraday Demand | Near-term cushion before base test |
| Critical Support | $0.07868 | Fib 0.0 / Range Base | Must hold — break below = new bear structure |
| Downside Extension | $0.07000 | Psychological Round Number | Below $0.07868 — next major support |
Execute Today’s Intraday Crypto Setups
with Capital Street FX
Four live entries. Exact Fibonacci levels. Tight stops. Capital Street FX gives intraday crypto traders the speed, leverage, and spreads to trade these setups the moment a confirmation candle closes.
BTC at $66,263 and ETH at $2,028 require significant margin per contract at standard brokerages. CSFX’s 900% fully tradable bonus amplifies your effective capital — trade the full BTC short from $67,800 to $60,500 without tying up your entire account in a single crypto market position.
Today’s Intraday Catalysts — Know Before the Candle Closes
Scheduled events that will move BTC, ETH, SOL, and DOGE intraday today. Times in GMT — plan your entries and exits around these windows.
| GMT | Asset | Event | Forecast | Previous | Actual | Impact |
|---|---|---|---|---|---|---|
| LIVE | 🪙 SOL | Drift Protocol $285M Hack — Ongoing Recovery | — | — | Active | Hack |
| 12:30 | 🇺🇸 USD | Initial Jobless Claims | 220K | 224K | Pending | High |
| 13:45 | 🇺🇸 USD | ISM Services PMI (Mar) | 53.0 | 53.5 | Pending | High |
| 14:00 | 🇺🇸 USD | Factory Orders MoM (Feb) | −0.5% | +1.7% | Pending | Med |
| 14:30 | 🇺🇸 USD | Fed’s Williams — Rate & Inflation Remarks | — | — | Pending | High |
| Ongoing | 🪙 BTC | Bitcoin ETF Daily Flow Print | +$100M est. | +$117.6M | Pending | Med |
| Ongoing | 🪙 ETH | Ethereum ETF Daily Flow (Day 8 Streak) | Outflow | −$55M est. | Pending | High |
| 23:50 | 🇯🇵 JPY | BoJ Meeting Minutes (Yen / Carry Trade) | — | — | Pending | High |
Intraday Trader FAQ — Crypto Market, April 2, 2026
Today’s crypto market is defined by two simultaneous shocks that will take days to fully absorb. Trump’s hawkish Iran address removed the de-escalation trade, and the Drift Protocol $285M hack — the year’s largest DeFi exploit — has added a Solana-specific contagion narrative on top of the macro headwinds. The result is a crypto market where all four tokens are trading lower, BTC dominance is rising to 56.1% as capital consolidates in the relative safety of Bitcoin, and the Fear & Greed index has moved firmly into “Extreme Fear” territory.
The structural picture: Bitcoin is in a 10-week descending channel below its 0.236 Fibonacci level, with the $60,029 base as the ultimate bear test. Ethereum is down 37.6% from its February high, with prediction markets pricing 81% odds of sub-$1,750. Solana is absorbing the direct hit of the DeFi hack while also suffering macro risk-off. Dogecoin is grinding toward the $0.07868 base with no catalyst to reverse the meme coin in a fear-dominated crypto market. The dominant trade is clear: sell bounces at Fibonacci resistance levels.
Catalysts for the next 24 hours: ISM Services at 13:45 GMT and Jobless Claims at 12:30 GMT today will pre-position the crypto market for tomorrow’s NFP. A weak ISM + high Claims would revive Fed cut hopes and produce relief bounces across all four tokens — use those bounces as short entries. A strong ISM would confirm “higher for longer” and extend the bearish crypto market regime. The Drift compensation plan announcement from the Drift team is the wildcard for SOL — a credible recovery plan could trigger meaningful short-covering.
Medium-term positioning: The crypto market’s structural bull case (BTC ETF absorption exceeding new supply, Solana DEX dominance, regulatory clarity, institutional adoption accelerating) remains intact for Q3-Q4 2026. But the near-term path runs through the Iran war resolution and a Fed pivot — neither of which is imminent. The late-2022 bottoming pattern analogy (BTC dominance rising, fear at extremes, institutional accumulation beneath the surface) suggests maximum long-term opportunity is building — but timing that requires patience that most active traders don’t have. Trade the current bearish structure until the charts confirm a reversal.