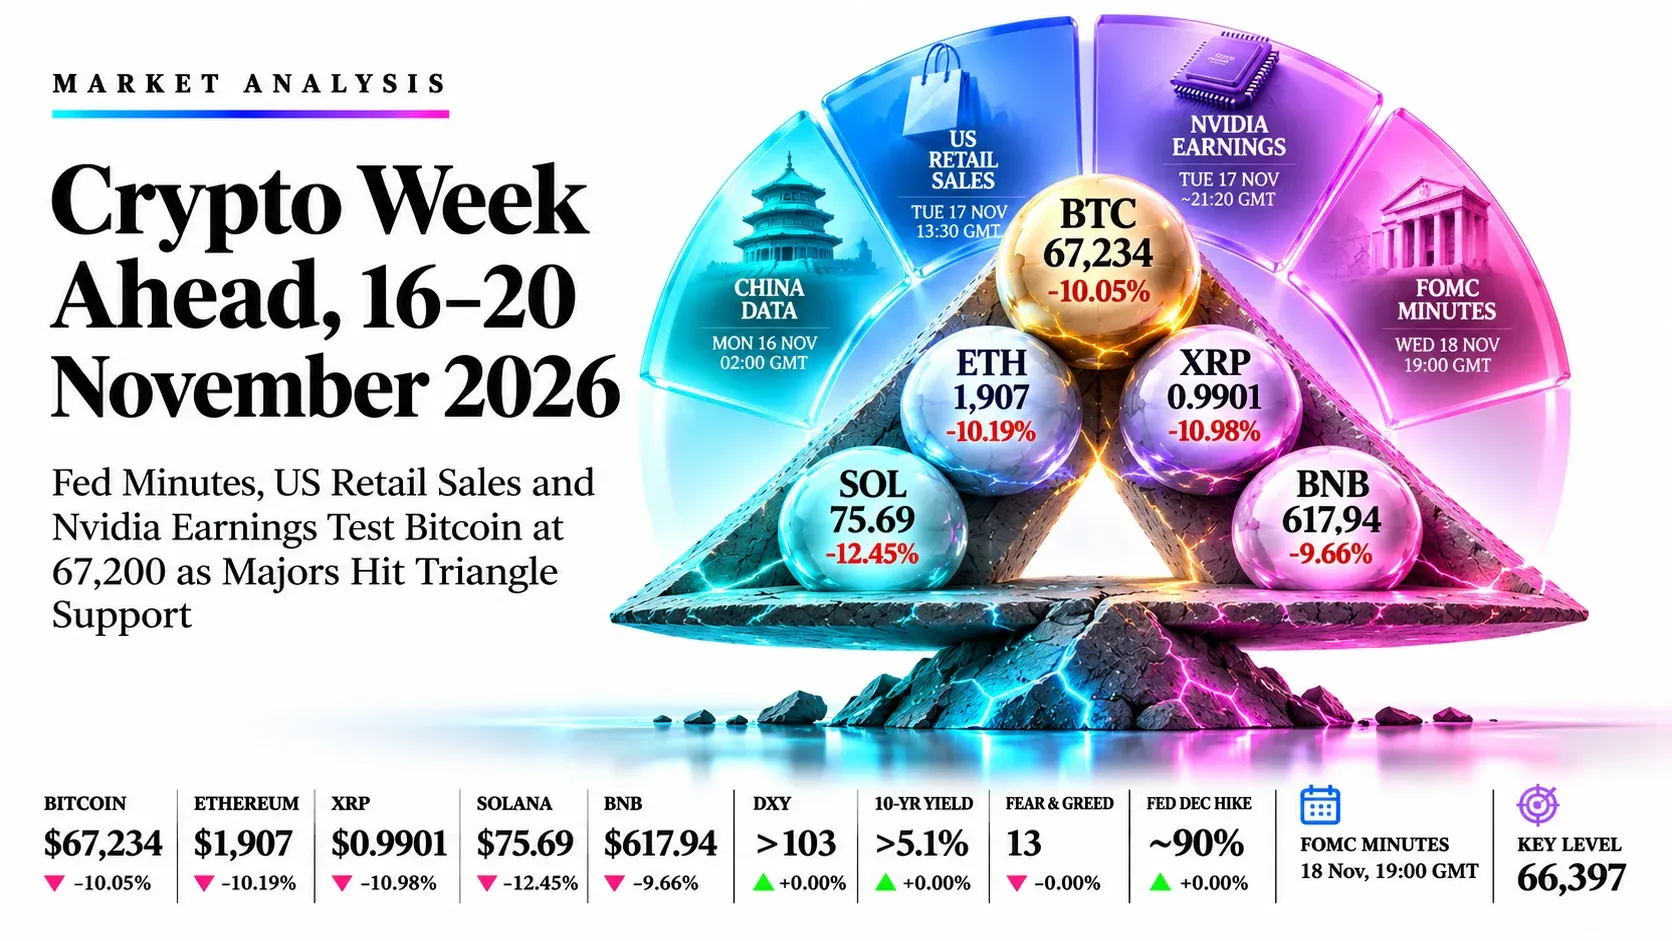
Week Ahead: Fed Minutes, US Retail Sales and Nvidia Earnings Test Bitcoin at 67,200 as Majors Hit Triangle Support | Technical Analysis – Crypto Report | 14 Nov 2026
Crypto Week Ahead | 16–20 November 2026
Week Ahead: Fed Minutes, US Retail Sales and Nvidia Earnings Test Bitcoin at 67,200 as Majors Hit Triangle Support
- Weekly bias
- Crypto weak, oversold
- Bitcoin down 10%; Fear and Greed at 13; Fed December hike odds near 90%
- Expected volatility
- High
- China data, US retail sales, Nvidia, FOMC minutes and ETF flows between Monday 02:00 GMT and Wednesday 19:00 GMT
- Key event
- FOMC minutes
- Wednesday 18 Nov, 19:00 GMT; US retail sales Tuesday 13:30 GMT; Nvidia Tuesday about 21:20 GMT
- Key pivot level
- 66,397
- Bitcoin’s weekly low; ETH 1,875, XRP 0.98, SOL 74.74 and BNB 612 are the other floors
Market Overview
Crypto enters the week oversold after a sharp, Fed-driven sell-off. Last week, hot October CPI lifted December Fed hike odds to about 90%, the dollar index rose above 103 and US spot Bitcoin ETFs lost about $1.44 billion over five sessions. Bitcoin fell 10.05% to 67,234, its lowest since August, and more than $1.2 billion of mostly long positions were liquidated. The Fear and Greed Index now reads 13.
What we expect this week. Event risk will dominate. China’s October data on Monday at 02:00 GMT will set the Asian tone, US retail sales on Tuesday at 13:30 GMT will test Fed hike pricing, Nvidia will report on Tuesday at about 21:20 GMT, and the FOMC minutes on Wednesday at 19:00 GMT will close the run. Fed Chair Warsh and Williams will speak on Monday. If the data run hot, we expect ETF outflows to continue and the weekly lows to give way.
Where we expect the coins to trade. Bitcoin will likely try a relief bounce toward 70,000 before sellers return, with 66,397 the level to hold. Ethereum (1,875), XRP (0.98), Solana (74.74) and BNB (612) will all test the lower lines of their triangles. We expect Solana, the weakest last week, to react most to any Bitcoin move, and BNB to hold up best.
We will favour the setups where macro direction and chart structure agree, and treat BNB as the one low-conviction long.
Key highlights
- Bitcoin: Will test the 200-week average near 67,990 from below; 66,397 is the weekly low that must hold, and a bounce will likely stall near 70,000.
- Ethereum: Will sit on the lower triangle line near 1,875; a weekly close under it would open 1,700.
- XRP: Will trade around the 1.00 level with the weakest RSI of the group at 36; 0.98 is the floor to watch.
- Solana: Will react most to any Bitcoin move after a 12.45% weekly loss; 74.74 is the triangle floor.
- BNB: Will likely hold up best; a hold of 612 supports a low-conviction long toward 650 and 676.50.
Market Snapshot: Live, 14 November 2026, 11:00 GMT
Bitcoin BTC/USD
$67,234
-7,509-10.05% week
Range 66,397–75,500
60,00073,958
Sell near 70,000Ethereum ETH/USD
$1,907
-216-10.19% week
Range 1,876–2,157
1,7002,229
Sell near 1,990XRP XRP/USD
$0.9901
-0.1221-10.98% week
Range 0.9791–1.1250
0.85001.2503
Sell near 1.0800Solana SOL/USD
$75.69
-10.76-12.45% week
Range 74.74–88.37
65.0093.32
Sell near 82.00BNB BNB/USD
$617.94
-66.07-9.66% week
Range 612.17–691.70
550.00676.52
Buy near 614.00- Crypto Fear and Greed
- 13
- Extreme fear
- Fed December hike odds
- ~90%
- 25 bp; 10-year yield above 5.1%
- US Dollar Index (DXY)
- >103
- Highest since April 2025
- Bitcoin dominance
- ~59.4%
- Total crypto market cap about $2.27 trillion
Trade Setups for the Week
| Instrument | Direction | Entry | Stop | Target 1 | Target 2 | Reward:risk | Conviction |
|---|---|---|---|---|---|---|---|
| Bitcoin | Short | 70,000 | 72,600 | 66,400 | 60,000 | 1.4 / 3.8 | Medium |
| Ethereum | Short | 1,990 | 2,090 | 1,875 | 1,700 | 1.1 / 2.9 | Low |
| XRP | Short | 1.0800 | 1.1400 | 0.9800 | 0.8500 | 1.7 / 3.8 | Medium |
| Solana | Short | 82.00 | 86.50 | 74.70 | 65.00 | 1.6 / 3.8 | Medium |
| BNB | Long | 614.00 | 585.00 | 650.00 | 676.50 | 1.2 / 2.2 | Low |
Reward:risk is the distance from entry to target 1 and target 2, divided by the distance from entry to the stop. All prices are in US dollars. Levels are conditional technical references, not recommendations.
Key Market Drivers
The Fed’s hike path drives crypto
Hot October CPI (0.4% on the month against 0.3% expected), December hike odds near 90% and a dollar index above 103 pushed crypto into a weekly loss near 10%. Higher yields raise the cost of leverage and cut demand for non-yielding assets.
Key events: Monday 16 November, Williams at 14:05 GMT and Warsh at about 17:00 GMT; Tuesday 17 November, retail sales at 13:30 GMT; Wednesday 18 November, FOMC minutes at 19:00 GMT.
ETF flows and liquidations
US spot Bitcoin funds lost about $1.44 billion in five sessions and IBIT about $2 billion in nine. Liquidations ran above $1.2 billion in 24 hours, mostly longs, and clusters now sit above price at 70,000 and 75,000.
Key events: Daily: ETF flow data after the US close; weekend liquidation spikes in thin liquidity.
Nvidia and the AI trade
Nvidia reports fiscal Q3 on Tuesday after the US close; consensus is near $108.8 billion of revenue. Crypto has traded with technology stocks, so the result and guidance feed Bitcoin, Ethereum and Solana sentiment.
Key events: Tuesday 17 November, results at about 21:20 GMT and call at 22:00 GMT.
Altcoins: triangle floors and tokenization
Ethereum, XRP, Solana and BNB all sit on triangle floors. DTCC’s plan for tokenized stocks and Treasuries on Solana in 2027 and BNB Chain’s lead in tokenized ETFs support long-term stories but not this week’s flows.
Key events: Weekly closes on Sunday 22 November at 00:00 GMT decide whether the floors hold.
Bitcoin at 66,397, Ethereum at 1,875 and Solana at 74.74 mark the three floors most exposed to the retail sales, Nvidia and minutes sequence. A weekly close beneath any of them would change the picture.
US Data Scenario Analysis
Consensus is for October retail sales of +0.2% (control group +0.4%) on Tuesday at 13:30 GMT, with Nvidia results the same evening and the FOMC minutes on Wednesday at 19:00 GMT. The minutes pre-date the hot CPI report, so live Fed speakers and the retail print carry more weight.
Hawkish: strong retail sales and a hawkish minutes tone lift yields
Higher yields and a larger December hike add to ETF outflows and push crypto through its weekly lows.
- Bitcoin66,397, then 60,000
- Ethereum1,875, then 1,700
- XRP0.98, then 0.85
- Solana74.74, then 65.00
- BNB612.17, then 550.00
Softer: weak retail sales or strong Nvidia guidance trigger a relief bounce
Lower yield expectations and a strong AI read allow oversold crypto to squeeze back toward the first resistance levels.
- Bitcoin70,000, then 73,958
- Ethereum2,000, then 2,229
- XRP1.10, then 1.25
- Solana82.00, then 93.32
- BNB650.00, then 676.52
Bitcoin | BTC/USD
Bitcoin Outlook: Weekly Close Under the 200-Week Average Leaves $66,400 as the Line That Matters
$67,234 -7,509 (-10.05%) week Range 66,397–75,500
Outlook: Bitcoin will stay biased lower while 73,958 caps rallies. It lost 10.05% last week to about 67,234, its lowest since August and more than 46% below the October 2025 record. With the daily RSI near 23, we expect a relief bounce toward 70,000 early in the week, then renewed selling if retail sales and the FOMC minutes come in hawkish. A weekly close under 66,400 would open 60,000.

Key levels
- Support 2
- 60,000
- Support 1
- 66,397
- Resistance 1
- 70,000
- Resistance 2
- 73,958
Weekly chart structure
- Structure: a falling channel since the 126,080 record; price is in its lower half and a weekly close under 66,400 opens 60,000.
- Averages: 73,958 and 75,029 sit above price, with 88,712 well above; the 200-week average near 67,990 has turned into resistance.
- Candle: bearish, opened 74,761, ranged 66,397–75,500 and closed 10.05% lower, near the week’s low.
- Momentum: weekly RSI 40.21 sits under its 54.32 signal line, weak but not yet oversold; the daily RSI is near 23.
Key technical levels
66,397 is the weekly low and the lowest print since August; 60,000 is the next round-number support, near the 2026 low around 57,900. On the upside, 70,000 is where liquidation clusters and Friday’s failed bounce sit, and 73,958 is the average; a weekly close above 75,500 would end the bearish case.
Fundamental drivers
ETF flows and long-term holders
US spot Bitcoin ETFs lost about $1.44 billion over five sessions, and BlackRock’s IBIT saw roughly $2 billion leave across nine straight sessions through 12 November. More than $1.2 billion of positions were liquidated in 24 hours, mostly longs.
Macro and sentiment
The Crypto Fear and Greed Index is 13, extreme fear. October CPI beat forecasts, December Fed hike odds are near 90% and the dollar index is above 103. The FOMC minutes and Nvidia results set the risk tone.
Bitcoin trade setup
ShortMedium conviction- Entry
- 70,000
- Stop loss
- 72,600
- Target 1
- 66,400
- Target 2
- 60,000
Risk $2,600. Reward:risk 1.4 to target 1, 3.8 to target 2.
Rationale: Price under three averages, a falling channel and persistent ETF outflows favour selling bounces; the 70,000–72,600 band defines the risk. Daily oversold readings make chasing the low unattractive.
Invalidation: A daily close above 72,600. Strong US data cooling hike bets, a return of ETF inflows or a short squeeze through 70,000 are the main risks.
Ethereum | ETH/USD
Ethereum Outlook: Ether Slides Under 1,900 to the Floor of a Narrowing Triangle as Averages Roll Over
$1,907 -216 (-10.19%) week Range 1,876–2,157
Outlook: Ethereum will test the lower line of its triangle near 1,900 this week. It lost 10.19% last week to about 1,907. We expect a bounce toward 2,000 to meet sellers, and a weekly close under 1,875 would open 1,700. Because the line is untested, we rate the idea low conviction.

Key levels
- Support 2
- 1,700
- Support 1
- 1,876
- Resistance 1
- 2,000
- Resistance 2
- 2,229
Weekly chart structure
- Structure: a symmetrical triangle between a falling line from the 2025 high and a rising line from the mid-2026 low; price is on the lower line near 1,900.
- Averages: 2,229 and 2,278 sit just above price and 2,686 further up, capping rallies.
- Candle: bearish, opened 2,124.5, ranged 1,875.7–2,157.4 and closed 10.19% lower.
- Momentum: RSI 38.67 sits under its 54.28 signal line, weak but not oversold.
Key technical levels
1,875.7 is the weekly low and sits at the triangle floor; a weekly close under it targets 1,700, with the mid-2026 low near 1,520–1,550 beyond. On the upside, 2,000 is the first reaction level, 2,229 the average and 2,686 the triangle roof area.
Fundamental drivers
Fund flows and risk appetite
Ether followed Bitcoin lower as ETF outflows, a stronger dollar and a technology-sector sell-off cut demand for risk assets. It lost 1,900 for the first time in this leg, which makes 2,000 a likely sell zone.
Rates
December Fed hike odds near 90% and a 10-year Treasury yield above 5.1% raise the cost of leverage across crypto. The FOMC minutes on Wednesday are the main macro test.
Ethereum trade setup
ShortLow conviction- Entry
- 1,990
- Stop loss
- 2,090
- Target 1
- 1,875
- Target 2
- 1,700
Risk $100. Reward:risk 1.1 to target 1, 2.9 to target 2.
Rationale: A triangle floor under pressure, price below two averages and a weak RSI favour selling a bounce; the stop sits above the 2,000–2,090 reaction zone.
Invalidation: A daily close above 2,090. A hold of the triangle floor with rising spot demand or a dovish surprise would favour a squeeze toward 2,229.
XRP | XRP/USD
XRP Outlook: Token Drops Below $1 for the First Time in Months as the Triangle Floor Gives Way
$0.9901 -0.1221 (-10.98%) week Range 0.9791–1.1250
Outlook: XRP will likely stay under pressure while 1.25 caps rallies. It lost 10.98% last week to about 0.990 and trades under the 1.00 level on the lower triangle line. We expect sellers to meet any bounce toward 1.08, and a weekly close under 0.98 would open 0.85.

Key levels
- Support 2
- 0.8500
- Support 1
- 0.9791
- Resistance 1
- 1.1000
- Resistance 2
- 1.2503
Weekly chart structure
- Structure: a triangle from the July 2025 high near 3.60; price has slipped under 1.00 on the lower line and a weekly close below it opens 0.85.
- Averages: 1.2503 and 1.4094 sit above price and 1.9680 well above, all rolling over.
- Candle: bearish, opened 1.1112, ranged 0.9791–1.1250 and closed 10.98% lower.
- Momentum: RSI 36.27 sits under its 48.08 signal line, the lowest reading of the group.
Key technical levels
0.9791 is the weekly low; 0.85 is the next support and the zone where the rising line from the 2024 low is nearing. On the upside, 1.10 is the reaction level, 1.2503 the average; a weekly close above 1.41 would end the bearish case.
Fundamental drivers
Sentiment and ETF demand
XRP broke under 1.00 alongside Ethereum and Solana as the broad sell-off spread, with sentiment in extreme fear. Spot XRP funds have not offset the outflows from the larger products.
Macro
Hot October CPI and Fed hike pricing hit the highest-beta tokens hardest. US retail sales on Tuesday and the FOMC minutes on Wednesday can swing XRP 5% or more in a session.
XRP trade setup
ShortMedium conviction- Entry
- 1.0800
- Stop loss
- 1.1400
- Target 1
- 0.9800
- Target 2
- 0.8500
Risk $0.0600. Reward:risk 1.7 to target 1, 3.8 to target 2.
Rationale: A broken psychological level, price under three averages and the weakest RSI of the group favour selling bounces; the stop sits above 1.14, the top of last week’s breakdown candle.
Invalidation: A daily close above 1.14. A reclaim of 1.00 on rising volume or a dovish Fed shift would signal a failed breakdown.
Solana | SOL/USD
Solana Outlook: Largest Weekly Loss of the Majors Pins SOL to the Triangle Floor Near 75
$75.69 -10.76 (-12.45%) week Range 74.74–88.37
Outlook: Solana will likely follow Bitcoin and swing the most. It lost 12.45% last week, the biggest drop of the five, to about 75.69, and sits on the triangle floor at 74.74. We expect a bounce toward 82 to meet sellers, with 65 the next support if the floor breaks. DTCC’s 2027 tokenization plan is long-dated and will not drive this week’s flow.

Key levels
- Support 2
- 65.00
- Support 1
- 74.74
- Resistance 1
- 82.00
- Resistance 2
- 93.32
Weekly chart structure
- Structure: a triangle between a falling line from the 2025 high and a rising line from the 2023 low; price is at the floor near 75.
- Averages: 93.32 and 94.78 sit about 23% above price and 134.74 further up.
- Candle: bearish, opened 86.43, ranged 74.74–88.37 and closed 12.45% lower.
- Momentum: RSI 38.78 sits under its 53.74 signal line.
Key technical levels
74.74 is the weekly low and triangle floor; 65.00 is the next support, with the 2026 low in the high 50s well beneath it. On the upside, 82.00 is the reaction level, 93.32 the average and the 100-level the triangle roof; a weekly close above 94.78 would end the bearish case.
Fundamental drivers
Institutional adoption against price
The DTCC said it will launch tokenized stocks and Treasuries on Solana in 2027, a long-term positive. In the short run liquidations and risk-off flows outweigh it.
Beta to Bitcoin
Solana fell 12.45% against 10.05% for Bitcoin, confirming its higher beta. A bounce in Bitcoin above 70,000 would lift SOL toward 82; a break below 66,400 would pull it through 74.74.
Solana trade setup
ShortMedium conviction- Entry
- 82.00
- Stop loss
- 86.50
- Target 1
- 74.70
- Target 2
- 65.00
Risk $4.50. Reward:risk 1.6 to target 1, 3.8 to target 2.
Rationale: The largest weekly loss, price far under both averages and a weekly close near the low favour selling bounces; the stop sits above the 82–86.50 reaction band.
Invalidation: A daily close above 86.50. A hold at the triangle floor with a Bitcoin recovery above 70,000 would favour a squeeze toward 93.
BNB | BNB/USD
BNB Outlook: Smallest Loss of the Majors Leaves the Token on a Triangle Floor Near 615
$617.94 -66.07 (-9.66%) week Range 612.17–691.70
Outlook: BNB will likely hold up best of the five. It lost 9.66% last week to about 617.94 and sits on the triangle floor near 612. We expect a low-conviction bounce toward 650 and 676.50 while 612 holds, and will turn bearish on a weekly close under it.

Key levels
- Support 2
- 550.00
- Support 1
- 612.17
- Resistance 1
- 650.00
- Resistance 2
- 676.52
Weekly chart structure
- Structure: a triangle between a falling line from the 2025 high above 1,300 and a rising line from the 2023 low; price is on the floor near 615.
- Averages: 676.52 and 689.45 sit above price and 726.65 further up.
- Candle: bearish, opened 684.02, ranged 612.17–691.70 and closed 9.66% lower.
- Momentum: RSI 41.71 sits under its 54.97 signal line, the strongest of the group but still weak.
Key technical levels
612.17 is the weekly low and sits on the triangle floor; 550 is the next support. On the upside, 650 is the first reaction level, 676.52 the average and 726.65 the upper average; a weekly close below 612 would end the long idea.
Fundamental drivers
Ecosystem demand
BNB Chain held about $309 million of tokenized ETFs as of 2 November, passing Ethereum in that niche. The data support the long-term case but did not stop this week’s sell-off.
Risk and exchange flows
As an exchange token BNB tracks Bitcoin and total market volume. A Bitcoin break under 66,400 would likely take BNB through its triangle floor.
BNB trade setup
LongLow conviction- Entry
- 614.00
- Stop loss
- 585.00
- Target 1
- 650.00
- Target 2
- 676.50
Risk $29.00. Reward:risk 1.2 to target 1, 2.2 to target 2.
Rationale: Price on the triangle floor with the smallest weekly loss offers the tightest risk of the group; the stop sits under the 585 area to survive a spike through the line.
Invalidation: A daily close below 585. A break of 612 with Bitcoin under 66,400 would turn the bias to selling rallies toward 550.
Economic Calendar: 16–20 November 2026
| Date | Event | Market | Impact | Context |
|---|---|---|---|---|
| 23:50 GMT | Japan GDP, preliminary Q3 | BTC, ETH | Med | Yen and Asian growth read ahead of the BoJ’s 18 December meeting |
| 02:00 GMT | China activity data (October) | BTC, BNB | High | Asia risk read at the weekly open; weak data adds to risk-off |
| 13:30 GMT | US Empire State manufacturing (November) | BTC | Low | Early read on US factory demand |
| 14:05 GMT | Fed’s Williams gives opening remarks | BTC, ETH | Med | Follows hot October CPI; Fed Chair Warsh also speaks at about 17:00 GMT |
| 13:30 GMT | US retail sales (October), forecast +0.2%, control group +0.4% | All five | High | A beat keeps December Fed hike odds near 90% and pressures crypto |
| 21:20 GMT | Nvidia Q3 FY2027 results; call at 22:00 GMT | BTC, ETH, SOL | High | Confirmed by Nvidia for Tuesday; consensus about $108.8bn revenue; sets the AI and risk-asset tone |
| 19:00 GMT | FOMC minutes (October meeting) | All five | High | Hawkish tone would test 66,400 for Bitcoin; minutes pre-date the hot CPI report |
| 13:30 GMT | US jobless claims; Philadelphia Fed index | BTC, ETH | Med | Labour data feed Fed hike odds and the dollar |
| 23:30 GMT | Japan CPI (October) | BTC | Low | BoJ December hike odds feed the dollar and yen carry trades |
| Daily | US spot Bitcoin and Ether ETF net flows (SoSoValue, daily) | BTC, ETH | Med | Data publish after the US close each day; five-session outflow streak at $1.44bn |
All times GMT. Consensus figures from FXStreet, MarketBeat and Dow Jones; Nvidia timing from the company’s announcement; Williams and Warsh times approximate.
Conclusion
One idea links the week: the Fed is closer to a December hike than markets thought a month ago, and that lifts the dollar and yields against crypto while ETFs sell. US retail sales, Nvidia and the FOMC minutes test it, while weekend liquidations can exaggerate every move.
On conviction, Bitcoin, XRP and Solana rate medium because price sits under key averages or has broken a level. Ethereum and BNB rate low because both sit on triangle floors ahead of binary headlines, and BNB is the one long idea.
We treat every level as conditional, let the event windows pass before adding exposure and size positions so that a stop-out is affordable. Spreads can widen sharply around retail sales, Nvidia and the minutes, and crypto gaps over weekends.
| Instrument | Bias | Key level | Targets | Invalidation | Principal risk |
|---|---|---|---|---|---|
| Bitcoin | Sell near 70,000 | 66,397 | 66,400 / 60,000 | Above 72,600 | Short squeeze above 70,000 |
| Ethereum | Sell near 1,990 | 1,876 | 1,875 / 1,700 | Above 2,090 | Hold of the triangle floor |
| XRP | Sell near 1.0800 | 0.9791 | 0.9800 / 0.8500 | Above 1.1400 | Reclaim of 1.00 on volume |
| Solana | Sell near 82.00 | 74.74 | 74.70 / 65.00 | Above 86.50 | Bitcoin rebound above 70,000 |
| BNB | Buy near 614.00 | 612.17 | 650.00 / 676.50 | Below 585.00 | Break of 612 with Bitcoin lower |
Trade Bitcoin, Ethereum, XRP, Solana and BNB with Capital Street FX.
Frequently Asked Questions
Which events decide crypto this week?
US retail sales on Tuesday at 13:30 GMT, Nvidia results on Tuesday at about 21:20 GMT and the FOMC minutes on Wednesday at 19:00 GMT set the tone. Daily US spot ETF flows and China data on Monday at 02:00 GMT add to it.
Why did Bitcoin fall below $67,000?
Spot ETF outflows of about $1.44 billion over five sessions, hot October CPI, December Fed hike odds near 90% and a dollar index above 103 combined with more than $1.2 billion of liquidations, mostly longs. Bitcoin lost 10.05% on the week and touched 66,397.
Is the crypto market oversold?
The Fear and Greed Index is 13 and the daily Bitcoin RSI is near 23, so a relief bounce is likely. The weekly RSI readings of 36–42 are weak but not oversold, which is why we sell rallies rather than the lows.
What happens if the triangle floors break?
Ethereum, XRP, Solana and BNB all sit on the lower lines of triangles. A weekly close under 1,875, 0.98, 74.74 and 612 respectively would open 1,700, 0.85, 65.00 and 550.
How can traders manage risk in an event-heavy week?
Reduce size before major releases, avoid new entries in the minutes around them and allow for wider spreads. Crypto trades 24 hours a day, so weekend gaps and liquidation cascades can pass through stops.