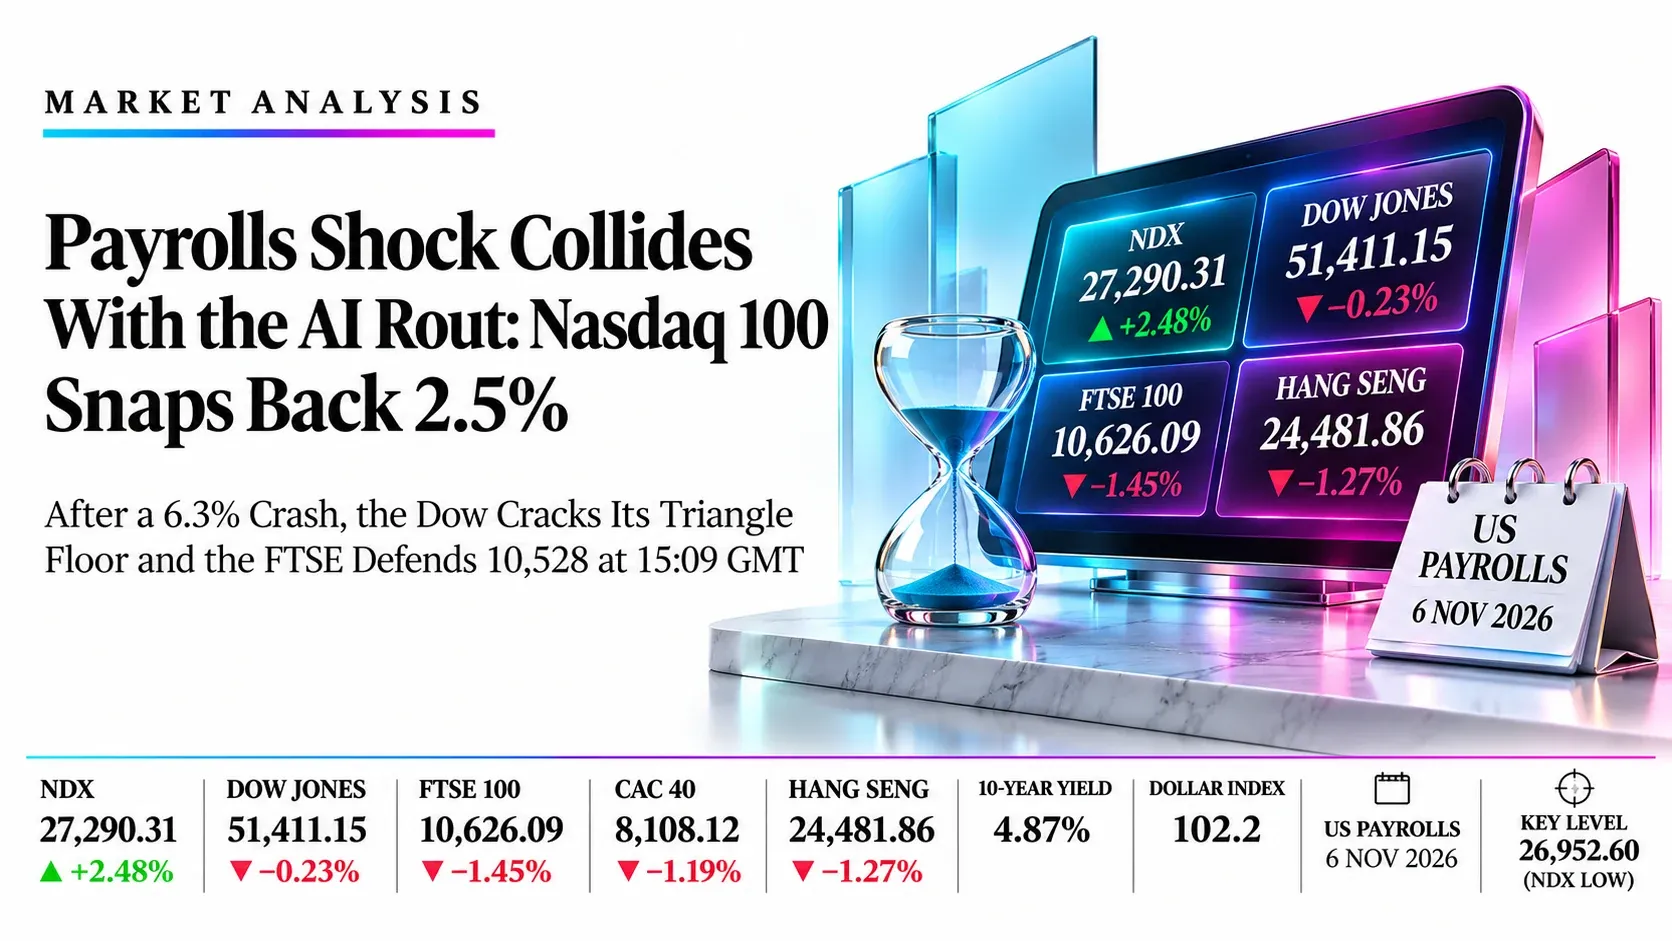
Payrolls Shock Collides With the AI Rout: Nasdaq 100 Snaps Back 2.5% After a 6.3% Crash, the Dow Cracks Its Triangle Floor and the FTSE Defends 10,528 at 15:09 GMT | Technical Analysis – Index Report | 06 Nov 2026
LIVE Indices | Friday 6 November 2026 | 15:09 GMT snapshot, US session | Wall Street cash close at 21:00 GMT
Payrolls Shock Collides With the AI Rout: Nasdaq 100 Snaps Back 2.5% After a 6.3% Crash, the Dow Cracks Its Triangle Floor and the FTSE Defends 10,528 at 15:09 GMT
Market Overview
Wall Street is caught between two shocks: a 165K payrolls blowout that has made a December Fed hike a 76.8% bet, and an AI rout that erased $2.3 trillion from the Nasdaq 100 on Thursday. The result is a split tape at 15:09 GMT. Tech is fighting back, with the Nasdaq 100 at 27,290.31 (+2.48%), while the Dow Jones sits at 51,411.15 (−0.23%), the FTSE 100 at 10,626.09 (−1.45%), the CAC 40 at 8,108.12 (−1.19%) and the Hang Seng closed at 24,481.86 (−1.27%). Payrolls of 165K against 56K to 65K expected, unemployment at 4.1% and earnings up 0.4% have pushed the 10-year yield to about 4.87% and the dollar index to about 102.2, and that is the headwind every rebound has to beat.
The 21:00 GMT cash close decides whether this is a recovery or a dead-cat bounce. The Nasdaq 100 must hold today’s 26,952.60 low, the Dow is trading under its rising triangle line with 50,998 as the next floor, and the FTSE has defended 10,528 after sliding as much as 2%. RSI readings of 34.67 (Nasdaq 100), 44.10 (Dow), 45.57 (FTSE) and 58.00 (Hang Seng) leave the Nasdaq nearest to oversold. Desk plan: sell Nasdaq 100 bounces near 27,850 and Dow retests near 51,750, buy FTSE dips near 10,500 and Hang Seng CFD dips near 24,420. This is a 15:09 GMT snapshot; London closes at 16:30 GMT and Wall Street at 21:00 GMT.
Key highlights
- Dow Jones: Price is 51,411.15 under the triangle floor and the 52,072 average; 50,998 supports and 52,200 caps.
- Nasdaq 100: Price is 27,290.31 after a 2.48% bounce, far under the 29,106 average; 26,953 supports and 28,300 caps.
- FTSE 100: Price is 10,626.09 above the 10,528 low and the rising triangle floor; 10,692 is the first hurdle.
- Hang Seng: Price is 24,481.86 on the broken channel line and the 24,410 average; 24,150 is the line to hold.
What’s Moving Indices Today
Payrolls of 165K crush the 56K to 65K forecasts: December hike odds jump to 76.8% and the dollar index rises to about 102.2
Unemployment fell to 4.1% from 4.2% and average hourly earnings rose 0.4%, while revisions added 84K jobs. The 10-year yield rose to about 4.87%, the 2-year to 4.53%, and gold fell about 0.96% to 4,046.52. Higher yields add pressure on growth stocks already hit by the AI selloff.
Source: ActionForex, CNBC, Investing.com, 6 Nov 2026
Nasdaq 100 rebounds 2.5% as chip buyers return after Thursday’s 6.3% plunge, but the AI worries are unresolved
Nvidia rose about 6% and Intel about 6% at the open, erasing part of Thursday’s losses, when the Philadelphia Semiconductor Index fell 12.2% and the Magnificent Seven lost over $1 trillion. Credit-default-swap spreads tied to CoreWeave and SoftBank have also risen, so the rebound still has to survive higher yields into the 21:00 GMT close.
Source: TheStreet, Yahoo Finance, ActionForex, 6 Nov 2026
Dow trails the tech bounce as Walmart, Home Depot and Sherwin-Williams drop at the open
The Dow opened about 0.7% to 0.9% lower and is now down 0.23% at 51,411.15, after falling 3.44% on Thursday. Rotation back into chips and out of defensives and cyclicals leaves the index beneath its rising triangle line, with the 52,072 to 52,416 averages overhead.
Source: Trading Economics, TheStreet, Benzinga, 6 Nov 2026
FTSE 100 slid as much as 2% to 10,542 at midday, then recovered; the STOXX 600 is on its worst day since July
The FTSE opened at 10,784.16 and mining and materials stocks showed relative strength. Europe followed Wall Street and Asia lower, with the DAX down about 2.3% and the CAC 40 about 1.5% at 14:11 GMT, as investors also weighed whether US Democrats’ midterm wins lead to tougher rules on AI data centres.
Source: Proactive Investors, Investing.com, Euronews, ActionForex, 6 Nov 2026
Hang Seng closed 1.27% lower at 24,481.86 as AI hardware stocks fell, giving back part of Thursday’s 3.7% surge
The Hang Seng Tech Index fell 1.83% to 4,078.23 and the China Enterprises Index 1.13% to 8,274.10. Yangtze Optical (06869) lost 10.46%, while utilities and high-dividend names rose and Li Ning gained 5.16% on a HK$6 billion special dividend. CICC noted heavy southbound net selling and rising short volume.
Source: Futu, Xinhua via NAMPA, 6 Nov 2026
Nikkei closed 5.96% lower into a bear market, KOSPI lost 6.02% and TAIEX 4.51%
The Asian technology rout set the tone for Europe’s open, although the yen and Korean won stayed relatively stable, suggesting no wider currency stress yet.
Source: ActionForex, 6 Nov 2026
Canada’s jobs fell 4.7K and unemployment rose to 6.7%; Brent is near $98.50 and WTI near $91 on US–Iran uncertainty
Private-sector employment dropped 53K, offset by a 50K rise in public hiring. Oil has retreated from higher levels earlier, with reports that Iran sent a nuclear proposal via Qatar helping to ease supply worries.
Source: ActionForex, 6 Nov 2026
CAC 40 trades at 8,108.12 (−1.19%) after hitting 8,049.64, holding above its channel breakout
Paris is not part of today’s trade ideas, but it confirms the Europe-wide tone: RSI is 57.72, with the 8,244.70 average overhead and 8,026.35 underfoot.
Source: Investing.com, chart feed, 6 Nov 2026
Key Drivers for the Rest of Today
Five things that set direction for the rest of the session in the Dow Jones, Nasdaq 100, FTSE 100 and Hang Seng. All times are GMT.
- London cash close
- 16:30
- Fri 6 Nov, 16:30 GMT
- Final FTSE 100 print; the 10,692 to 10,733 averages are the lid and 10,528 is today’s low
- US tech into the close
- Live
- Fri 6 Nov, until 21:00 GMT
- Whether Nvidia and Intel keep the Nasdaq 100 above 26,953 decides the tone for all four indices
- Treasury yields and Fed pricing
- 4.87%
- Fri 6 Nov, live
- 10-year yield near 4.87% and a 76.8% December hike; a further rise pressures the Nasdaq 100 and Dow
- Wall Street cash close
- 21:00
- Fri 6 Nov, 21:00 GMT
- Closing levels confirm or reject the Dow triangle break and the Nasdaq bounce; the Hang Seng CFD follows
- Setup expiry
- 21:00
- Fri 6 Nov, 21:00 GMT
- Unfilled ideas lapse at 21:00 GMT; the Hang Seng cash index already closed at 08:00 GMT
Swipe the strip to see every driver.
Trade Setups for Today
Ranked in the order Dow Jones, Nasdaq 100, FTSE 100 and Hang Seng, valid until 21:00 GMT today. A 4-hour close beyond the stop cancels the idea.
| Instrument | Direction | Entry | Stop | Target 1 | Target 2 | Reward:risk | Conviction |
|---|---|---|---|---|---|---|---|
| Dow Jones (DJI) | Short | 51,750 | 52,200 | 51,100 | 50,550 | 1.4 / 2.7 | Medium |
| Nasdaq 100 (NDX) | Short | 27,850 | 28,300 | 27,300 | 26,950 | 1.2 / 2.0 | Low |
| FTSE 100 (UKX) | Long | 10,500 | 10,400 | 10,690 | 10,785 | 1.9 / 2.9 | Medium |
| Hang Seng (HSI) | Long | 24,420 | 24,150 | 24,740 | 25,000 | 1.2 / 2.1 | Low |
Reward:risk is the distance from entry to each target divided by the distance from entry to the stop. A third target for each index is in its section below. Prices are chart-feed prices from the daily charts at about 15:09 GMT on 6 November. Every entry sits away from the current price and needs a bounce or a pullback to trigger, and index prices can gap on tech and yield headlines. Two ideas are short (Dow Jones, Nasdaq 100) and two are long (FTSE 100, Hang Seng), so a broad tech recovery would hit the shorts while a renewed tech selloff would hit both longs. The Hang Seng idea is for the HK50 CFD because the cash market closed at 08:00 GMT. Levels are conditional technical references, not recommendations.
Risk Scenario Analysis
US tech follow-through, Treasury yields and the 21:00 GMT Wall Street close are the swing factors for the rest of today.
Chip buyers hold the bounce: the Nasdaq 100 clears today’s high and the Dow regains its triangle line
If Nvidia and Intel keep their gains and yields stop rising, the Nasdaq 100 extends toward 28,000 and the Dow retests the broken triangle line. The FTSE reclaims its averages and the Hang Seng CFD follows the risk tone. This is the scenario that stops out the Dow and Nasdaq shorts.
- Dow Jones51,750, then 52,072
- Nasdaq 10027,850, then 28,300
- FTSE 10010,692, then 10,785
- Hang Seng24,740, then 25,000
Higher yields drag growth stocks lower: the Nasdaq 100 gives back its bounce and the Dow loses 50,998
If the 10-year yield pushes above 4.87% and the 76.8% December hike pricing firms, chip buyers fade and today’s lows fail. The Nasdaq 100 returns to Thursday’s base, the Dow breaks lower and the FTSE tests its triangle floor.
- Dow Jones50,998, then 50,550
- Nasdaq 10026,953, then 26,500
- FTSE 10010,528, then 10,475
- Hang Seng24,410, then 24,150
Dow Jones (DJI) | TVC feed
Dow Jones Analysis: Index Slips Back Under the Rising Triangle Line as Defensives and Cyclicals Lag the Tech Bounce
51,411.15 −117.01 (−0.23%) on the daily candle at about 15:09 GMT Previous close 51,528.16
Outlook: Bias is lower on bounces while 52,200 caps. The Dow has dropped back beneath the rising line of its triangle and trails the Nasdaq rebound, with Walmart, Home Depot and Sherwin-Williams weighing at the open, and the 165K payrolls beat has lifted the 10-year yield to about 4.87%.

Key levels
- Support 2
- 50,550
- Support 1
- 50,998
- Resistance 1
- 51,750
- Resistance 2
- 52,072
- Price (51,411.15) is under the 52,072, 52,161 and 52,416 averages and just beneath the triangle floor. Main catalyst: Treasury yields and the Fed December hike pricing of 76.8% after payrolls, with Wall Street cash closing at 21:00 GMT.
- RSI 44.10 under its 53.31 average: momentum has turned down. A close under 50,998 (today’s low) targets 50,550; a close back above 52,072 would put the triangle floor reclaim in play.
Setup: Short at 51,750, stop 52,200, targets 51,100, 50,550 and 50,000. Reward:risk 1.4 / 2.7 / 3.9, medium conviction. Cancel if a 4-hour close above 52,200, or if the tech bounce broadens and yields drop sharply. Cancel if unfilled by 21:00 GMT today.
Nasdaq 100 (NDX) | NASDAQ feed
Nasdaq 100 Analysis: Index Bounces 2.5% Off Thursday’s Low, but Stays Far Below Its Broken Channel and Averages
27,290.31 +660.50 (+2.48%) on the daily candle at about 15:09 GMT Previous close 26,629.81
Outlook: Bias is lower on bounces while 28,300 caps. Chip buyers are back after Thursday’s 6.3% plunge, with Nvidia up about 6% and Intel about 6% at the open, but a 4.87% 10-year yield and a 76.8% December Fed hike keep the rebound under pressure.

Key levels
- Support 2
- 26,500
- Support 1
- 26,953
- Resistance 1
- 27,850
- Resistance 2
- 28,300
- Price (27,290.31) is well under the 29,106, 29,457 and 29,639 averages. Main catalyst: whether semiconductor buyers hold the bounce against higher Treasury yields into the 21:00 GMT cash close. Today’s range is 26,952.60 to 27,316.09.
- RSI 34.67 under its 38.93 average: nearest to oversold of the four, which limits chasing shorts. A close under 26,953 targets 26,500; a close above 28,300 would end the lower-high sequence.
Setup: Short at 27,850, stop 28,300, targets 27,300, 26,950 and 26,500. Reward:risk 1.2 / 2.0 / 3.0, low conviction. Cancel if a 4-hour close above 28,300, or if yields fall back and chip stocks extend the rebound. Cancel if unfilled by 21:00 GMT today.
FTSE 100 (UKX) | FTSE feed
FTSE 100 Analysis: Index Recovers From 10,528 and Holds Above the Rising Triangle Floor in a Global Tech Selloff
10,626.09 −156.57 (−1.45%) on the daily candle at about 15:09 GMT Previous close 10,782.66
Outlook: Bias is higher on dips while 10,400 holds. The FTSE opened at 10,784.16, slid as much as 2% at midday on the global tech rout and has since recovered to 10,626.09, with mining and materials showing relative strength.

Key levels
- Support 2
- 10,475
- Support 1
- 10,528
- Resistance 1
- 10,692
- Resistance 2
- 10,785
- Price (10,626.09) is under the 10,688, 10,692 and 10,733 averages and above today’s 10,528 low. Main catalyst: the London cash close at 16:30 GMT and the direction of US tech into 21:00 GMT.
- RSI 45.57 under its 52.15 average: neutral-to-soft momentum. A close above 10,692 targets 10,785; a close under 10,475 would break the triangle floor and open the 10,400 area.
Setup: Long at 10,500, stop 10,400, targets 10,690, 10,785 and 10,950. Reward:risk 1.9 / 2.9 / 4.5, medium conviction. Cancel if a 4-hour close under 10,400, or if US tech sells off again after the open. Cancel if unfilled by 21:00 GMT today.
Hang Seng (HSI) | HSI feed
Hang Seng Analysis: Index Gives Back Part of Thursday’s Rally and Retests the Broken Channel Line on an AI Hardware Selloff
24,481.86 −315.12 (−1.27%) on the daily candle at about 15:09 GMT Previous close 24,796.98
Outlook: Bias is higher on dips while 24,150 holds. The cash index closed at 08:00 GMT after an AI hardware selloff, with the Hang Seng Tech Index down 1.83%, while utilities and high-dividend stocks rose; the HK50 CFD and futures keep trading through the US session.

Key levels
- Support 2
- 24,150
- Support 1
- 24,410
- Resistance 1
- 24,740
- Resistance 2
- 25,000
- Price (24,481.86) is above the 24,410 and 23,733 averages and just under the 24,589 average. Main catalyst: Wall Street’s tech direction through the 21:00 GMT cash close, which feeds the HK50 CFD.
- RSI 58.00 against its 39.89 average: the strongest momentum of the four. A close above 24,740 (today’s high) targets 25,000; a close under 24,410 puts the 24,150 area in play.
Setup: Long at 24,420 on the HK50 CFD, stop 24,150, targets 24,740, 25,000 and 25,400. Reward:risk 1.2 / 2.1 / 3.6, low conviction. Cancel if a 4-hour close under 24,150, or if the Nasdaq loses 26,950. Cancel if unfilled by 21:00 GMT today.
Conclusion
Payrolls of 165K have put a 76.8% December Fed hike and a 4.87% 10-year yield behind the market, so we prefer selling Nasdaq 100 bounces near 27,850 (low conviction) and Dow Jones retests near 51,750 (medium), and buying FTSE 100 dips near 10,500 (medium) and Hang Seng CFD dips near 24,420 (low). The session risks are US tech follow-through, Treasury yields and the 21:00 GMT Wall Street close. A 4-hour close above 28,300 in the Nasdaq 100 or under 10,400 in the FTSE 100 would change the picture.
Trade the Dow Jones, Nasdaq 100, FTSE 100 and Hang Seng with Capital Street FX.
Frequently Asked Questions
What is the index outlook for today?
Tech is bouncing while the rest of the tape is weak: the Nasdaq 100 is up 2.48% at 27,290.31, the Dow is down 0.23%, the FTSE 100 down 1.45% and the Hang Seng closed down 1.27%. Treasury yields and the 21:00 GMT Wall Street close decide whether the bounce holds.
Which index trade ideas are live today?
Short the Dow Jones near 51,750 and the Nasdaq 100 near 27,850 on bounces; long the FTSE 100 near 10,500 and the Hang Seng CFD near 24,420 on dips, each with a stop and three targets valid until 21:00 GMT.
What time are the key events in GMT?
London closes at 16:30 GMT, Wall Street’s cash session closes at 21:00 GMT and unfilled setups expire at 21:00 GMT. The Hang Seng cash market already closed at 08:00 GMT.
Why is the Nasdaq 100 rising while the Dow falls?
Buyers are returning to chip stocks after Thursday’s 6.3% Nasdaq 100 drop, with Nvidia and Intel up about 6%, while Walmart, Home Depot and Sherwin-Williams weigh on the Dow.
Why did the Hang Seng fall today?
The AI hardware selloff spread from Wall Street to Asia: the Hang Seng Tech Index fell 1.83% and the Hang Seng closed 1.27% lower at 24,481.86, although utilities and high-dividend stocks rose.