Hot CPI Locks In a December Fed Hike: S&P 500 Claws to 7,536, DAX Surges 1%, Nikkei Rips 2.9% and the 18:00 GMT Auction Is Next | Technical Analysis – Index Report | 10 Nov 2026
LIVE Indices | Tuesday 10 November 2026 | Updated 15:10 GMT (10:10 ET), US session under way after hot CPI | Europe closes 16:30 GMT | US 10-year auction 18:00 GMT
Hot CPI Locks In a December Fed Hike: S&P 500 Claws to 7,536, DAX Surges 1%, Nikkei Rips 2.9% and the 18:00 GMT Auction Is Next
Market Overview: The Fed Has Its Excuse, and Wall Street Is Daring It
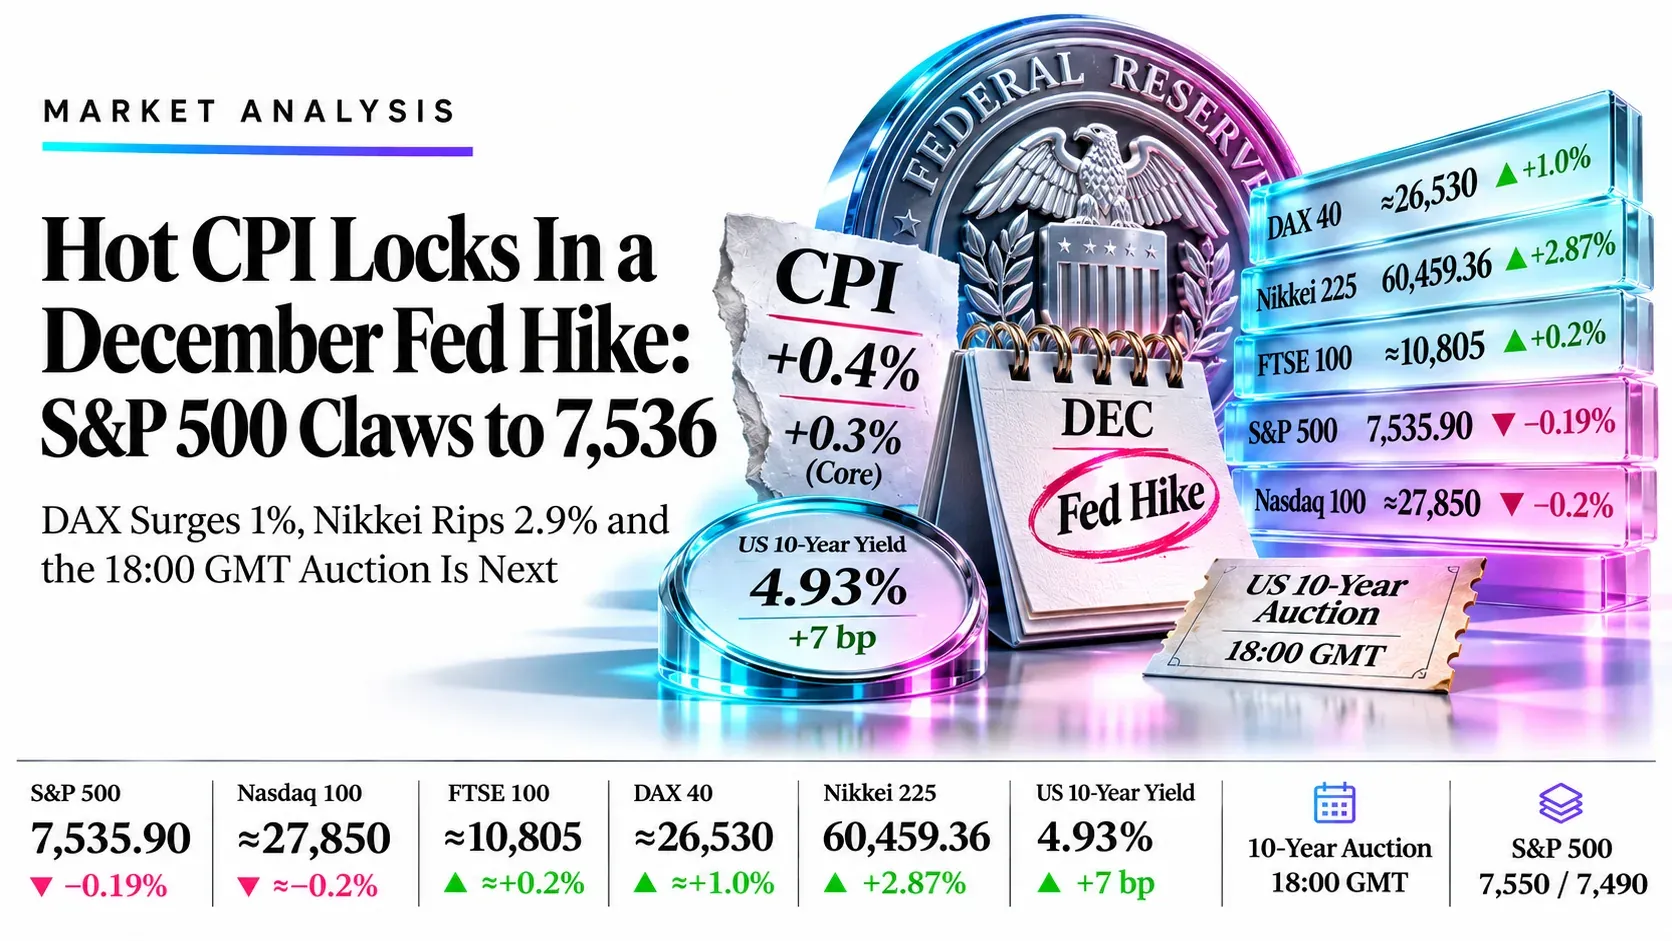
The inflation print markets feared has landed, and the Fed now has cover to hike. October CPI rose 0.4% (0.3% expected) and core 0.3% (0.2% expected) for a third straight month, the US 10-year yield jumped 7 basis points to about 4.93%, and a December hike is priced near 99%: roughly 84% for 25 basis points and 15% for 50 after Waller put a half-point on the table. Nasdaq 100 futures plunged 1.2% on the 13:30 GMT release and the S&P 500 opened 0.7% lower.
Then the dip buyers showed up. By 15:10 GMT the S&P 500 had trimmed the loss to 0.19% at 7,535.90, protecting most of Monday’s 2.35% surge, its best day since 8 April, with Brent under $90 and Iran peace hopes as the cushion. The split is clear: Wall Street is pinned under the floors of the channels it broke last week while Nvidia slides again, Europe is the strong side with the DAX up about 1% and the STOXX 600 near a record, and the Nikkei bounced 2.87%. Next tests: Europe close 16:30 GMT, the 10-year auction at 18:00, Schmid and Pill at 18:30, Bowman at 20:30. Desk plan: sell bounces in the Nasdaq 100, S&P 500 and Nikkei under their broken trendlines, buy dips in the DAX and FTSE 100 at their averages. Correlation is high, so a hawkish surprise would hit the longs and help the shorts at once.
S&P 500SPX | 10:11 ET
7,535.90
−0.19%
Under broken floorNasdaq 100NDX | estimated
≈27,850
≈−0.2%
Under all averagesFTSE 100UK100 | estimated
≈10,805
≈+0.2%
Energy dragDAX 40GER40 | estimated
≈26,530
≈+1.0%
Uptrend intactNikkei 225JP225 | closed
60,459.36
+2.87%
Bounce under 61,700US 10-year yieldRates
4.93%
+7 bp
Pressure on techKey highlights
- Nasdaq 100: Price ≈27,850 sits under the broken channel floor and all three averages; 28,000 caps and 27,541 supports.
- S&P 500: Price 7,536 is under the broken channel floor and all three averages; 7,550 caps (14 points away) and 7,490 supports.
- FTSE 100: Price ≈10,805 sits on stacked averages inside the triangle; 10,868 caps and 10,692 supports.
- DAX 40: Price ≈26,530 holds the upper half of the rising channel; 26,700 caps and 26,267 supports.
- Nikkei 225: Price 60,459 is retesting the broken triangle floor; 61,700 caps and 59,268 supports.
What’s Moving Indices Today
Hot October CPI (+0.4% headline, +0.3% core) cements a December hike and lifts the US 10-year yield to about 4.93%
Headline CPI beat the 0.3% forecast and core beat 0.2% for a third straight 0.3% month. CME FedWatch priced about 84% for a 25 basis point hike and about 15% for 50 on 9 December, and S&P 500 and Nasdaq 100 futures fell 0.5% and 1.2% right after the print before Wall Street trimmed losses.
Source: CoinDesk, CNBC via StockTitan, MLQ, Investing.com, 10 Nov 2026
Waller says a 50 basis point hike should be considered if core CPI is around 0.3% or higher, and the October print met that test
Speaking in London, Waller said he leans toward a December increase and that only 25 basis points would risk credibility if core stays near 0.3%. Analysts say a half-point move needs wider FOMC backing; the Fed held at 3.75% to 4.00% on 28 October in a 10-2 vote.
Source: MLQ, Financial Source, StockTitan, 10 Nov 2026
S&P 500 pares a 0.7% opening drop to about −0.2% after Monday’s best day since April, with Nvidia still sliding
The S&P 500 rose 2.3% on Monday to 7,549.94 and the Nasdaq 100 jumped 3.4% to 27,907.63, recovering most of the post-midterm selloff that included a 4.4% S&P drop on 5 November. At 15:10 GMT the S&P 500 is down 0.19%, the Nasdaq Composite is flat, Nvidia is down about 4% for a second day and the VIX sits near 21.
Source: Yahoo Finance, CNBC, AP via Manila Times, Saxo, 10 Nov 2026
Brent slid to about $92 on Monday and is under $90 today on Middle East peace hopes
Brent fell 5.8% on Monday from above $112 at the start of November, and WTI traded near $85 this morning after Trump signalled the Iran war could end “fairly soon”. Lower energy costs support Europe and Japan, but the CPI beat limits the relief for rate-sensitive tech.
Source: AP via Manila Times, Benzinga, Reuters via Investing.com, 10 Nov 2026
DAX shrugs off hot CPI as the STOXX 600 nears a record, while the FTSE 100 lags on energy
The STOXX 600 traded up to 0.8% near 661.6 earlier, within a whisker of a record, with the DAX up 1.1% and the FTSE 100 up 0.7% at the open. After the CPI print the DAX holds about +1.0% on Infineon’s record quarter, while the FTSE 100 is up only about 0.2% as energy majors fall with oil.
Source: Yahoo Finance UK, Investing.com, Bespoke, 10 Nov 2026
Nikkei closed up 2.87% at 60,459 as SoftBank jumped 13.9% and AI shares rebounded, after a 9.25% weekly slump
Rising stocks outnumbered decliners 2,894 to 721 on the Tokyo Stock Exchange, and the Nikkei Volatility Index fell 8.4% to 40.84. The index fell 5.96% on 6 November and remains about 16% below its 22 June record close.
Source: Investing.com, Yahoo Finance, Google Finance, BBN Times, 10 Nov 2026
Key Drivers for the Rest of Today
Six things that set direction for the rest of the session in the Nasdaq 100, S&P 500, FTSE 100, DAX 40 and Nikkei 225. All times are GMT.
- Europe close
- 16:30
- Tue 10 Nov, 16:30 GMT
- London and Xetra daily candles lock in; DAX holds about +1% while the FTSE 100 lags near +0.2%
- US 10-year auction
- 18:00
- Tue 10 Nov, 18:00 GMT
- A $42 billion sale after the hot CPI; a weak result would push yields above 4.93% and hit tech
- Schmid and Pill speak
- 18:30
- Tue 10 Nov, 18:30 GMT
- KC Fed’s Schmid and BoE’s Pill add to the policy debate after Waller’s 50 basis point comment
- Bowman speaks
- 20:30
- Tue 10 Nov, 20:30 GMT
- Fed Vice Chair for Supervision Bowman is the last major US speaker before the close
- US close and setup expiry
- 21:00
- Tue 10 Nov, 21:00 GMT
- US cash markets close and unfilled ideas lapse
- Paulson speaks, Tokyo open
- 23:00
- Tue 10 Nov, 23:00 GMT; Wed 11 Nov, 00:00 GMT
- Philadelphia Fed’s Paulson speaks at 23:00 GMT; Tokyo opens at 00:00 GMT and reprices the Nikkei
Swipe the strip to see every driver.
Trade Setups for Today
Ranked in the order Nasdaq 100, S&P 500, FTSE 100, DAX 40 and Nikkei 225, valid until 21:00 GMT today. A 4-hour close beyond the stop cancels the idea.
| Instrument | Direction | Entry | Stop | Target 1 | Target 2 | Reward:risk | Conviction |
|---|---|---|---|---|---|---|---|
| Nasdaq 100 (NDX) | Short | 28,150 | 28,600 | 27,540 | 27,000 | 1.4 / 2.6 | Medium |
| S&P 500 (SPX) | Short | 7,565 | 7,625 | 7,490 | 7,420 | 1.2 / 2.4 | Medium |
| FTSE 100 (UK100) | Long | 10,700 | 10,630 | 10,868 | 10,950 | 2.4 / 3.6 | Low |
| DAX 40 (GER40) | Long | 26,250 | 25,950 | 26,700 | 26,950 | 1.5 / 2.3 | Medium |
| Nikkei 225 (JP225) | Short | 61,600 | 62,800 | 59,300 | 58,775 | 1.9 / 2.4 | Low |
Reward:risk is the distance from entry to each target divided by the distance from entry to the stop. A third target for each market is in its section below. Levels come from the daily charts captured at 15:00 GMT (20:30 UTC+5:30) on TradingView feeds; headline quotes were refreshed at 15:10 GMT. Every entry sits away from the current price and needs a pullback or a bounce to trigger, and the 18:00 GMT auction can gap prices through them. Three ideas are short (Nasdaq 100, S&P 500, Nikkei 225) and two are long (FTSE 100, DAX 40); the three shorts are highly correlated, so a squeeze would hit them together. Levels are conditional technical references, not recommendations.
Risk Scenario Analysis
CPI is out, so the 18:00 GMT 10-year auction and the Fed speakers are the swing factors for the rest of today.
If the auction tails or Bowman backs a 50 basis point hike, yields rise and indices lose their intraday floors
A weak 10-year sale would push yields through 4.93% and tip tech and the broken channels back lower. The Nikkei levels apply to Wednesday’s Tokyo open.
- Nasdaq 10027,541, then 26,550
- S&P 5007,490, then 7,350
- FTSE 10010,748, then 10,692
- DAX 4026,267, then 25,743
- Nikkei 22559,268, then 58,775
If the auction is well bid and oil keeps falling, the rebound extends into the broken trendlines
With the December hike already fully priced, a calm auction and Brent under $90 could extend Monday’s relief toward the overhead averages, led by Europe and Tokyo.
- Nasdaq 10028,000, then 28,812
- S&P 5007,550, then 7,620
- FTSE 10010,868, then 10,950
- DAX 4026,700, then 27,000
- Nikkei 22561,700, then 63,243
Nasdaq 100 (NDX) | Investing.com basis, Nasdaq feed (TradingView) chart
Nasdaq 100 Analysis: Price Retests the Broken Channel Floor From Below After Hot CPI, With 28,000 the Line for Sellers
≈27,850 ≈−58 (≈−0.2%), estimated Previous close 27,907.63 | Futures fell 1.2% on the CPI print, cash has recovered most of it
Outlook: Bias is lower on bounces while price holds under 28,000. Core CPI rose 0.3% for a third straight month, the US 10-year yield jumped to about 4.93% and Nasdaq 100 futures were down 1.2% right after the print, though dip buyers have since pulled the index back to within about 0.2% of Monday’s close even with Nvidia down about 4%. Monday’s 3.4% jump was the best day since April, so a failure here would show the rebound was only a squeeze. A close above 28,812 would end the setup.

Key levels
- Support 2
- 26,550
- Support 1
- 27,541
- Resistance 1
- 28,000
- Resistance 2
- 28,812
- Price (≈27,850) is under all three averages (28,813, 29,410 and 29,568) and far below the early-October peak above 31,000. Main catalysts: the 10-year auction at 18:00 GMT, Schmid at 18:30 GMT and Bowman at 20:30 GMT, with Nvidia still sliding.
- RSI 40.15 above its 38.29 average: weak, but turning up from near oversold. A close above 28,000 targets 28,813; a close under 27,541 opens 26,550.
Setup: Short at 28,150, stop 28,600, targets 27,540, 27,000 and 26,550. Reward:risk 1.4 / 2.6 / 3.6, medium conviction. Cancel if a 4-hour close above 28,600, or if the 10-year auction is strong and yields drop sharply. Cancel if unfilled by 21:00 GMT today.
S&P 500 (SPX) | Investing.com basis, S&P feed (TradingView) chart
S&P 500 Analysis: Price Stalls Under the Broken Channel Floor as Hot CPI Cools Monday’s 2.4% Rally and 7,550 Caps
7,535.90 −14.04 (−0.19%) at 10:11 ET Previous close 7,549.94 | Opened 0.7% lower, low near 7,490
Outlook: Bias is lower on bounces while price holds under 7,620. The index gapped down from Monday’s 7,549.94 close after October CPI beat forecasts, with the December Fed hike now fully priced and Waller saying a 50 basis point move should be considered. It sits just 3.4% under last month’s record after its worst day since April 2025 (−4.4% on 5 November) and a 2.4% rebound. A close above 7,620 would end the setup.

Key levels
- Support 2
- 7,350
- Support 1
- 7,490
- Resistance 1
- 7,550
- Resistance 2
- 7,620
- Price (7,536) is under all three averages (7,620, 7,630 and 7,673). The index gapped lower to near 7,490 and has recovered to within 14 points of the 7,550 cap, and the VIX, which fell 22% to 19.92 on Monday, is the gauge to watch for a fresh spike.
- RSI 43.87 just under its 44.04 average: neutral to weak. A close above 7,550 targets 7,620; a close under 7,490 opens 7,350.
Setup: Short at 7,565, stop 7,625, targets 7,490, 7,420 and 7,350. Reward:risk 1.2 / 2.4 / 3.6, medium conviction. Cancel if a 4-hour close above 7,625, or if a weak Fed tone after the auction sparks a short squeeze through 7,620. Cancel if unfilled by 21:00 GMT today.
FTSE 100 (UK100) | Investing.com basis, FTSE feed (TradingView) chart
FTSE 100 Analysis: Price Fades From the Morning High and Sits on Its Stacked Averages Inside the Triangle, With 10,868 Marking Supply
≈10,805 ≈+22 (≈+0.2%), estimated Previous close 10,782.88 | Morning high 10,868.51
Outlook: Bias is sideways to higher on dips while price holds above 10,692, with low conviction. The index was up about 0.7% in the morning on the oil slide but gave most of it back after CPI, leaving a long upper wick to 10,868.51. Brent fell to about $92 on Monday and is below $90 today, which lifts Europe but weighs on London’s energy majors, while the BoE’s Pill speaks at 18:30 GMT. A close under 10,630 would end the setup.

Key levels
- Support 2
- 10,692
- Support 1
- 10,748
- Resistance 1
- 10,868
- Resistance 2
- 10,950
- Price (≈10,805) is above all three averages (10,749, 10,696 and 10,692), which form a support shelf. The early-November spike to about 10,950 was rejected at the upper line, and today’s 10,868 wick repeats the pattern. London closes at 16:30 GMT.
- RSI 54.33 above its 52.31 average: neutral. A close above 10,868 targets 10,950 and the triangle top; a close under 10,692 opens the rising lower line near 10,580.
Setup: Long at 10,700, stop 10,630, targets 10,868, 10,950 and 11,000. Reward:risk 2.4 / 3.6 / 4.3, low conviction. Cancel if a 4-hour close under 10,630, or if a hawkish Fed reaction drags Europe lower before the entry fills. Cancel if unfilled by 21:00 GMT today.
DAX 40 (GER40) | Investing.com basis, Xetra feed (TradingView) chart
DAX 40 Analysis: Price Holds the Upper Half of Its Rising Channel but Fades From 26,634, With the Recent 26,700 High in Reach
≈26,530 ≈+263 (≈+1.0%), estimated Previous close 26,267.19 | Morning high 26,633.78
Outlook: Bias is higher on dips while price holds above the 25,743 average cluster. The DAX was up about 1.1% in the morning as oil fell and the STOXX 600 pushed toward its August record, then held about +1.0% after the hot US CPI as Infineon’s record quarter lifted chips. Monday’s 26,267 close is the first pullback marker. A 4-hour close under 25,950 would end the setup.

Key levels
- Support 2
- 25,743
- Support 1
- 26,267
- Resistance 1
- 26,700
- Resistance 2
- 27,000
- Price (≈26,530) is above all three averages (25,743, 25,596 and 25,566), which have turned up and crossed under price. The early-November wick near 26,700 was rejected, and the channel top near 27,000 is the next ceiling. Xetra closes at 16:30 GMT.
- RSI 61.24 above its 56.29 average: firm momentum, not overbought. A close above 26,700 targets 27,000; a close under 26,267 opens 25,743.
Setup: Long at 26,250, stop 25,950, targets 26,700, 26,950 and 27,200. Reward:risk 1.5 / 2.3 / 3.2, medium conviction. Cancel if a 4-hour close under 25,950, or if Wall Street sells off after the 10-year auction before the entry fills. Cancel if unfilled by 21:00 GMT today.
Nikkei 225 (JP225) | Investing.com basis, TVC feed (TradingView) chart
Nikkei 225 Analysis: 2.9% Rebound Retests the Broken Triangle Floor From Below as SoftBank Surges 13.9% and Hot US CPI Clouds Wednesday’s Open
60,459.36 +1,684.08 (+2.87%) on the daily chart Previous close 58,775.28 | Range 59,268.43 to 60,743.97
Outlook: Bias is lower on bounces under 61,700, with low conviction because the tape is oversold. Tokyo closed up 2.87% at 60,459 (Investing.com JP225 shows 60,459.50) as AI and chip names rebounded, SoftBank jumped 13.9% and crude fell, but the index remains about 16% under its 22 June record close of 72,354 after a 9.25% weekly drop. A close above 63,243 would end the setup.

Key levels
- Support 2
- 58,775
- Support 1
- 59,268
- Resistance 1
- 61,700
- Resistance 2
- 63,243
- Price (60,459) is under all three averages (63,243, 65,038 and 66,210) and under the broken triangle floor near 61,700. Tokyo is closed until 00:00 GMT, so Wednesday’s open must absorb the hot CPI and any US evening move.
- RSI 39.79 above its 38.12 average: weak, bouncing from oversold. A close above 61,700 targets 63,243; a close under 59,268 opens 58,775 and then 56,800.
Setup: Short at 61,600, stop 62,800, targets 59,300, 58,775 and 56,800. Reward:risk 1.9 / 2.4 / 4.0, low conviction. Cancel if a 4-hour close above 62,800, or if Asia opens strongly on a Wall Street rebound before the entry fills. Cancel if unfilled by 21:00 GMT today.
Conclusion
A fully priced December hike and a hot CPI keep rate-sensitive tech on the back foot, so we prefer selling bounces in the Nasdaq 100 near 28,150 and the S&P 500 near 7,565 (both medium) and the Nikkei 225 near 61,600 (low), and buying dips in the DAX near 26,250 (medium) and the FTSE 100 near 10,700 (low). The session risks are the Europe close at 16:30 GMT, the 10-year auction at 18:00, Schmid and Pill at 18:30, Bowman at 20:30 and the Tokyo open at 00:00 GMT. A 4-hour close above 28,600 in the Nasdaq 100 or under 25,950 in the DAX would change the picture.
Trade the Nasdaq 100, S&P 500, FTSE 100, DAX 40 and Nikkei 225 with Capital Street FX.
Frequently Asked Questions
What is the indices outlook for today?
At 15:10 GMT the S&P 500 is down 0.19% at 7,535.90 and the Nasdaq 100 about 0.2% lower near 27,850 after October CPI beat forecasts, while the DAX is up about 1.0% and the FTSE 100 about 0.2%. The Nikkei closed up 2.87% at 60,459. A December Fed hike is priced near 99%.
Which index trade ideas are live today?
Short Nasdaq 100, S&P 500 and Nikkei 225 on bounces, and long FTSE 100 and DAX 40 on dips, each with a stop and three targets valid until 21:00 GMT.
What time are the key events in GMT?
Europe closes at 16:30 GMT, the US 10-year auction is at 18:00, Schmid and Pill speak at 18:30, Bowman at 20:30, US cash markets close and setups expire at 21:00, Paulson speaks at 23:00 and Tokyo opens at 00:00 GMT on 11 November.
Why are the Nasdaq 100 and S&P 500 lower today?
Core CPI rose 0.3% for a third month, the 10-year yield rose to about 4.93% and Waller said a 50 basis point hike should be considered. Both indices are also retesting the floors of channels they broke last week.
Is the Nikkei rebound sustainable?
The 2.87% gain is a bounce from an oversold bear-market drop, and price is still under the broken triangle floor near 61,700 and every average. A close above 63,243 would be needed to change that view, and Wednesday’s open must absorb the hot US CPI.