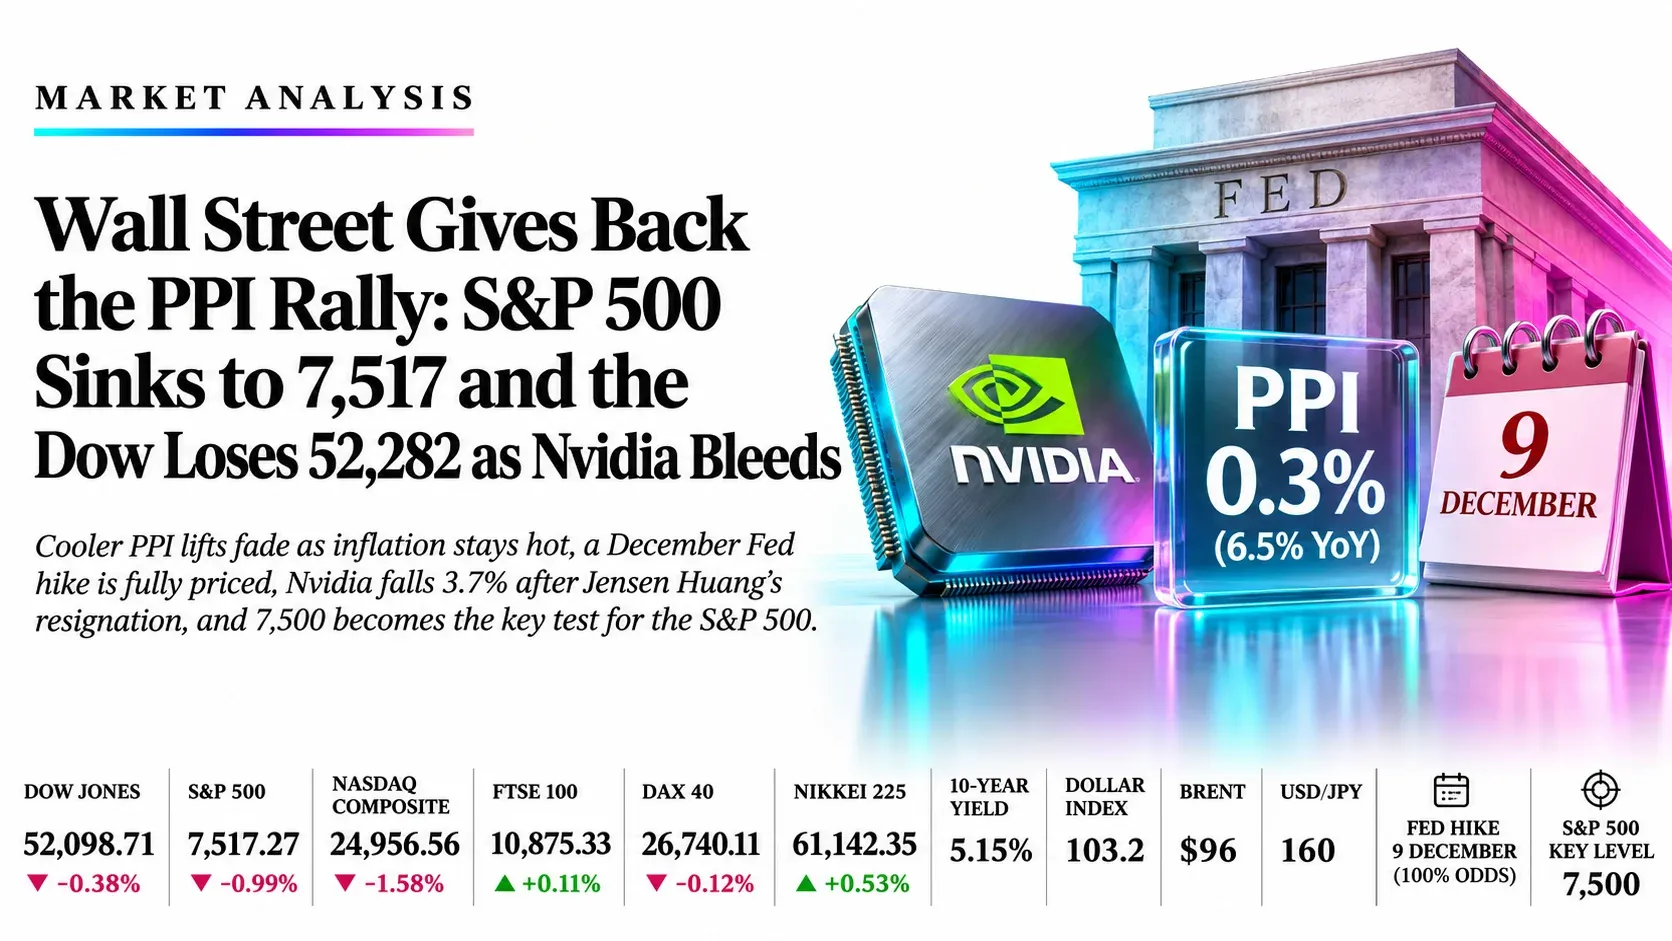
Wall Street Gives Back the PPI Rally: S&P 500 Sinks to 7,517 and the Dow Loses 52,282 as Nvidia Bleeds | Technical Analysis – Index Report | 13 Nov 2026
LIVE Indices | Friday 13 November 2026 | 15:28 GMT live update, Wall Street one hour into the session | Tokyo closed, London and Frankfurt in the final hour
Wall Street Gives Back the PPI Rally: S&P 500 Sinks to 7,517 and the Dow Loses 52,282 as Nvidia Bleeds
Market Overview
The cooler-PPI rally is over: Wall Street has handed back its entire opening gain, the S&P 500 is just 17 points above the 7,500 floor and the Dow has lost its 52,282 average. At 15:28 GMT, an hour into the US session, the S&P 500 is at 7,517.27 (-0.99%), the Nasdaq Composite at 24,956.56 (-1.58%) and the Dow Jones at 52,098.71 (-0.38%), after trading as high as 52,526 earlier. October PPI rose 0.3% against 0.4% expected and core rose 0.3%, but the annual rate of 6.5% is the highest since November 2022, so CME FedWatch still shows 100% odds of a rate rise on 9 December (about 86% for 25 basis points and 14% for 50). The 10-year yield is near 5.15% and the dollar index near 103.2.
Nvidia and the Fed decide whether 7,500 holds. Nvidia is down about 3.7% after Jensen Huang’s resignation, with third-quarter earnings due on Tuesday and Colette Kress as interim CEO, and the Fed’s Bowman speaks at 15:50 GMT. Europe is holding up better, with the FTSE 100 at 10,875.33 (+0.11%) and the DAX 40 at 26,740.11 (-0.12%) at the 14:47 GMT reading, but both close at 16:30 GMT and are exposed to Wall Street’s slide. The Nikkei closed at 61,142.35 (+0.53%) after failing at 61,902.50, Brent is near $96 and USD/JPY sits at the 160 intervention zone. The RSI readings of 52.87, 48.76, 58.32, 64.05 and 42.98 from the 14:47 GMT charts show no stretched market except the DAX. Desk plan: buy the Dow only on a dip to 51,990, buy dips in the FTSE 100 and DAX, and sell bounces in the S&P 500 and Nikkei. US prices are the 15:28 GMT cash-index readings; European and chart readings are from the 14:47 GMT capture.
Key highlights
- Dow Jones: Price 52,098.71 has slipped under the 52,450.78 and 52,281.78 averages onto the base of the narrowing triangle; 52,282 now caps and 51,981 holds.
- S&P 500: Price 7,517.27 is under all three averages (7,615 to 7,668) and 17 points above 7,500; 7,626 caps and 7,500 supports.
- FTSE 100: Price 10,875.33 is pressing the falling line above three averages with RSI 58.32; 10,900 caps and 10,836 holds.
- DAX 40: Price 26,740.11 is near the top of a rising channel and 810 points above the average with RSI 64.05; 26,833 caps and 26,520 supports.
- Nikkei 225: Close 61,142.35 is under the broken April trendline and the 62,406 average with RSI 42.98; 61,900 caps and 60,800 supports.
What’s Moving Indices Today
October PPI rises 0.3%, below the 0.4% forecast, but the annual rate of 6.5% is the highest since November 2022
Producer prices rose 0.3% on the month against 0.4% expected, after a revised 1.4% rise in September, and core PPI rose 0.3% as expected with the annual core rate steady at 5.0%. The release at 13:30 GMT gave the Dow and S&P 500 an early lift at the 14:30 GMT open, but the gains faded within the hour as the yearly rate of 6.5% kept the Fed focus on inflation.
Source: TheStreet, TradingView News, FXStreet, 13 Nov 2026
A December hike is a certainty in futures pricing, the 10-year yield tops 5.1% and the dollar index sits near a 19-month high
CME FedWatch shows 100% odds of a rise on 9 December, with about 86% for 25 basis points and 14% for 50. The 10-year Treasury yield rose to about 5.15% after jumping more than 13 basis points on Thursday, when Fed officials Williams, Daly and Hammack backed more tightening, and Chicago Fed’s Goolsbee said the central bank has work to do on inflation. The dollar index was near 103.18 early in the day.
Source: CNBC, Saxo, Reuters via Investing Cube, GGMA, 13 Nov 2026
Nvidia gives back its pre-market gain after Jensen Huang’s resignation, and the Nasdaq Composite slides about 1.6% as the S&P 500 sinks toward 7,500
Huang resigned as chief executive on Thursday and CFO Colette Kress is interim CEO. Nvidia rose more than 2% in pre-market trading, then turned lower, and was down about 3.7% at 15:28 GMT with the Nasdaq Composite down about 1.58% and the S&P 500 down about 0.99%. Nvidia’s third-quarter earnings are due on Tuesday. The Dow is falling less, about 0.38%, because Nvidia is only about 2% of the price-weighted index.
Source: Yahoo Finance, CNBC, TipRanks, 13 Nov 2026
Brent holds near $96 after Trump says the US does not need a deal with Iran, which supports FTSE energy shares
Brent was about $96.1 and WTI near $88.6 in the morning after Thursday’s 3.3% jump, with the US blockade in place and Hormuz risks still live. Energy stocks led the FTSE 100 at 12:47 GMT, with Centrica up 3.3%, Shell up 1.58% and BP up 1.25%.
Source: CNBC, Saxo, NordFX, Investing.com, 13 Nov 2026
European shares ease from a record close as the STOXX 600 slips 0.1% to 0.2% and French inflation hits 3.7%
The STOXX 600 eased from Thursday’s record, the DAX was down about 0.3%, the FTSE 100 was little changed to slightly higher and French inflation rose to 3.7% in October, its highest since December 2023. Goldman Sachs raised its 12-month STOXX 600 target to 700 from 695, and the Kremlin has not confirmed European participation in Ukraine peace talks.
Source: Investing.com, Reuters via Yahoo Finance, 13 Nov 2026
Nikkei closes up 0.53% at 61,142.35 after fading from 61,902.50, with USD/JPY at 160 and JGB yields rising
The Nikkei reached 61,902.50 and stood at 61,816.72 at the morning close before giving back most of its gain. The yen briefly weakened past 160 per dollar in New York, and Japan’s 10-year yield rose 5.9 basis points to 2.87% as the Treasury sell-off spread to Asia. The Nikkei volatility index was near 36.
Source: Investing.com, AD HOC NEWS citing JIJI, Bloomberg via GGMA, 13 Nov 2026
Key Drivers for the Rest of Today
Six things that set direction for the rest of the session in the Dow, S&P 500, FTSE 100, DAX 40 and Nikkei 225. All times are GMT.
- Yields and Fed hike pricing
- Live
- Fri 13 Nov, all session
- 10-year near 5.15% and 100% odds of a 9 December hike; hits the Dow, S&P 500 and Nikkei first
- Nvidia and the Nasdaq
- Live
- Fri 13 Nov, after the 14:30 GMT open
- Nvidia down about 3.7% with the Nasdaq down about 1.6%; decides whether the S&P 500 holds 7,500
- Fed’s Bowman speaks
- 15:50
- Fri 13 Nov, 15:50 GMT
- A hawkish tone would extend the yield and dollar rise; a cautious one would help the Dow and S&P 500
- London and Xetra close
- 16:30
- Fri 13 Nov, 16:30 GMT
- FTSE 100 and DAX cash close; sets whether 10,836 and 26,520 hold into the evening
- Iran, Hormuz and USD/JPY
- Live
- Fri 13 Nov, all session
- Oil headlines move FTSE energy shares; USD/JPY near 160 is the intervention risk for the Nikkei
- US cash close and setup expiry
- 21:00
- Fri 13 Nov, 21:00 GMT
- Wall Street closes and unfilled ideas lapse at 21:00 GMT
Swipe the strip to see every driver.
Trade Setups for Today
Ranked in the order Dow Jones, S&P 500, FTSE 100, DAX 40 and Nikkei 225, valid until 21:00 GMT today. A 4-hour close beyond the stop cancels the idea.
| Instrument | Direction | Entry | Stop | Target 1 | Target 2 | Reward:risk | Conviction |
|---|---|---|---|---|---|---|---|
| Dow Jones (US30) | Long | 51,990 | 51,800 | 52,282 | 52,800 | 1.5 / 4.3 | Low |
| S&P 500 (US500) | Short | 7,590 | 7,640 | 7,500 | 7,420 | 1.8 / 3.4 | Medium |
| FTSE 100 (UK100) | Long | 10,830 | 10,745 | 10,925 | 10,990 | 1.1 / 1.9 | Low |
| DAX 40 (DE40) | Long | 26,520 | 26,300 | 26,830 | 27,000 | 1.4 / 2.2 | Low |
| Nikkei 225 (JP225) | Short | 61,850 | 62,450 | 60,800 | 59,900 | 1.8 / 3.3 | Medium |
Reward:risk is the distance from entry to each target divided by the distance from entry to the stop. A third target for each market is in its section below. Levels come from the daily charts captured at 14:44 to 14:47 GMT (20:14 to 20:17 UTC+5:30), read from the TVC, S&P, FTSE and Xetra chart feeds. Setups were re-checked against US prices at 15:28 GMT (20:58 UTC+5:30), and the Dow idea was moved down to 51,990 because price had already traded through the original 52,250 entry. Every entry sits away from the current price and needs a pullback or a bounce to trigger. The Nikkei idea trades on index CFDs and futures because Tokyo is closed. Three ideas are long and two are short; a firmer yield and dollar would help both shorts and hit all three longs, so the book is not fully hedged. Levels are conditional technical references, not recommendations.
Risk Scenario Analysis
US yields and Nvidia are the swing factors for the rest of today.
If the 10-year yield pushes higher or Nvidia slides further, the selloff deepens
A hawkish Bowman or a stronger dollar would push the Dow under 51,981, pull the FTSE 100 and DAX toward their averages, break the S&P 500 under 7,500 and cost the Nikkei 60,800 as USD/JPY tests 160.
- Dow Jones51,981, then 51,800
- S&P 5007,500, then 7,420
- FTSE 10010,753, then 10,707
- DAX 4026,520, then 26,300
- Nikkei 22560,800, then 59,900
If yields ease and Nvidia stabilises, the indices recover the morning’s losses
A calmer bond market would let the Dow reclaim 52,282 and test 52,800, the S&P 500 recover 7,592 and then its averages, the FTSE 100 clear 10,900 and the DAX press 27,000, while the Nikkei would squeeze toward its 62,406 average.
- Dow Jones52,282, then 52,800
- S&P 5007,592, then 7,626
- FTSE 10010,925, then 10,990
- DAX 4026,830, then 27,000
- Nikkei 22561,900, then 62,406
Dow Jones (US30) | Cash index at 15:28 GMT (Yahoo Finance), levels from the TVC daily chart
Dow Jones Analysis: Price Slips to 52,099 Under the 52,282 Average and Presses the Triangle Base, With 51,981 the Last Line of Defence
52,098.71 -198.38 (-0.38%) at 15:28 GMT Previous close 52,297.09 | Session high 52,526.25 | 14:47 GMT reading 52,466.26 (+0.31%)
Outlook: Bias is neutral to lower with low conviction while price stays under 52,282, and the buy-the-dip idea moves down to 51,990. The Dow rallied to 52,526 after October PPI rose 0.3% against 0.4% expected, then gave the whole gain back as the 10-year yield held near 5.15% and Nvidia dragged the Nasdaq down about 1.6%. Price is now 183 points under the 52,281.78 average, on the rising base of the triangle near 52,100 and 117 points above the 51,981.40 average. A reclaim of 52,282 reopens 52,800; a close under 51,981 confirms the break of the triangle base.

Key levels
- Support 2
- 51,981
- Support 1
- 52,282
- Resistance 1
- 52,800
- Resistance 2
- 53,700
- Price (52,098.71) has dropped under the 52,450.78 and 52,281.78 averages and sits 117 points above the 51,981.40 average. Main catalysts: the 10-year yield near 5.15%, Nvidia and the Nasdaq, the Fed’s Bowman at 15:50 GMT and the US cash close at 21:00 GMT. CME FedWatch shows 100% odds of a hike on 9 December.
- RSI 52.87 over its 51.13 average at the 14:47 GMT capture was neutral, and the fall since then points to momentum rolling over. A close back above 52,282 targets 52,800 and 53,300; a close under 51,981 breaks the triangle base.
Setup: Long at 51,990 on a dip into the 51,981 average, stop 51,800, targets 52,282, 52,800 and 53,300. Reward:risk 1.5 / 4.3 / 6.9, low conviction. Cancel if a 4-hour close under 51,800, or if the 10-year yield breaks to a fresh high. Cancel if unfilled by 21:00 GMT today.
S&P 500 (US500) | Cash index at 15:28 GMT (Yahoo Finance), levels from the S&P daily chart
S&P 500 Analysis: Price Slides 1% to 7,517, 17 Points Above the 7,500 Floor, With Nvidia Dragging the Nasdaq and 7,626 the Cap
7,517.27 -75.13 (-0.99%) at 15:28 GMT Previous close 7,592.40 | Open 7,609.06 | Session high 7,621.78 | Nasdaq Composite 24,956.56 (-1.58%)
Outlook: Bias is lower on bounces with medium conviction while 7,626 holds, and the break under 7,600 has put the 7,500 floor in play. The index opened at 7,609.06, peaked at 7,621.78 and has since slid about 1%, with the Nasdaq Composite down about 1.6% as Nvidia fell about 3.7%. Price is under the 7,615.14, 7,626.35 and 7,668.21 averages, and Thursday’s close of 7,592.40 is the first bounce target for sellers. A close back above 7,626 would cancel the idea; a break under 7,500 points to 7,420.

Key levels
- Support 2
- 7,420
- Support 1
- 7,500
- Resistance 1
- 7,626
- Resistance 2
- 7,668
- Price (7,517.27) is under all three averages, which stack from 7,615 to 7,668 as resistance. Main catalysts: Nvidia (earnings due Tuesday, Kress is interim CEO), the 10-year yield and the 15:50 GMT Bowman speech. Thursday’s close of 7,592.40 is the first level to reclaim on any bounce.
- RSI 48.76 over its 44.96 average at the 14:47 GMT capture was flat, and the 1% slide since then points to momentum rolling over. A close under 7,500 targets 7,420; a close above 7,668 breaks the setup.
Setup: Short at 7,590 on a bounce back to Thursday’s close, about 70 points above the current price, stop 7,640, targets 7,500, 7,420 and 7,340. Reward:risk 1.8 / 3.4 / 5.0, medium conviction. Do not chase if 7,500 breaks first. Cancel if a 4-hour close above 7,640, or if Nvidia and the Nasdaq reverse sharply higher. Cancel if unfilled by 21:00 GMT today.
FTSE 100 (UK100) | Investing.com basis, FTSE chart feed
FTSE 100 Analysis: Price Presses the Top of the Falling Line at 10,875 Above All Three Averages With 10,836 the Line to Defend
10,875.33 +12.23 (+0.11%) on the chart feed Previous close 10,863.10 | Open 10,863.28 | Range 10,836.63 to 10,896.53 | Thursday close 10,863.09 | Reading at 14:47 GMT
Outlook: Bias is higher on dips with low conviction while 10,836 holds. Energy shares are leading because Brent is near $96 after Trump said no Iran deal is needed (Shell, BP and Centrica were among the gainers at 12:47 GMT), and sterling is steady near 1.3224. A close above 10,900 clears the falling line and opens 10,990; a close under 10,753 points back to the 10,707 average.

Key levels
- Support 2
- 10,753
- Support 1
- 10,836
- Resistance 1
- 10,900
- Resistance 2
- 10,990
- Price (10,875.33) is above all three averages (10,694 to 10,753) with RSI 58.32 over its 53.14 average, so momentum is firm but not stretched. Main catalysts: oil and Iran headlines, the 15:50 GMT Bowman speech and the London close at 16:30 GMT.
- The index has held 10,836 as the low of the day. A close above 10,900 targets 10,990 and 11,000; a close under 10,753 puts 10,707 in sight.
Setup: Long at 10,830, stop 10,745, targets 10,925, 10,990 and 11,050. Reward:risk 1.1 / 1.9 / 2.6, low conviction. Cancel if a 4-hour close under 10,745, or if Brent drops sharply. Cancel if unfilled by 21:00 GMT today.
DAX 40 (DE40) | Investing.com basis, XETR chart feed
DAX 40 Analysis: Price Eases to 26,740 Near the Top of the Rising Channel, 800 Points Above the Average, With 26,520 the Dip Level
26,740.11 -31.77 (-0.12%) on the chart feed Previous close 26,771.88 | Open 26,697.03 | Range 26,678.35 to 26,832.82 | Reading at 14:47 GMT | French October inflation 3.7%
Outlook: Bias is higher on dips with low conviction while 26,300 holds. The DAX is slightly lower after a four-session winning streak, with the STOXX 600 slipping from Thursday’s record close and French inflation at 3.7% in October, its highest since December 2023. Price is stretched above the 25,930.22 average, so the idea waits for a pullback to 26,520. A close above 26,833 opens 27,000; a close under 26,300 cancels the idea.

Key levels
- Support 2
- 26,300
- Support 1
- 26,520
- Resistance 1
- 26,833
- Resistance 2
- 27,000
- Price (26,740.11) is 810 points above the 25,930.22 average, with RSI 64.05 over its 59.52 average. Main catalysts: the 10-year Bund yield, Wall Street’s direction after the open, and the Xetra close at 16:30 GMT.
- Today’s high of 26,832.82 is the first cap. A close above 26,833 targets 27,000 and 27,150; a close under 26,300 puts the channel base in sight.
Setup: Long at 26,520, stop 26,300, targets 26,830, 27,000 and 27,150. Reward:risk 1.4 / 2.2 / 2.9, low conviction. Cancel if a 4-hour close under 26,300, or if US yields push sharply higher. Cancel if unfilled by 21:00 GMT today.
Nikkei 225 (JP225) | Investing.com close, TVC chart feed
Nikkei 225 Analysis: Price Closes at 61,142 Under the Broken April Trendline and the 62,406 Average, With 61,900 the Cap and 60,800 the Floor
61,142.35 +322.99 (+0.53%) at the Tokyo close (TVC 61,142.13) Previous close 60,819.36 | Open 61,223.41 | Range 61,082.23 to 61,902.50 | Tokyo closed at 06:00 GMT
Outlook: Bias is lower on a bounce with medium conviction while 61,900 holds. Tokyo is closed, so the idea trades on index CFDs and futures. The index rallied to 61,902.50 and gave back most of the gain, with the yen briefly weaker than 160 per dollar, USD/JPY near 159.84 and the 10-year JGB yield up 5.9 basis points to 2.87%. Price is retesting the underside of the broken April trendline under the 62,406.26 average. A close above 62,406 cancels the idea; a break under 60,800 points to 59,900.

Key levels
- Support 2
- 59,900
- Support 1
- 60,800
- Resistance 1
- 61,900
- Resistance 2
- 62,406
- Price (61,142.35) is under the 62,406.26, 64,726.04 and 65,955.39 averages, and RSI 42.98 over its 39.04 average shows momentum recovering from a low reading. Main catalysts: USD/JPY near the 160 intervention zone, US yields and Nvidia-linked chip stocks.
- Today’s high of 61,902.50 touched the trendline and failed. A close under 60,800 (Thursday’s close of 60,819) targets 59,900 and 58,800; a close above 62,406 breaks the setup.
Setup: Short at 61,850 on a bounce, stop 62,450, targets 60,800, 59,900 and 58,800. Reward:risk 1.8 / 3.3 / 5.1, medium conviction. Cancel if a 4-hour close above 62,450, or if USD/JPY falls sharply on intervention. Cancel if unfilled by 21:00 GMT today.
Conclusion
The PPI was cooler, but the rally did not survive a 10-year yield above 5.1% and a fully priced December hike: the S&P 500 now sits 17 points above 7,500 and the Dow has lost 52,282. We prefer selling bounces in the S&P 500 near 7,590 and the Nikkei near 61,850 (both medium conviction) and buying dips in the Dow near 51,990, the FTSE 100 near 10,830 and the DAX near 26,520 (all low). The session risks are Nvidia, the Fed’s Bowman at 15:50 GMT, the London and Xetra close at 16:30 and the US close at 21:00 GMT. A 4-hour close under 51,800 in the Dow or above 7,640 in the S&P 500 would change the picture, and a break under 7,500 would open 7,420.
Trade the Dow Jones, S&P 500, FTSE 100, DAX 40 and Nikkei 225 with Capital Street FX.
Frequently Asked Questions
What is the indices outlook for today?
Wall Street has given back its post-PPI gains, with the S&P 500 at 7,517 near the 7,500 floor, the Nasdaq down about 1.6% and the Dow under 52,282 at 52,099. The FTSE 100 and DAX are near their highs and the Nikkei closed at 61,142 under a broken trendline. The 10-year yield above 5.1% and Nvidia are the main swing factors.
Which index trade ideas are live today?
Long Dow Jones, FTSE 100 and DAX 40 on dips, and short S&P 500 and Nikkei 225 on bounces, each with a stop and three targets valid until 21:00 GMT.
What time are the key events in GMT?
US stocks opened at 14:30 GMT, the Fed’s Bowman speaks at 15:50, the London and Xetra cash markets close at 16:30, Wall Street closes at 21:00 and setups expire at 21:00 GMT. Tokyo closed at 06:00 GMT.
Why did the Dow and S&P 500 move differently today?
The Dow is price-weighted and holds only about 2% in Nvidia, while the S&P 500 and the Nasdaq carry far more technology weight, so Nvidia’s slide after Jensen Huang’s resignation weighs more on them.
What did the October PPI show?
Producer prices rose 0.3% on the month against 0.4% expected, with core also up 0.3%. The annual rate was 6.5%, the highest since November 2022, so a December Fed hike is still fully priced.