Nasdaq 100 Forecast: AI Chip Selloff and DAX Rally | Index Daily Analysis | 16/10/2026
Indices Today | Friday 16 October 2026
AI Chip Selloff Drags the Nasdaq 100 Toward 29,070 While the DAX Climbs
Market Overview
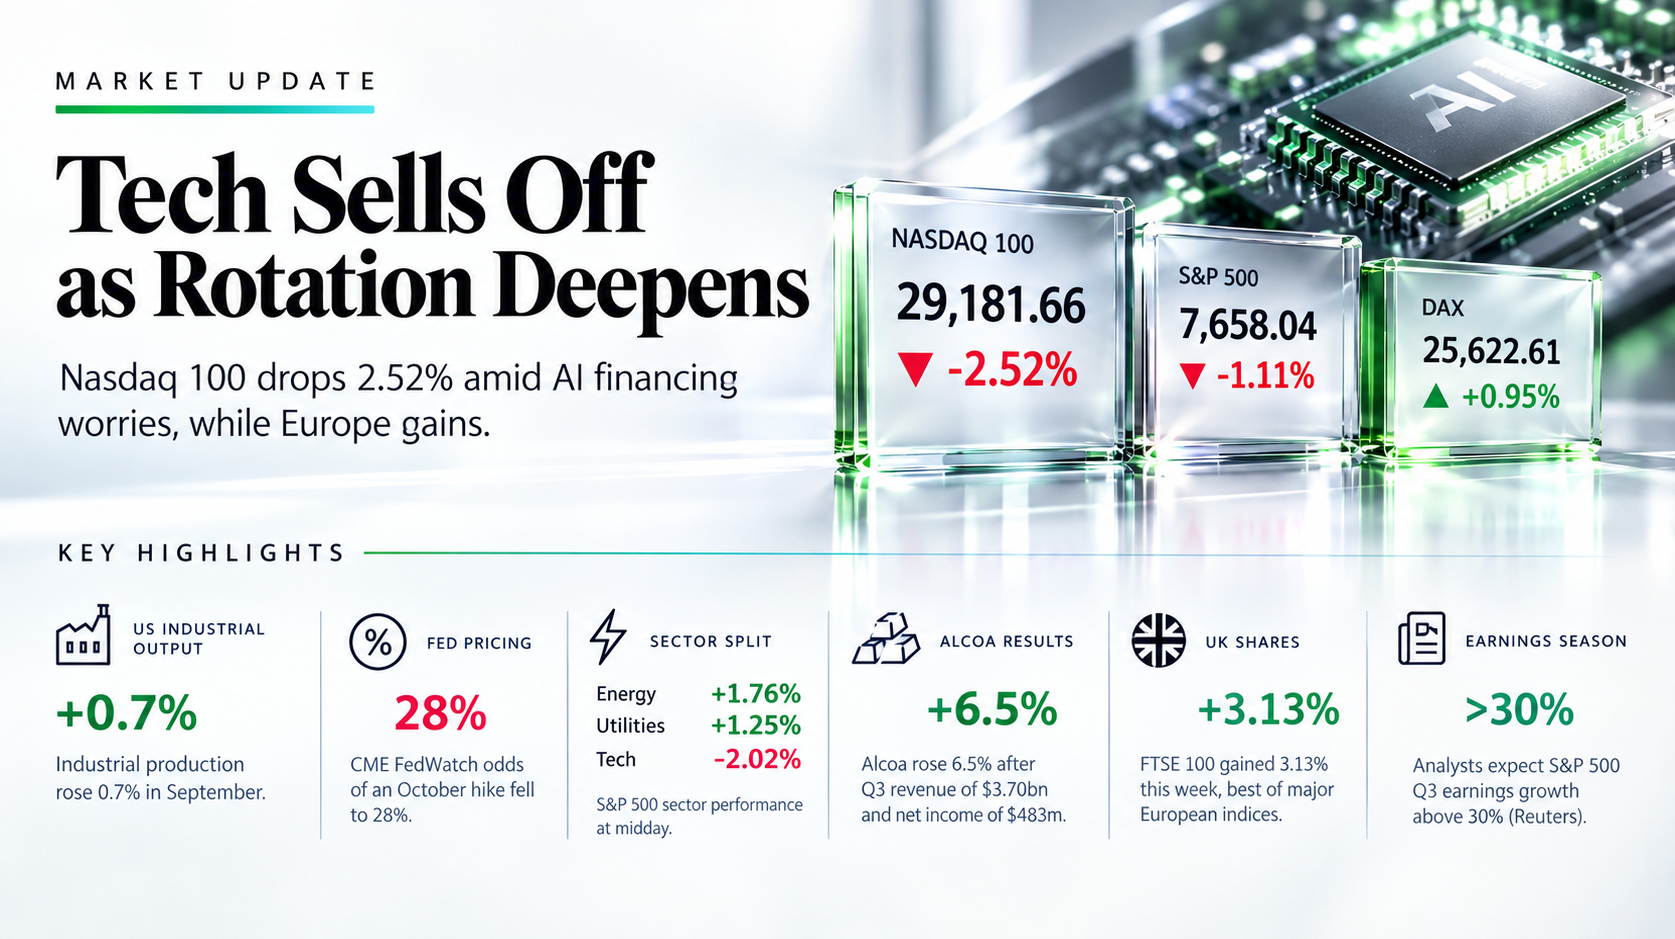
The rotation out of US technology deepened on Friday 16 October. The Nasdaq 100 fell 2.52% to 29,181.66 by 19:55 GMT as worries over the financing of AI data centres hit chip makers for another session, with Micron, AMD and Broadcom down 3% to 4% by midday. The S&P 500 lost 1.11% to 7,658.04 and is heading for its lowest close since 30 September, while defensive sectors and energy limited the damage. Europe moved the other way: the DAX closed 0.95% higher at 25,622.61, led by carmakers and defence shares, as money shifted toward cheaper cyclical markets. For the desk, the Nasdaq 100 is the index to watch next week: holding Friday’s low keeps this a sector rotation, while a break would turn it into a broader risk reduction.
Key highlights
- Industrial output: US industrial production rose 0.7% in September, with manufacturing up 0.3% and utilities output up 3.5%, Federal Reserve data showed.
- Fed pricing: CME FedWatch odds of an October hike fell to 28% on Thursday afternoon after reaching 50% on Wednesday’s inflation data, Axios reported.
- Sector split: At midday, S&P 500 energy shares were up 1.76% and utilities 1.25%, while technology was down 2.02%.
- Alcoa results: Alcoa rose 6.5% after third-quarter revenue of $3.70bn and net income of $483m.
- UK shares: The FTSE 100 gained 3.13% this week, the best of the major European indices, and closed at 10,881.91.
- Earnings season: Analysts expect S&P 500 companies to report third-quarter earnings growth above 30%, according to Reuters estimates.
What’s Moving Indices Today
AI Financing Worries Hit Chip Makers for Another Session
CoreWeave’s bonds yielded above 15% and its shares fell as much as 7.6%, prompting funds to cut exposure to AI-linked companies. Intel fell 4.4% by midday and the Philadelphia chip index about 1.8% in the morning.
Source: Reuters via TS2 and Coinpaper, 16 Oct 2026
Bank Shares Lift the Dow to a One-Month High Before It Fades
JPMorgan rose about 2.3% and Goldman Sachs 2.0% in the morning after strong trading results, with Goldman’s equities revenue up 72%. The Dow later gave back a 405-point gain as chip stocks fell.
Source: Coinpaper and TS2, 16 Oct 2026
Warsh Declines to Signal an October Rate Move
Speaking with IMF chief Kristalina Georgieva in Bangkok, Fed Chair Kevin Warsh said he does not prejudge meetings and that the economy has matched expectations since September’s hike, the first since 2023.
Source: Axios and CNBC, 16 Oct 2026
Key Drivers Today
Five readings and events that set direction for the major stock indices. All times are GMT.
- US 10-year yield
- 5.12%
- Up about 2 bp at midday
- Dollar index
- 101.65
- Down 0.40% on Friday
- Brent crude
- $107.35
- Hormuz risk lifts energy shares
- Netflix Q3 results
- After close
- Streaming test after job cuts
- Fed decision
- Hike risk
- Statement, then press conference
Swipe the strip to see every driver.
Trade Setups for Today
Ranked by conviction and valid for today’s session. A 1-hour close beyond the stop cancels the idea.
| Index | Direction | Entry | Stop | Target 1 | Target 2 | Reward:risk | Conviction |
|---|---|---|---|---|---|---|---|
| S&P 500 | Short | 7,740 | 7,790 | 7,620 | 7,510 | 2.4 / 4.6 | Medium |
| Nasdaq 100 | Short | 29,850 | 30,100 | 29,080 | 28,760 | 3.1 / 4.4 | Medium |
| Dow Jones 30 | Long | 51,400 | 51,100 | 52,440 | 52,740 | 3.5 / 4.5 | Medium |
| DAX 40 | Long | 25,320 | 25,120 | 25,710 | 26,010 | 2.0 / 3.5 | Medium |
| Euro Stoxx 50 | Long | 6,175 | 6,140 | 6,235 | 6,305 | 1.7 / 3.7 | Low |
Reward:risk is the distance from entry to each target divided by the distance from entry to the stop. Levels are conditional technical references, not recommendations.
Chip Selloff Versus Rotation Scenario Analysis
Money is leaving US chip and AI shares for banks, energy and European cyclicals. Whether chip stocks stabilise or extend their slide decides if this stays a rotation or becomes a wider retreat.
Rotation holds: the Nasdaq 100 reclaims 29,870 on a daily close
Stable chip shares would let the US benchmarks recover toward their averages while banks keep the Dow firm.
- Nasdaq 10029,870, then 30,520
- S&P 5007,740, then 7,845
- Dow Jones 3052,460, then 52,750
Selloff spreads: a daily close below 29,070 on the Nasdaq 100
A break would point to forced selling across AI-linked shares and would likely pull European indices off their weekly gains.
- Nasdaq 10029,070, then 28,750
- S&P 5007,617, then 7,508
- DAX 4025,300, then 24,790
S&P 500 | US500
S&P 500 Analysis: Drop Below the 20-Day Average Turns Focus to 7,617 Support
7,658.04 −86.02 (−1.11%) day Day range 7,631.77–7,756.84
Outlook: Bias is bearish below 7,740, where the 20-day average sits. Technology losses outweighed gains in energy and utilities on Friday, and the 1 October low is the first support if chip shares keep falling.
Key levels
- Support 2
- 7,508
- Support 1
- 7,617
- Resistance 1
- 7,740
- Resistance 2
- 7,845
- Friday broke below the 7,780–7,820 range held from 6 to 13 October; the next floors are the 7,616.78 low of 1 October and the 7,507.77 low of 16 September.
- Price sits below the 7,739 20-day and 7,706 50-day averages, and RSI at 43.9 has slipped under 50.
Setup: Short at 7,740, stop 7,790, targets 7,620 and 7,510. Reward:risk 2.4 / 4.6, medium conviction.
Nasdaq 100 | US100
Nasdaq 100 Analysis: Chip Losses Push Price Back Under the 29,870 Average
29,181.66 −753.94 (−2.52%) day Day range 29,073.29–29,822.91
Outlook: Bias is bearish below the 50-day average near 29,870. Semiconductors led a second weak session after Thursday’s rebound faded, and a close below 29,070 would expose the September low.
Key levels
- Support 2
- 28,750
- Support 1
- 29,070
- Resistance 1
- 29,870
- Resistance 2
- 30,520
- The index has dropped from the 31,361 high of 6 October to Friday’s low in a run of lower highs and lower lows; the 28,753 low of 16 September is the next floor.
- Price trades below the 30,524 20-day and 29,868 50-day averages, and RSI at 35.1 is the weakest of the five indices.
Setup: Short at 29,850, stop 30,100, targets 29,080 and 28,760. Reward:risk 3.1 / 4.4, medium conviction.
Dow Jones 30 | US30
Dow Jones 30 Analysis: Rejection From 52,582 Leaves the 51,370 Floor in Focus
51,964.01 −213.68 (−0.41%) day Day range 51,847.94–52,582.32
Outlook: Bias is neutral to bullish while the index holds 51,370. Bank buying took it to 52,582 before chip losses pulled it lower, yet the Dow remains the firmest US benchmark this week.
Key levels
- Support 2
- 50,550
- Support 1
- 51,370
- Resistance 1
- 52,460
- Resistance 2
- 52,750
- Higher lows at 50,547 on 1 October and 51,365 on 14 October support the recovery, while the 52,751 high of 14 September caps it.
- Price holds above the 51,529 20-day average but below the 52,460 50-day, and RSI at 51.9 is neutral.
Setup: Long at 51,400, stop 51,100, targets 52,440 and 52,740. Reward:risk 3.5 / 4.5, medium conviction.
DAX 40 | DE40
DAX 40 Analysis: Close Above the 25,300 Average Puts 25,720 Resistance in Reach
25,622.61 +239.99 (+0.95%) day Day range 25,466.09–25,693.89
Outlook: Bias is bullish above the 20-day average near 25,300. German shares rose 2.13% on the week as investors moved from US technology into European cyclicals, with Rheinmetall and BMW among the leaders on Friday.
Key levels
- Support 2
- 24,790
- Support 1
- 25,300
- Resistance 1
- 25,720
- Resistance 2
- 26,030
- Higher lows at 24,793 on 8 October and 25,134 on 15 October have built a base under the 25,720 50-day average.
- Price sits above the 25,296 20-day average, and RSI at 55.0 is the firmest reading in the group.
Setup: Long at 25,320, stop 25,120, targets 25,710 and 26,010. Reward:risk 2.0 / 3.5, medium conviction.
Euro Stoxx 50 | EU50
Euro Stoxx 50 Analysis: Recovery Stalls Below the 6,240 Resistance Zone
6,204.23 +35.97 (+0.58%) day Day range 6,177.45–6,223.62
Outlook: Bias is neutral while the index holds 6,170. It lagged the DAX as French shares added only 0.28%, and it needs a close above the 20-day average to end the October downtrend.
Key levels
- Support 2
- 6,090
- Support 1
- 6,170
- Resistance 1
- 6,240
- Resistance 2
- 6,310
- Lower highs at 6,365 on 29 September and 6,311 on 6 October define the downtrend, and the 6,090 low of 8 October is the floor.
- Price trades below the 6,237 20-day and 6,341 50-day averages, and RSI at 45.5 sits just under 50.
Setup: Long at 6,175, stop 6,140, targets 6,235 and 6,305. Reward:risk 1.7 / 3.7, low conviction.
Conclusion
Investors are selling US semiconductor names and buying banks, energy and European cyclicals, so the main indices are moving in different directions. The desk sells rallies in the Nasdaq 100 and S&P 500 toward their averages and buys pullbacks in the DAX and the Dow, with the Euro Stoxx 50 kept small. Netflix results on Tuesday after 20:00 GMT test technology sentiment, and the Fed decision on 28 October at 18:00 GMT remains the larger risk.
Trade S&P 500, Nasdaq 100, Dow Jones 30 and other indices with Capital Street FX.
Frequently Asked Questions
Why is the Nasdaq falling today?
Concern about how AI data centres are financed, led by CoreWeave’s rising borrowing costs, pushed investors to sell chip and AI shares. Because those companies carry a large weight in the Nasdaq 100, the index falls more than broader benchmarks.
Why are European stocks rising while US tech falls?
European indices hold fewer technology companies and more banks, carmakers, industrials and defence firms. As money rotates out of expensive US chip shares, these cheaper cyclical sectors attract buyers, which is why the DAX rose this week.
How do bond yields affect stock indices?
Higher Treasury yields raise borrowing costs and make future profits worth less today, which hurts fast-growing technology shares most. Banks can benefit from higher rates, which helps the Dow hold up better than the Nasdaq.
What did Fed Chair Warsh say about interest rates?
Warsh gave no signal on the October decision, saying the Fed does not prejudge meetings. He added that the economy has broadly matched expectations since the September hike, leaving markets to weigh the latest inflation data.