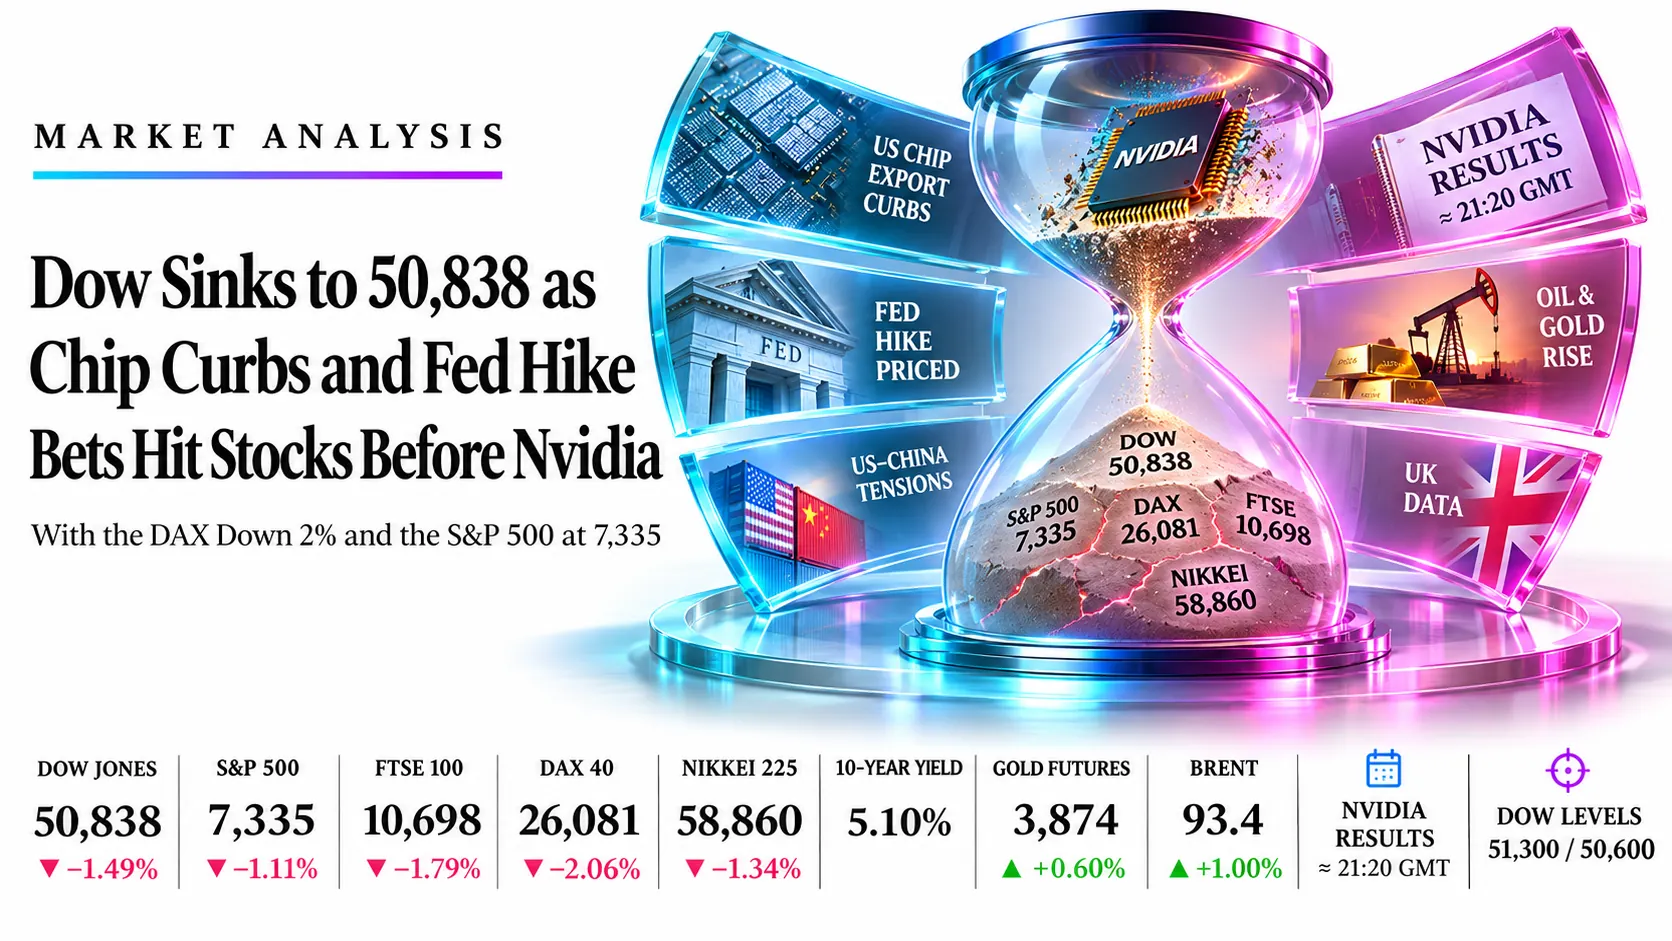
Dow Sinks to 50,838 as Chip Curbs and Fed Hike Bets Hit Stocks Before Nvidia, With the DAX Down 2% and the S&P 500 at 7,335 | Technical Analysis – Index Report | 17 Nov 2026
LIVE Indices | Tuesday 17 November 2026 | Latest prices about 17:00 GMT, Wall Street open until 21:00 GMT and Nvidia results at about 21:20 GMT still to come
Dow Sinks to 50,838 as Chip Curbs and Fed Hike Bets Hit Stocks Before Nvidia, With the DAX Down 2% and the S&P 500 at 7,335
Market Overview
Global equities are falling together as US chip export curbs, hotter Fed pricing and Nvidia nerves feed a third straight day of tech selling. The Dow is at 50,837.56 (−1.49%), the S&P 500 at 7,335.00 (−1.11%), the DAX at 26,080.70 (−2.06%) and the FTSE 100 at 10,698.46 (−1.79%), while the Nikkei closed at 58,860.43 (−1.34%). US retail sales rose 0.2% as forecast, the 10-year yield is near 5.10% and a December Fed hike is priced at about 95% to 100%.
Structure matters more than direction today. The Dow, FTSE 100 and Nikkei have broken or failed at trendlines, so our read is to sell bounces there, while the S&P 500 and DAX are at channel floors where a low-conviction dip buy is possible. Nvidia reports after the 21:00 GMT US close, so unfilled setups lapse at 21:00 GMT.
Key highlights
- Dow Jones: Price 50,838 (−1.49%); 51,300 caps and 50,600 supports.
- S&P 500: Price 7,335 (−1.11%); 7,417 caps and 7,290 supports.
- FTSE 100: Price 10,698 (−1.79%); 10,780 caps and 10,620 supports.
- DAX 40: Price 26,081 (−2.06%); 26,250 caps and 25,900 supports.
- Nikkei 225: Close 58,860 (−1.34%); 59,800 caps and 57,000 supports.
What’s Moving Indices Today
US chip export rule and an Nvidia cloud of doubt push European indices down about 2% and Wall Street lower
Washington’s new rule requires licences for advanced AI chip shipments to Singapore, Malaysia, Thailand, Indonesia and Brazil, and China says it will take “necessary measures”. The STOXX 600 hit a one-week low, ASML fell about 5% and the DAX lost about 2%. Asia-Pacific shares fell about 1.2% earlier today, with Kioxia, Advantest and SoftBank the worst hit in Tokyo.
Source: Investing.com (Reuters), Newsquawk, 17 Nov 2026
US retail sales rise 0.2%, the 10-year yield holds near 5.1% and a Fed policymaker says several more hikes may be needed
October retail sales rose 0.2%, in line with Reuters’ forecast, with the control group up 0.6% and import prices above expectations. Musalem said the Fed may need as many as four more hikes before spring 2027, and CME pricing shows about a 95% to 100% chance of a December hike. The 10-year yield is near 5.10% and the dollar index is near a 19-month high of 103.6. Waller and Williams speak later.
Source: CNBC, Reuters, FXStreet, Investing.com, 17 Nov 2026
Nvidia reports after the 21:00 GMT US close, its first results without Jensen Huang, whose bid to return has pared early losses
Huang said he would return as CEO if the board asked, and Nvidia shares briefly rose nearly 3% before settling about 1% lower, although the board is reportedly not weighing his return. Interim CEO Colette Kress will face questions on strategy, export controls and the company’s financing ties with AI customers. The stock is down nearly 24% in November.
Source: Investing.com, Reuters, MLQ, 17 Nov 2026
The S&P 500 and Dow extend a three-day slide after Monday’s 1.9% drop in the S&P
On Monday the S&P 500 fell 1.92% to 7,416.59, the Dow fell 1.41% to 51,608.17 and the Nasdaq fell 2.49%, with the VIX up 18.7%. The SPY ETF closed Monday only 1.06% above its 200-day average, which today’s fall brings into play. Home Depot is down about 1.8% despite a profit beat.
Source: AP via BNN Bloomberg, moomoo, Yahoo Finance, 16 to 17 Nov 2026
UK unemployment falls to 4.6% but payrolls drop, leaving the FTSE 100 hit by miners and banks
The ONS reported unemployment at 4.6% against 4.7% expected, but payrolls fell by 34,000 and vacancies slid to 690,000, the lowest since 2014 outside the pandemic. A Bank of England hike in December is about 80% priced. Sterling is near $1.3188.
Source: Investing.com (ONS, Reuters), 17 Nov 2026
Deutsche Bank drops about 5% to 6% on leaked documents, adding to the DAX decline
The bank said the reported incidents “date back many years” and that it has improved its controls. German investor morale rose more than expected in November and the euro zone has held up better than forecast, but the equity move is being driven by tech and banks.
Source: Investing.com (Reuters), MLQ, 17 Nov 2026
Oil and gold rise as Trump warns Iran over a reported dirty-bomb plot
Brent is up about 1% near $93.4, WTI near $85.3 and gold futures near $3,874, up about 0.6%. Trump also said he meets Xi Jinping on Thursday in Shenzhen, keeping US-China chip headlines in focus today.
Source: Investing.com (Reuters), 17 Nov 2026
Key Drivers for the Rest of Today
Six things that set direction for the rest of the session in the Dow, S&P 500, FTSE 100, DAX and Nikkei.
- Fed speakers, yields, hike odds
- Live
- Tue 17 Nov, all session
- Musalem flagged several more hikes; Waller and Williams speak later; the 10-year yield is near 5.10%
- US retail sales (released)
- 13:30
- Tue 17 Nov, 13:30 GMT
- Headline +0.2% as expected, control group +0.6%; yields rose after the print
- US chip export curbs and China reply
- Live
- Tue 17 Nov, US session
- Chip and AI shares lead the fall; any Chinese response hits the DAX, Nikkei and Nasdaq first
- Setup expiry
- 21:00
- Tue 17 Nov, 21:00 GMT
- Unfilled ideas lapse at the 21:00 GMT US cash close, before Nvidia reports
- Nvidia results
- ~21:20
- Tue 17 Nov, after the US close
- First report since Huang resigned; the reaction can gap all five indices in thin evening trade
- Tokyo open
- 00:00
- Wed 18 Nov, 00:00 GMT
- The Nikkei reopens at 00:00 GMT and is the first index to price the Nvidia result
Swipe the strip to see every driver.
Trade Setups for Today
Ranked in the order Dow, S&P 500, FTSE 100, DAX and Nikkei, validated against the Investing.com live quotes at about 17:00 GMT and expiring at 21:00 GMT today.
| Instrument | Direction | Entry | Stop | Target 1 | Target 2 | Reward:risk | Conviction |
|---|---|---|---|---|---|---|---|
| Dow Jones (US30) | Short | 51,300 | 51,900 | 50,600 | 50,100 | 1.2 / 2.0 | Medium |
| S&P 500 (US500) | Long | 7,290 | 7,210 | 7,380 | 7,470 | 1.1 / 2.3 | Low |
| FTSE 100 (UK100) | Short | 10,780 | 10,880 | 10,620 | 10,520 | 1.6 / 2.6 | Medium |
| DAX 40 (GER40) | Long | 25,900 | 25,600 | 26,250 | 26,600 | 1.2 / 2.3 | Low |
| Nikkei 225 (JP225) | Short | 59,800 | 61,000 | 58,200 | 57,000 | 1.3 / 2.3 | Medium |
Reward:risk is the distance from entry to each target divided by the distance from entry to the stop. Entries are limit orders at the levels shown, not market prices. Pending orders lapse at 21:00 GMT today.
Risk Scenario Analysis
The tone of the US session and the risk mood into Nvidia’s results are the swing factors for the rest of today.
If Fed speakers stay hawkish and chip stocks keep falling, equities test their channel floors and broken trendlines.
A 5%-plus 10-year yield and fresh chip headlines keep Wall Street offered into the close. The Dow and Nikkei, already below support, fall first; the DAX and S&P 500 lose their channel floors only on a close under the levels below.
- Dow Jones50,600, then 50,100
- S&P 5007,290, then 7,210
- FTSE 10010,620, then 10,520
- DAX 4025,900, then 25,626
- Nikkei 22558,200, then 57,000
If yields ease and Nvidia steadies tech into the close, oversold indices bounce toward overhead resistance.
Short covering lifts the indices from stretched levels, but every chart still has averages overhead, so bounces stall at the retest levels below.
- Dow Jones51,300, then 51,900
- S&P 5007,417, then 7,584
- FTSE 10010,780, then 10,893
- DAX 4026,250, then 26,630
- Nikkei 22559,800, then 61,000
Dow Jones Industrial Average (US30) | Investing.com live quote, TradingView chart
Dow Jones Analysis: Index Drops to 50,838 Through the Floor of Its Triangle, With 51,300 the Level to Sell a Bounce
50,837.56 −770.61 (−1.49%) on Investing.com Previous close 51,608.17 | Monday −1.41% | 15:02 GMT chart showed 51,326 | US 10-year yield about 5.10% | Home Depot down about 1.8% after results
Outlook: Bias is lower on bounces with medium conviction while 51,900 caps. The Dow has dropped through the lower line of the triangle that has held since April, every average sits above the price, and Fed hike pricing and yields are against equities. RSI is not yet oversold, so the idea sells a retest of 51,300, not the current price.

Key levels
- Support 2
- 50,100
- Support 1
- 50,600
- Resistance 1
- 51,300
- Resistance 2
- 51,900
- Price (50,838) is under the 51,914, 52,199 and 52,441 averages, so the trend is down. The triangle floor near 51,300 was support at the 15:02 GMT chart capture, so a bounce to it would be a retest from below. Main catalysts: Fed speakers Waller and Williams, then Nvidia at about 21:20 GMT.
- RSI 43.24 under its 49.52 average on the chart capture: weak but not oversold, so there is room to fall. A close under 50,600 opens 50,100 and the autumn lows; a 4-hour close above 51,900 would end the bearish view.
Setup: Short at 51,300, stop 51,900, targets 50,600, 50,100 and 49,500. Reward:risk 1.2 / 2.0 / 3.0, medium conviction. Cancel if a 4-hour close above 51,900. Cancel if unfilled by 21:00 GMT today.
S&P 500 (US500) | Investing.com live quote, TradingView chart
S&P 500 Analysis: Index Falls to 7,335 at the Floor of Its Falling Channel, Where the 200-Day Zone Offers a Low-Conviction Dip Buy
7,335.00 −82.12 (−1.11%) on Investing.com Previous close 7,417.12 | Monday −1.92% to 7,416.59, a third straight loss | 15:02 GMT chart showed 7,402 | SPY 200-day average implies about 7,340 | VIX up 18.7% on Monday
Outlook: Bias is a dip buy with low conviction while 7,210 holds. The S&P 500 is sliding down a falling channel and is now at its lower line and the 200-day average zone, with RSI approaching oversold. Nvidia’s results are a binary event after the close, so the idea buys a dip to 7,290 and lapses at 21:00 GMT.

Key levels
- Support 2
- 7,210
- Support 1
- 7,290
- Resistance 1
- 7,417
- Resistance 2
- 7,584
- Price (7,335) is under the 7,584, 7,627 and 7,656 averages and down about 1.1% after three straight losing sessions. The dip buy relies on the channel floor and the 200-day area holding, and Monday’s close of 7,417 is the first resistance. Main catalysts: Fed speakers and Nvidia at about 21:20 GMT.
- RSI 39.59 under its 43.07 average on the chart capture: nearing oversold but not there yet. A close under 7,210 would break the channel and open the 7,000 area; a 4-hour close above 7,584 would flip the view.
Setup: Long at 7,290, stop 7,210, targets 7,380, 7,470 and 7,584. Reward:risk 1.1 / 2.3 / 3.7, low conviction. Cancel if a 4-hour close under 7,210. Cancel if unfilled by 21:00 GMT today.
FTSE 100 (UK100) | Investing.com live quote, TradingView chart
FTSE 100 Analysis: Index Slides to 10,698 After a False Break Above Its Falling Line, With the 10,780 Average Cluster Capping Bounces
10,698.46 −194.47 (−1.79%) on Investing.com Previous close 10,892.93 | 52-week high 10,989.50 | 15:02 GMT chart showed 10,756 | UK unemployment 4.6% against 4.7% expected | Brent about $93.4 | London cash market closed at 16:30 GMT
Outlook: Bias is lower on bounces with medium conviction while 10,880 caps. The FTSE 100 poked above its falling line earlier this month, failed, and is now back at the 10,700 average cluster after mining and bank losses. RSI is neutral, so there is no oversold cushion. The idea sells a retest of 10,780.

Key levels
- Support 2
- 10,400
- Support 1
- 10,620
- Resistance 1
- 10,780
- Resistance 2
- 10,893
- Price (10,698) is at the 10,714 and 10,695 averages and under the 10,761 average. Miners (BHP down about 3.2%), banks (Barclays down 2.3%, HSBC down 1.9%) and AstraZeneca (down 1.9%) lead the fall while Brent is up about 1%. Main catalysts: the US session tone and Nvidia at about 21:20 GMT.
- RSI 49.98 under its 53.81 average on the chart capture: neutral, so there is room to fall. A close under 10,620 opens 10,520 and the October low near 10,400; a 4-hour close above 10,880 would end the bearish view.
Setup: Short at 10,780, stop 10,880, targets 10,620, 10,520 and 10,400. Reward:risk 1.6 / 2.6 / 3.8, medium conviction. Cancel if a 4-hour close above 10,880. Cancel if unfilled by 21:00 GMT today.
DAX 40 (GER40) | Investing.com live quote, TradingView XETR chart
DAX 40 Analysis: Index Drops 2% to 26,081 and Tests the Floor of Its Rising Channel, With a Low-Conviction Dip Buy Below the 26,043 Average
26,080.70 −549.35 (−2.06%) on Investing.com Previous close 26,630.05 | 15:02 GMT chart showed 26,275 | Euro Stoxx 50 6,221 (−2.0%) | Deutsche Bank down about 5% to 6% | ASML down about 5% | German cash market closed at 16:30 GMT
Outlook: Bias is a dip buy with low conviction while 25,600 holds. The DAX has fallen from its early-November high near 27,000 to the lower line of its rising channel, hit by chip curbs and Deutsche Bank. The idea buys at 25,900, between the 26,043 and 25,685 averages, not the current price.

Key levels
- Support 2
- 25,600
- Support 1
- 25,900
- Resistance 1
- 26,250
- Resistance 2
- 26,630
- Price (26,081) is at the 26,043 average and the channel floor, and above the 25,685 and 25,626 averages, so the medium-term trend is still up while the short term is under pressure. German investor morale rose more than expected in November, which gives some support. Main catalysts: Wall Street, Fed speakers and Nvidia at about 21:20 GMT.
- RSI 54.47 under its 59.93 average at the chart capture: neutral and falling, so the dip buy waits for 25,900. A close under 25,600 would break the channel and the averages and open the 24,600 area; a 4-hour close above 26,630 would reopen the 27,000 high.
Setup: Long at 25,900, stop 25,600, targets 26,250, 26,600 and 26,950. Reward:risk 1.2 / 2.3 / 3.5, low conviction. Cancel if a 4-hour close under 25,600. Cancel if unfilled by 21:00 GMT today.
Nikkei 225 (JP225) | Investing.com Tokyo close, TradingView chart
Nikkei 225 Analysis: Index Closes at 58,860 Under a Broken Triangle Floor, With 59,800 the Level to Sell a Bounce
58,860.43 −801.59 (−1.34%) on Investing.com Previous close 59,662.02 | Open 59,295.80 | Range 58,691.11 to 59,369.14 | Tokyo closed at 06:00 GMT | Decliners 2,812 against 744 advancers | Nikkei volatility 35.10 | About 18.6% below the 22 June record close of 72,353.96
Outlook: Bias is lower on bounces with medium conviction while 61,000 caps. The index closed under the broken floor of its triangle with RSI at 36, and every average is above the price. Tokyo is shut, so the idea sells a bounce to 59,800 in US-session and Osaka night trade.

Key levels
- Support 2
- 55,500
- Support 1
- 57,000
- Resistance 1
- 59,800
- Resistance 2
- 61,820
- Price (58,860) is under the 61,820, 64,446 and 65,718 averages, so the trend is down. Kioxia, Advantest and SoftBank led the fall as chip stocks were sold again, and a new US chip export rule keeps AI hardware under pressure. Monday’s close of 59,662 is the first resistance. Main catalysts: Nvidia at about 21:20 GMT and the Tokyo open at 00:00 GMT.
- RSI 36.39 under its 39.06 average: weak and near oversold, so a squeeze is possible, but the average is still falling. A close under 57,000 opens 55,500; a close above 61,000 would put 61,820 in view and end the bearish view.
Setup: Short at 59,800, stop 61,000, targets 58,200, 57,000 and 55,500. Reward:risk 1.3 / 2.3 / 3.6, medium conviction. Cancel if a close above 61,000. Cancel if unfilled by 21:00 GMT today.
Conclusion
Chip export curbs, a hawkish Fed and Nvidia nerves are pushing every major index lower today. We prefer selling bounces in the Dow, FTSE 100 and Nikkei, where trendlines have broken, and buying dips in the S&P 500 and DAX only at their channel floors, with low conviction. The Fed speakers this evening and Nvidia at about 21:20 GMT decide whether those floors hold. Unfilled setups lapse at 21:00 GMT.
Trade the Dow, S&P 500, FTSE 100, DAX and Nikkei 225 with Capital Street FX.
Frequently Asked Questions
What is the indices outlook for today?
All five major indices are lower: the Dow near 50,838, the S&P 500 near 7,335, the FTSE 100 near 10,698, the DAX near 26,081 and the Nikkei closed at 58,860. US chip curbs, a near-certain December Fed hike and Nvidia’s results at about 21:20 GMT are the main drivers.
Which index trade ideas are live today?
Short the Dow at 51,300, the FTSE 100 at 10,780 and the Nikkei 225 at 59,800; long the S&P 500 at 7,290 and the DAX at 25,900. Each has a stop and three targets, and all lapse at 21:00 GMT if unfilled.
What time are the key events in GMT?
US retail sales came out at 13:30 GMT. The US cash session closes and setups expire at 21:00 GMT, Nvidia reports at about 21:20 GMT and the Nikkei reopens at 00:00 GMT.
Why is the DAX falling more than the S&P 500?
European chipmakers such as ASML fell about 5% on the US export rule, and Deutsche Bank dropped about 5% to 6% on leaked-document reports, so the DAX is down about 2% while the S&P 500 is down about 1.1%.
Why does Nvidia matter for all five indices?
Nvidia is the largest AI chip stock, and its first results without Jensen Huang will set the tone for tech valuations. A weak report would pressure Wall Street and the Nikkei at the open, while a steady one could trigger a relief bounce.