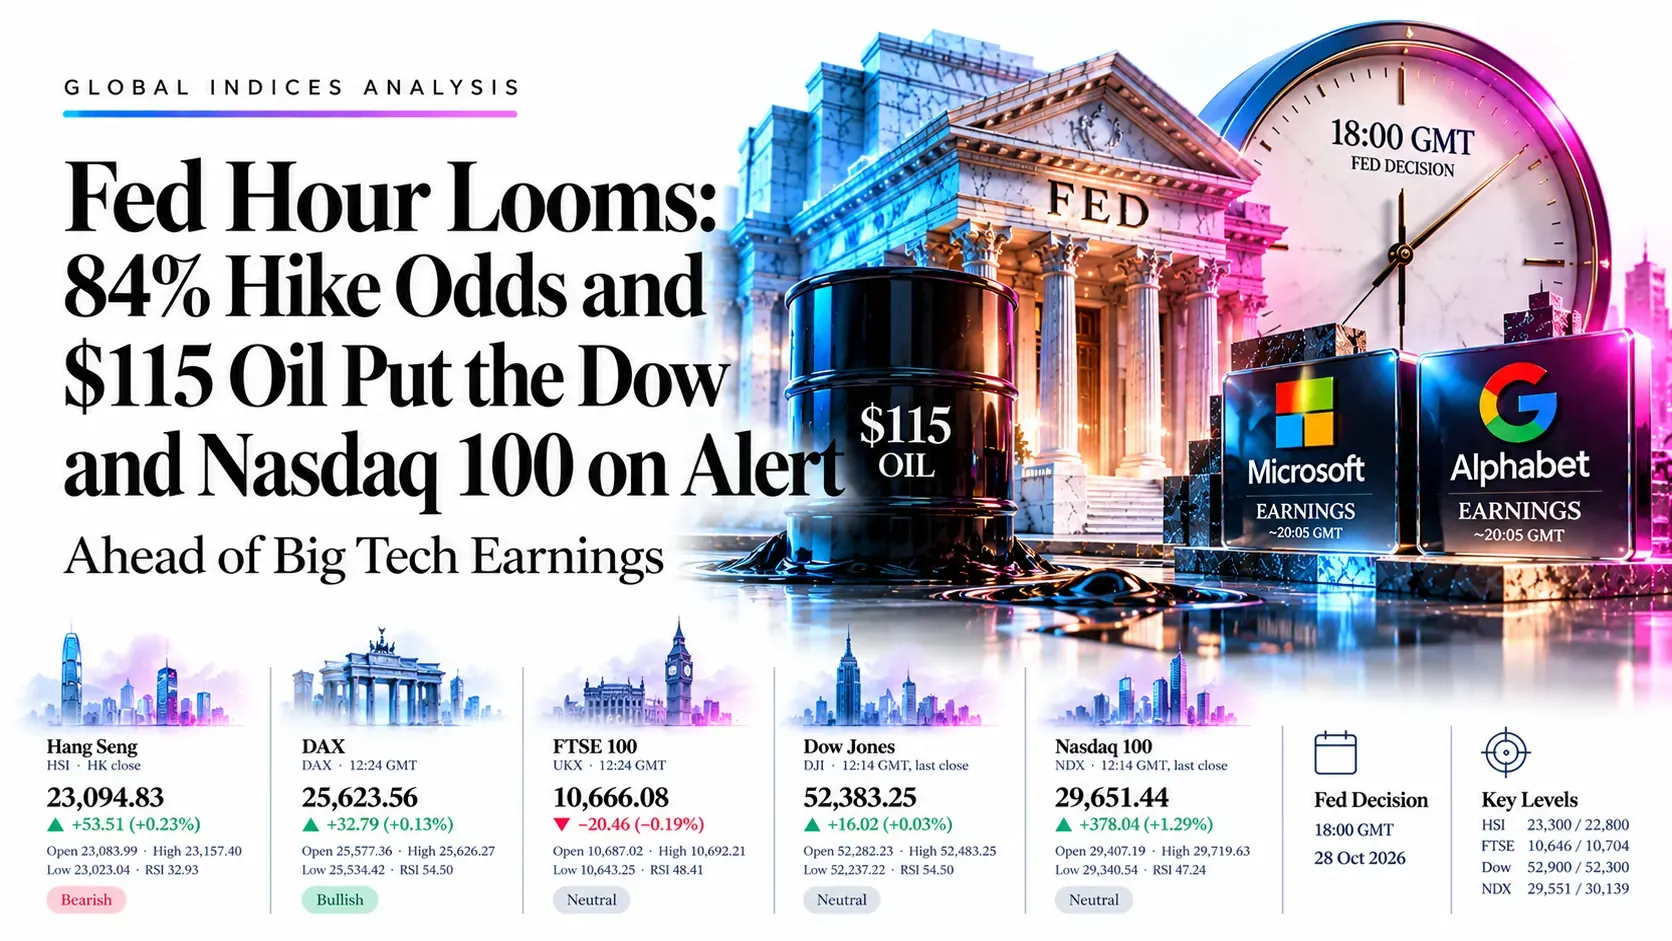
Fed Hour Looms: 84% Hike Odds and $115 Oil Put the Dow and Nasdaq 100 on Alert Ahead of Big Tech Earnings | Technical Analysis – Index Report | 28 Oct 2026
Market in Focus | Indices | Wednesday 28 October 2026
Fed Hour Looms: 84% Hike Odds and $115 Oil Put the Dow and Nasdaq 100 on Alert Ahead of Big Tech Earnings
Hang SengHSI · HK close
23,094.83
+53.51 (+0.23%)
Open 23,083.99 · High 23,157.40 · Low 23,023.04
Daily RSI 32.93
BearishDAXDAX · 12:24 GMT
25,623.56
+32.79 (+0.13%)
Open 25,577.36 · High 25,626.27 · Low 25,534.42
Daily RSI 54.50
BullishFTSE 100UKX · 12:24 GMT
10,666.08
−20.46 (−0.19%)
Open 10,687.02 · High 10,692.21 · Low 10,643.25
Daily RSI 48.41
NeutralDow JonesDJI · 12:14 GMT, last close
52,383.25
+16.02 (+0.03%)
Open 52,282.23 · High 52,483.25 · Low 52,237.22
Daily RSI 54.50
NeutralNasdaq 100NDX · 12:14 GMT, last close
29,651.44
+378.04 (+1.29%)
Open 29,407.19 · High 29,719.63 · Low 29,340.54
Daily RSI 47.24
NeutralDesk bias, today Mixed Hang Seng bearish below 23,300; Nasdaq 100 bullish above 29,551; Dow capped under 52,900
Market Overview
One decision at 18:00 GMT will set the tone for every index on the board. With December hike odds near 84% and Brent above $115, markets are heading into the Fed verdict with inflation fear fully priced in and little room for a dovish surprise. The Hang Seng closed at 23,094.83 (+0.23%) but still sits below its falling-channel floor, a weak bounce that sellers will lean on. The FTSE 100 is down 0.19% at 10,666.08 as GSK and Unilever drag and the 12:30 GMT UK Budget lands, while the DAX at 25,623.56 (+0.13%) is pressing the top of its channel. US futures are split: the Dow near 52,460 (−0.22%) is lagging, and the Nasdaq 100 near 29,950 (+0.45%) is holding firm into Microsoft and Alphabet earnings after the close. The desk plan is clear: sell Hang Seng and Dow rallies, buy FTSE 100 and Nasdaq 100 dips, and keep the DAX on watch until the Fed speaks.
Key highlights
- Bias: Short Hang Seng and Dow Jones on rallies; long FTSE 100 and Nasdaq 100 on dips; no DAX ticket.
- Levels: Hang Seng 23,300 and 22,800; FTSE 100 10,646 and 10,704; Dow 52,900 and 52,300; Nasdaq 100 29,551 and 30,139.
- Event risk: UK Budget 12:30 GMT, Fed 18:00 GMT, Warsh 18:30 GMT, Microsoft and Alphabet about 20:05 GMT.
Index Trade Tickets for Today
Hang Seng (HSI)
ShortMedium conviction- Entry zone
- 23,300–23,500Average 23,400
- Stop loss
- 23,800−400 points
- Take profit 1
- 22,800+600 points
- Take profit 2
- 22,600+800 points
- Take profit 3
- 22,150+1,250 points
- Valid until
- 00:00 GMTThu 29 Oct
Average entry 23,400. Risk 400 points (about 1.7% of entry). Reward:risk 1.5 to TP1, 2.0 to TP2, 3.1 to TP3. 1 point = 1.
Why this trade: Price closed at 23,094.83 under the floor of a falling channel with every average above it. Sell a bounce back into the broken floor at 23,300–23,500 and target the October low.
Cancel if: A 4-hour close above 23,800, near the 23,881.67 average, or a dovish surprise at 18:00 GMT. Cancel if unfilled by 18:00 GMT Wed 28 Oct.
FTSE 100 (UKX)
LongLow–medium conviction- Entry zone
- 10,600–10,650Average 10,625
- Stop loss
- 10,530−95 points
- Take profit 1
- 10,800+175 points
- Take profit 2
- 10,890+265 points
- Take profit 3
- 11,000+375 points
- Valid until
- 00:00 GMTThu 29 Oct
Average entry 10,625. Risk 95 points (about 0.9% of entry). Reward:risk 1.8 to TP1, 2.8 to TP2, 3.9 to TP3. 1 point = 1.
Why this trade: The index sits on its 10,665.24 and 10,646.08 averages inside a rising triangle. Buy a dip into the cluster; a gilt relief rally after the Budget is the upside trigger.
Cancel if: A 4-hour close under 10,530, or a Budget shock that hits gilts and sterling. Cancel if unfilled by 18:00 GMT Wed 28 Oct.
Dow Jones (DJI)
ShortLow–medium conviction- Entry zone
- 52,750–52,900Average 52,825
- Stop loss
- 53,150−325 points
- Take profit 1
- 52,300+525 points
- Take profit 2
- 51,820+1,005 points
- Take profit 3
- 51,400+1,425 points
- Valid until
- 00:00 GMTThu 29 Oct
Average entry 52,825. Risk 325 points (about 0.6% of entry). Reward:risk 1.6 to TP1, 3.1 to TP2, 4.4 to TP3. 1 point = 1.
Why this trade: Fade a rally into the top of the triangle. Futures sit near 52,460 (−0.22%), December hike odds are near 84%, and a hawkish Warsh would hit the Dow first.
Cancel if: A 4-hour close above 53,150, or a dovish hold that breaks the triangle top. Cancel if unfilled by 18:00 GMT Wed 28 Oct.
Nasdaq 100 (NDX)
LongLow–medium conviction- Entry zone
- 29,400–29,600Average 29,500
- Stop loss
- 29,000−500 points
- Take profit 1
- 30,140+640 points
- Take profit 2
- 31,000+1,500 points
- Take profit 3
- 31,400+1,900 points
- Valid until
- 00:00 GMTThu 29 Oct
Average entry 29,500. Risk 500 points (about 1.7% of entry). Reward:risk 1.3 to TP1, 3.0 to TP2, 3.8 to TP3. 1 point = 1.
Why this trade: Buy a dip into the 29,551.15 average and the rising channel floor. Futures are near 29,950 (+0.45%) ahead of Microsoft and Alphabet results after the bell.
Cancel if: A 4-hour close under 29,000, or a hawkish Fed that sinks the AI trade before the earnings. Cancel if unfilled by 18:00 GMT Wed 28 Oct.
Conditional levels, not investment advice. No ticket for the DAX today; it is covered in the ladders, charts and signal board.
Price Ladders: Every Level That Matters Today
Hang Seng
| Price | Level | What it is | Distance |
|---|---|---|---|
| 24,649.31 | Resistance 3 | Medium average | +1,554 points |
| 23,881.67 | Resistance 2 | Fast average | +787 points |
| 23,300 | Resistance 1 | Broken channel floor | +205 points |
| 23,094.83 | Price now | HK close, captured 12:24 GMT | 0 points |
| 23,300–23,500 | Entry zone | Short idea; stop 23,800 | +205 to +405 points |
| 22,800 | Support 1 | October low zone | −295 points |
| 22,600 | Support 2 | Late-June low zone | −495 points |
| 22,150 | Support 3 | Chart axis support | −945 points |
DAX
| Price | Level | What it is | Distance |
|---|---|---|---|
| 26,550 | Resistance 3 | Late-August high | +926 points |
| 26,200 | Resistance 2 | Chart axis resistance | +576 points |
| 25,650 | Resistance 1 | Falling channel top | +26 points |
| 25,623.56 | Price now | Captured 12:24 GMT | 0 points |
| 25,582.58 | Support 1 | Moving average | −41 points |
| 25,480.98 | Support 2 | Moving average | −143 points |
| 25,308.09 | Support 3 | Moving average | −316 points |
FTSE 100
| Price | Level | What it is | Distance |
|---|---|---|---|
| 11,000 | Resistance 3 | Triangle top, round number | +334 points |
| 10,890 | Resistance 2 | Mid-October high | +224 points |
| 10,704.23 | Resistance 1 | Moving average | +38 points |
| 10,666.08 | Price now | Captured 12:24 GMT | 0 points |
| 10,600–10,650 | Entry zone | Long idea; stop 10,530 | −66 to −16 points |
| 10,646.08 | Support 1 | Moving average (10,665.24 sits at price) | −20 points |
| 10,450 | Support 2 | Rising triangle floor | −216 points |
| 10,360 | Support 3 | October swing low | −306 points |
Dow Jones
| Price | Level | What it is | Distance |
|---|---|---|---|
| 54,700 | Resistance 3 | August high | +2,317 points |
| 54,000 | Resistance 2 | Chart axis resistance | +1,617 points |
| 52,900 | Resistance 1 | Triangle top | +517 points |
| 52,750–52,900 | Entry zone | Short idea; stop 53,150 | +367 to +517 points |
| 52,383.25 | Price now | Last close, captured 12:14 GMT | 0 points |
| 52,300 | Support 1 | Average band 52,276–52,331 | −83 points |
| 51,820 | Support 2 | Moving average 51,821.63 | −563 points |
| 51,400 | Support 3 | Rising triangle floor | −983 points |
Nasdaq 100
| Price | Level | What it is | Distance |
|---|---|---|---|
| 31,400 | Resistance 4 | Early-October high | +1,749 points |
| 31,000 | Resistance 3 | Round number | +1,349 points |
| 30,138.97 | Resistance 2 | Moving average | +488 points |
| 29,806.90 | Resistance 1 | Moving average | +155 points |
| 29,651.44 | Price now | Last close, captured 12:14 GMT | 0 points |
| 29,400–29,600 | Entry zone | Long idea; stop 29,000 | −251 to −51 points |
| 29,551.15 | Support 1 | Moving average | −100 points |
| 29,000 | Support 2 | Channel floor, October low | −651 points |
| 28,000 | Support 3 | Chart axis support | −1,651 points |
Technical Summary: Five Daily Charts
Hang Seng

- Trend
- Price sits just under the floor of a falling channel that began in early August.
- Averages
- Below 23,881.67, 24,649.31 and 24,670.18.
- Momentum
- RSI 32.93, under its 37.18 average and near oversold.
DAX

- Trend
- Price tests the top of a falling channel from the late-August high.
- Averages
- Above 25,582.58, 25,480.98 and 25,308.09.
- Momentum
- RSI 54.50, above its 49.80 average and the 50 line.
FTSE 100

- Trend
- Price holds inside a rising triangle between a floor near 10,450 and a top near 11,000.
- Averages
- Pinned to 10,665.24 and 10,646.08, under 10,704.23.
- Momentum
- RSI 48.41, below its 53.77 average and the 50 line.
Dow Jones

- Trend
- Price sits mid-way in a symmetrical triangle: lower highs since August, higher lows since April.
- Averages
- Above 52,331.39, 52,276.23 and 51,821.63.
- Momentum
- RSI 54.50, above its 52.93 average.
Nasdaq 100

- Trend
- Price has bounced from the lower half of a rising channel after the October slide.
- Averages
- Between 29,551.15 and 29,806.90, under 30,138.97.
- Momentum
- RSI 47.24, above its 46.10 average but below 50.
Bull vs Bear Signal Board
| Market | Trend | Averages | Momentum | Today’s catalyst |
|---|---|---|---|---|
| Hang Seng | Bearish | Bearish | Bearish | Below channel floor; oil and Fed risk Bearish |
| DAX | Neutral | Bullish | Bullish | Bank earnings beat; pre-Fed caution Neutral |
| FTSE 100 | Neutral | Neutral | Bearish | UK Budget; GSK, Unilever drag Neutral |
| Dow Jones | Neutral | Bullish | Bullish | Hawkish-hold risk; futures −0.22% Bearish |
| Nasdaq 100 | Neutral | Neutral | Neutral | Microsoft, Alphabet after the bell; futures +0.45% Bullish |
Today on the GMT Clock
- UK Budget statement
- 12:30 GMT
- Wed 28 Oct · High impact
- Chancellor Healey; gilts and sterling will steer the FTSE 100 dip-buy
- US equity market opens
- 13:30 GMT
- Wed 28 Oct · Medium impact
- First read on the Dow and Nasdaq 100 against futures
- Bank of Canada rate decision
- 13:45 GMT
- Wed 28 Oct · Medium impact
- A hike would add to global rate-hike pricing
- EIA crude oil inventories
- 14:30 GMT
- Wed 28 Oct · Medium impact
- Oil above 100 feeds the inflation worry behind the Fed
- US rate decision; hold expected
- 18:00 GMT
- Wed 28 Oct · High impact
- A hawkish tone would pressure the Dow and Nasdaq 100 entries
- Chair Warsh press conference
- 18:30 GMT
- Wed 28 Oct · High impact
- December hike signals will decide the tone into the close
- Microsoft and Alphabet results
- 20:05 GMT
- Wed 28 Oct · High impact
- Will set the Nasdaq 100 gap for the Asian open
- Daily candle closes
- 00:00 GMT
- Thu 29 Oct · Medium impact
- Closes beyond today’s key levels will set Thursday’s tone
Swipe sideways for all events.
If-Then Playbook
If Hang Seng: price bounces into 23,300–23,500
Then go short; targets 22,800, 22,600, 22,150
If Hang Seng: a 4-hour candle closes above 23,800
Then drop the short; 23,881.67 comes into play
If FTSE 100: price dips to 10,600–10,650
Then go long; targets 10,800, 10,890, 11,000
If FTSE 100: a 4-hour candle closes under 10,530
Then drop the idea; 10,450 is next
If Dow Jones: price rallies into 52,750–52,900
Then go short; targets 52,300, 51,820, 51,400
If Dow Jones: a 4-hour candle closes above 53,150
Then drop the short; 54,000 comes into play
If Nasdaq 100: price dips to 29,400–29,600
Then go long; targets 30,140, 31,000, 31,400
If Nasdaq 100: a 4-hour candle closes under 29,000
Then drop the idea; 28,000 is next
If DAX: a 4-hour candle closes above 25,650
Then no ticket today; breakout watch for 26,200
Catalyst Wire: Fundamental News Today
US rate decision at 18:00 GMT; hold expected, December hike priced near 84%
CME FedWatch puts the odds of a hold near 90.6% and a December hike near 84.3%. Rates are expected to stay at 3.75%–4.00%, so Chair Warsh’s 18:30 GMT press conference carries the signal.
Source: FXStreet, Reuters, Investing.com, 28 Oct 2026
Microsoft and Alphabet report after the US close
Consensus is about $4.72 EPS on $90.6 billion revenue for Microsoft and $3.02 on $127.7 billion for Alphabet. Alphabet rose 1.2% premarket on a report that OpenAI may buy its TPUs; Microsoft offered buyouts to up to 60,000 staff.
Source: TheStreet, Yahoo Finance, CoinCentral, 28 Oct 2026
Brent holds above $115 as US-Iran risk and the Ras Tanura claim feed inflation fears
Reuters reports talk of renewed US strikes on Iran after the 3 November midterms, while Houthis claim a missile strike on Saudi Arabia’s Ras Tanura refinery. Higher energy costs are the main reason traders price a December Fed hike.
Source: Reuters, Benzinga, 28 Oct 2026
UK Budget lands as the FTSE 100 slips on GSK and Unilever
The FTSE 100 is trading about 0.2% lower after GSK fell about 4% and Unilever about 3% despite beating forecasts. Tuesday’s 6% fall in HSBC also weighs. ING sees a relief rally in gilts if the Budget is “more boring” than feared.
Source: Investing.com, ING, 28 Oct 2026
European banks beat Q3 forecasts but the STOXX 600 hugs the flatline
Caution before the Fed and US tech earnings offsets strong bank results. The euro sits near $1.1125, close to its yearly low, and the dollar index is near 102.35.
Source: Investing.com, HSBC via Investing.com, 28 Oct 2026
Asia rallies on SK Hynix, but the Hang Seng stays under its channel floor
Kospi surged more than 7% on SK Hynix’s record results and the Nikkei gained about 1%. The Hang Seng closed up 53.51 points at 23,094.83, still below the August falling-channel base.
Source: Investrade, ABC News, AP, 28 Oct 2026
Wall Street rebounds as Nasdaq leads, but futures split before the Fed
The S&P 500 gained 0.6% and the Nasdaq Composite 1.2% on Tuesday, leaving the S&P within 1.2% of its record. Dow futures are down about 0.22% near 52,460 while Nasdaq 100 futures are up about 0.45% near 29,950.
Source: AP, FXStreet, 28 Oct 2026
Conclusion
Desk verdict: short Hang Seng 23,300–23,500; long Nasdaq 100 29,400–29,600.
The Hang Seng carries the cleanest setup, a sell on any bounce into its broken channel floor. The Dow is a fade into 52,750–52,900, while the FTSE 100 and Nasdaq 100 are dip buys with stops at 10,530 and 29,000. The DAX stays on watch at its 25,650 channel top. The main risk is the 18:00 GMT Fed decision and the Warsh press conference, where a hawkish tone could break the 29,551 Nasdaq 100 and 10,646 FTSE 100 supports.
Trade the Dow Jones, Nasdaq 100, FTSE 100, Hang Seng and other indices with Capital Street FX.
Frequently Asked Questions
What is the index outlook for today?
Mixed. The Hang Seng leans bearish under its channel floor, the DAX tests a channel top, the FTSE 100 and Dow sit on or near their averages, and the Nasdaq 100 heads into the 18:00 GMT Fed decision after Tuesday’s bounce.
Which index trade ideas are live today?
Short the Hang Seng and Dow Jones on rallies; long the FTSE 100 and Nasdaq 100 on dips. Each has a stop and three targets. The DAX has no ticket today.
Why does the Fed decision matter for indices today?
A hold is expected, but December hike odds near 84% mean a hawkish Warsh lifts yields and the dollar, which pressures the Dow and rate-sensitive Nasdaq 100.
What time is the Fed decision in GMT?
The decision lands at 18:00 GMT (2:00 pm US Eastern), followed by the Warsh press conference at 18:30 GMT.
Why is the FTSE 100 in focus today?
The UK Budget, with GSK and Unilever dragging the index, puts the 10,646–10,704 average cluster in play as gilt and sterling moves arrive.