Thesis — Buy a Confirmed Bounce From 28,650; the Five-Day Losing Streak Has Priced In Real Concern, Not Just Noise
The Nasdaq 100 at 29,045 enters the week down 4.6% from its June 3 record near 30,762, having posted five consecutive losing sessions on the back of a chip-stock rout and reports that a major AI-sector IPO may be delayed into 2027 over concerns about the sustainability of AI infrastructure capital spending given financing constraints. This is a more structurally important risk than a simple rate-driven pullback, because it strikes at the capital-expenditure assumptions underpinning the AI trade that has powered much of the index’s 2026 gains — a financing-sustainability question that is not resolved by any single week’s data. CSFX’s framework is not to fight a five-day losing streak blindly, but to recognize that streaks of this length typically attract short-covering interest, particularly if Wednesday’s ISM print or any clarifying news on chip-sector demand or IPO timing provides a positive surprise.
The entry at 28,650 reflects a level near the lower end of the index’s recent consolidation, with the stop at 28,000 placed below the level that would signal the AI-financing concern is metastasizing into a deeper structural derating. The take profit at 29,800 reflects a recovery back toward the pre-selloff range, not a return to the June 3 record — CSFX views a full retracement as unlikely until the underlying financing question is resolved with more clarity than a single week can provide. This is explicitly a tactical bounce trade, not a trend-following long; CSFX will not add on weakness below 28,000.
Nasdaq 100 (NDX) · W1 · Weekly Chart · CSFX-Research

Thesis — Fade the Dip to 4.40%; the Yield Pullback Reflects Relief on a Single Data Point, Not a Reversal in the Hike Path
The US 10-year Treasury yield at 4.37% has eased to a seven-week low after an in-line PCE inflation print modestly trimmed expectations for multiple Fed rate hikes this year — even though the core PCE rate climbed to 3.4%, its highest reading since 2023 and still well above the Fed’s 2% target. CSFX’s read is that this pullback reflects short-term relief rather than a genuine reversal in the rate path: markets are still pricing meaningful odds (62–68% according to recent surveys) of a September hike, and New York Fed President Williams reiterated this week that inflationary pressures, while expected to moderate, remain too high. Wednesday’s ISM Manufacturing print and Thursday’s jobless claims are the week’s key inputs — a strong ISM print combined with stable claims data would be the catalyst most likely to push yields back above 4.40% and toward 4.55%.
The entry at 4.40% (i.e., entering as yields rise back toward this level) reflects CSFX’s view that the current dip is a buying opportunity for yield-up exposure rather than the start of a sustained decline, with the stop at 4.32% placed below the level that would signal a genuine dovish reassessment is underway. The take profit at 4.55% reflects a return toward the higher end of the yield’s recent range if the hawkish Fed narrative under Chair Warsh reasserts itself. CSFX will reassess this bias immediately if jobless claims spike meaningfully above 240K, which would be the clearest signal that the labor market — not just inflation optics — is genuinely softening.
US 10-Year Treasury Yield · W1 · Weekly Chart · CSFX-Research

Thesis — Patient Accumulation at the $58,000 Shelf; ETF Outflows and AI-Equity Rotation Are the Drivers, Not a Bitcoin-Specific Failure
Bitcoin at $60,345.50 has broken decisively below the $60,000 psychological level to its lowest point since late 2024, driven by accelerating spot ETF outflows — the largest monthly redemption of 2026 — and a broader rotation of speculative capital toward AI-infrastructure equities that has pulled liquidity away from crypto markets even as those same equities have themselves wobbled this week. The Fear & Greed Index reading of 13 (Extreme Fear) reflects a confluence of mechanical ETF-redemption selling pressure, leveraged-position liquidations, and a long-term holder cohort that has begun trimming exposure after peaking in late May. CSFX’s framework treats this as a sentiment-driven washout rather than a fundamental failure of the asset, though the historical precedent of a slow institutional bleed (rather than a sharp capitulation candle) argues for patience over urgency in any accumulation strategy.
CSFX’s preferred entry is patient accumulation on weakness into the $58,000 level — a zone that aligns with prior consolidation support — with a stop at $54,500 below the level CSFX would treat as confirmation of a deeper structural breakdown toward the $50,000–$55,000 region some bearish scenarios have flagged. The target at $67,000 reflects a recovery back toward the level that held as support for much of the first half of 2026 before the recent breakdown. CSFX sizes Bitcoin positions conservatively in the current environment and treats any soft ISM print Wednesday — which would revive dollar-softness expectations — as the most likely macro catalyst for a near-term bounce attempt; this is a multi-week accumulation thesis, not a single-week momentum trade.
Bitcoin BTC/USD · W1 · Weekly Chart · CSFX-Research

Thesis — Weakness Into the $0.13 Shelf; Cardano Is Amplifying Bitcoin’s Breakdown With Its Usual High-Beta Leverage
Cardano at $0.146 has fallen to fresh multi-year lows this week, with the BTC–ADA price correlation — historically ranging between 0.65 and 0.85 — once again proving true to form as the altcoin amplifies Bitcoin’s pullback to $60,345.50 with its characteristic high-beta downside leverage. Whale wallets now hold an unusually high concentration of total ADA supply, and total value locked in Cardano’s DeFi ecosystem has fallen sharply from its 2026 peak, both signs consistent with a market in the later, capitulation-adjacent stages of a fear-driven washout rather than the early stages of one. CSFX views Cardano’s decline as a leveraged read-through of the broader crypto Extreme Fear cycle rather than a name-specific fundamental deterioration, though the ongoing Leios scaling-testnet rollout provides a medium-term catalyst that is currently being ignored entirely by price action.
CSFX’s framework is patient accumulation on dips toward the $0.130 shelf — a level that aligns with the broader multi-year support zone — with a stop at $0.108 below the level that would signal a deeper structural breakdown. The target at $0.190 reflects a recovery back toward the level Cardano held for much of the first quarter of 2026 before the recent breakdown accelerated. As with Bitcoin, CSFX sizes Cardano positions conservatively given the elevated volatility, and treats any macro catalyst that revives dollar-softness expectations — most plausibly a soft ISM print Wednesday — as the scenario most likely to produce the sharpest bounce off the demand shelf. CSFX will not add below $0.108.
Cardano ADA/USD · W1 · Weekly Chart · CSFX-Research

Section 6 · FAQ
US Session — Trader Questions Answered
Key questions from CSFX clients ahead of Wednesday’s ISM binary, the Nasdaq 100’s five-day losing streak, gold’s $4,000 defence, and the crypto capitulation below key psychological levels
The dollar is at a two-month high against CAD and CHF — is this sustainable, or is it a Fed-repricing overshoot that reverses?
CSFX’s view is that the dollar’s strength reflects a genuine repricing of the Fed’s hike path under new Chair Warsh, not a one-off overshoot, but the move’s sustainability into next week depends heavily on Wednesday’s ISM Manufacturing confirmation. The breadth of the rally — visible across nearly every G10 currency, not just CAD and CHF — is the key tell that this is a dollar story rather than a counterparty-specific weakness story, which historically tends to be more durable through data confirmation than narrower moves. A hold above 50 in ISM would validate the current regime and likely extend USD/CAD toward 1.4350 and USD/CHF toward 0.8200. A sub-48 miss, however, would suggest the market has gotten ahead of itself on hike-path pricing, and CSFX would expect a meaningful — though probably not complete — reversal back toward 1.4150 and 0.8050 respectively. CSFX’s tactical preference is to buy confirmed dips rather than chase the current highs, which preserves the ability to participate in continuation while managing the risk of a data-driven reversal.
Gold just broke below $4,000 for the first time in over a year — why is CSFX calling this a buying opportunity rather than a trend reversal?
Because the structural demand drivers behind gold’s multi-year rally — sustained central bank accumulation chief among them — have shown no sign of reversing, while the recent price weakness traces almost entirely to dollar strength rather than any change in those drivers. China’s central bank has now added to reserves for eighteen consecutive months, and global central bank buying in the first quarter of 2026 was up year-over-year, even as Western ETF holders recorded net outflows — a physical-versus-paper divergence that has defined this entire cycle. That divergence means paper-market price weakness driven by dollar strength is mechanically different from a demand-driven correction, and CSFX’s framework treats Friday’s bounce off the $4,000 level as the first tentative sign that this distinction is reasserting itself. The risk to this view is a strong ISM print that extends the dollar rally further and forces a retest of the recent lows; CSFX is not recommending aggressive longs at current levels into that binary, but does view the $4,000 defence as more likely to hold than break on any single data point.
The Nasdaq 100 has fallen for five straight sessions — is this the start of a deeper AI-trade unwind, or a buyable dip?
CSFX’s read is that it’s too early to know which, and that distinction matters enormously for how this should be traded. The proximate catalyst — chip-sector weakness and reports of a delayed AI-sector IPO over infrastructure-financing concerns — is a genuinely different and more structurally important risk than a routine rate-driven pullback, because it questions the capital-expenditure assumptions underpinning much of the index’s 2026 gains rather than simply repricing the discount rate applied to future earnings. That said, five-day losing streaks of this magnitude in a structurally bullish index have historically attracted short-covering interest, and the absence of a confirmed, concrete deterioration in actual AI spending data (as opposed to a single IPO-delay report) means the bearish case remains more speculative than confirmed. CSFX’s framework is a tactical bounce trade from oversold conditions near 28,650, explicitly not a trend-following long — the financing-sustainability question is not resolved by one week’s price action and could resurface with more force regardless of any near-term bounce.
Bitcoin has broken at $60,345.50 for the first time since 2024 — what’s actually driving this, and is the bottom in?
The proximate driver is mechanical rather than narrative-driven: spot Bitcoin ETFs recorded their largest monthly net outflow of 2026, and ETF redemptions force issuers to sell corresponding Bitcoin holdings regardless of price level, creating selling pressure that doesn’t respond to typical demand-side catalysts. This has been compounded by a broader rotation of speculative capital toward AI-infrastructure equities — ironic given that those same equities have wobbled this week — and a long-term holder cohort that has begun trimming exposure after a multi-month accumulation phase peaked in late May. CSFX does not have high confidence that the bottom is in; the slow, grinding nature of this decline (as opposed to a single sharp capitulation candle) is historically more consistent with an extended institutional de-risking process than a fast washout that resolves quickly. CSFX’s accumulation framework near $58,000 reflects patience rather than conviction that a bottom is imminent — sizing should stay conservative until ETF outflow data shows clear signs of stabilizing.
Why is wheat falling when Strait of Hormuz tensions briefly flared up again this week with the drone attack reported by President Trump?
Because the market’s pricing of geopolitical risk premium in agricultural commodities tends to respond more to the trajectory of de-escalation than to individual incidents within an already-improving trend. Despite Friday’s reported drone attack on shipping near the Strait, the broader narrative over the prior two weeks has been one of tanker traffic normalizing and progress in US-Iran talks, which had already compressed the war-risk freight premium embedded in wheat prices well before this latest incident. Unless this develops into a sustained pattern of attacks that meaningfully disrupts shipping flows — as opposed to an isolated event within a broader de-escalation trend — CSFX expects the market to continue trading the dominant supply-side narrative: accelerating US harvest progress and favorable Russian and Ukrainian crop conditions. Tuesday’s USDA acreage report is a more reliable near-term catalyst than any single geopolitical headline, though CSFX is watching for any escalation pattern that would force a reassessment of the entire bearish wheat thesis.
US 10-year yields have fallen to a seven-week low — doesn’t that suggest the Fed is going to cut, not hike?
No — and this is one of the more common misreadings of the current data CSFX is seeing from clients. The yield decline followed a PCE inflation report that came in broadly in line with expectations, not below them; the move reflects a modest paring back of expectations for multiple hikes this year, not a pivot toward cuts. Core PCE inflation actually climbed to 3.4%, its highest level since 2023 and still well above the Fed’s 2% target, and prediction markets continue to price meaningful odds — in the 62–68% range across recent surveys — of a September rate hike. New York Fed President Williams explicitly reiterated this week that inflationary pressures, while expected to moderate, remain too high. CSFX’s framework treats the current yield dip as a buying opportunity for yield-up exposure rather than the start of a sustained decline, with Wednesday’s ISM and Thursday’s jobless claims as the data points most likely to determine whether this relief rally in bonds extends or reverses.
Why is Cardano falling so much more than Bitcoin in percentage terms this week?
This is simply Cardano’s well-documented high-beta relationship with Bitcoin reasserting itself during a risk-off period, not a Cardano-specific fundamental failure. The historical BTC–ADA price correlation ranges between 0.65 and 0.85, and altcoins with smaller market capitalizations and thinner institutional liquidity than Bitcoin have consistently shown a pattern of falling harder during Bitcoin-led drawdowns and — historically — rising harder during Bitcoin-led rallies. The concentration of ADA supply in whale wallets (now at its highest level since 2020) and the decline in total value locked in Cardano’s DeFi ecosystem are both consistent with reduced trading liquidity, which mechanically amplifies price moves in both directions. CSFX does not view this differential decline as a signal that Cardano-specific risk has increased relative to Bitcoin; the ongoing Leios scaling-testnet development, largely ignored by current price action, remains a medium-term catalyst that could matter more once the broader crypto fear cycle resolves.
What is CSFX’s single highest-conviction trade for the week of 29 June – 3 July?
CSFX’s highest-conviction setup for this week is the gold long on a confirmed reclaim of $4,020, targeting $4,300 with a stop at $3,890. The setup has the clearest structural demand case (sustained central bank accumulation that has not wavered despite the recent price weakness), the most asymmetric risk/reward of the week’s eight setups at roughly $211 of potential gain against $130 of risk, and a thesis that is validated or invalidated by a relatively clean technical signal — a weekly close above or below the $4,000–$4,020 zone — rather than requiring a perfect read on a single data print. The USD/CAD long on ISM confirmation is the second-highest-conviction idea given the breadth and apparent durability of the current dollar rally, but the binary nature of Wednesday’s ISM print makes it tactically subordinate this week to gold’s cleaner technical setup, which CSFX believes can work even if ISM comes in roughly in line with expectations.
CSFX View · Week of 29 June 2026
CSFX View: The US Session Navigates a Two-Month-High Dollar, the Nasdaq 100’s Five-Day Losing Streak, and Gold’s $4,000 Defence Into a Holiday-Shortened Week
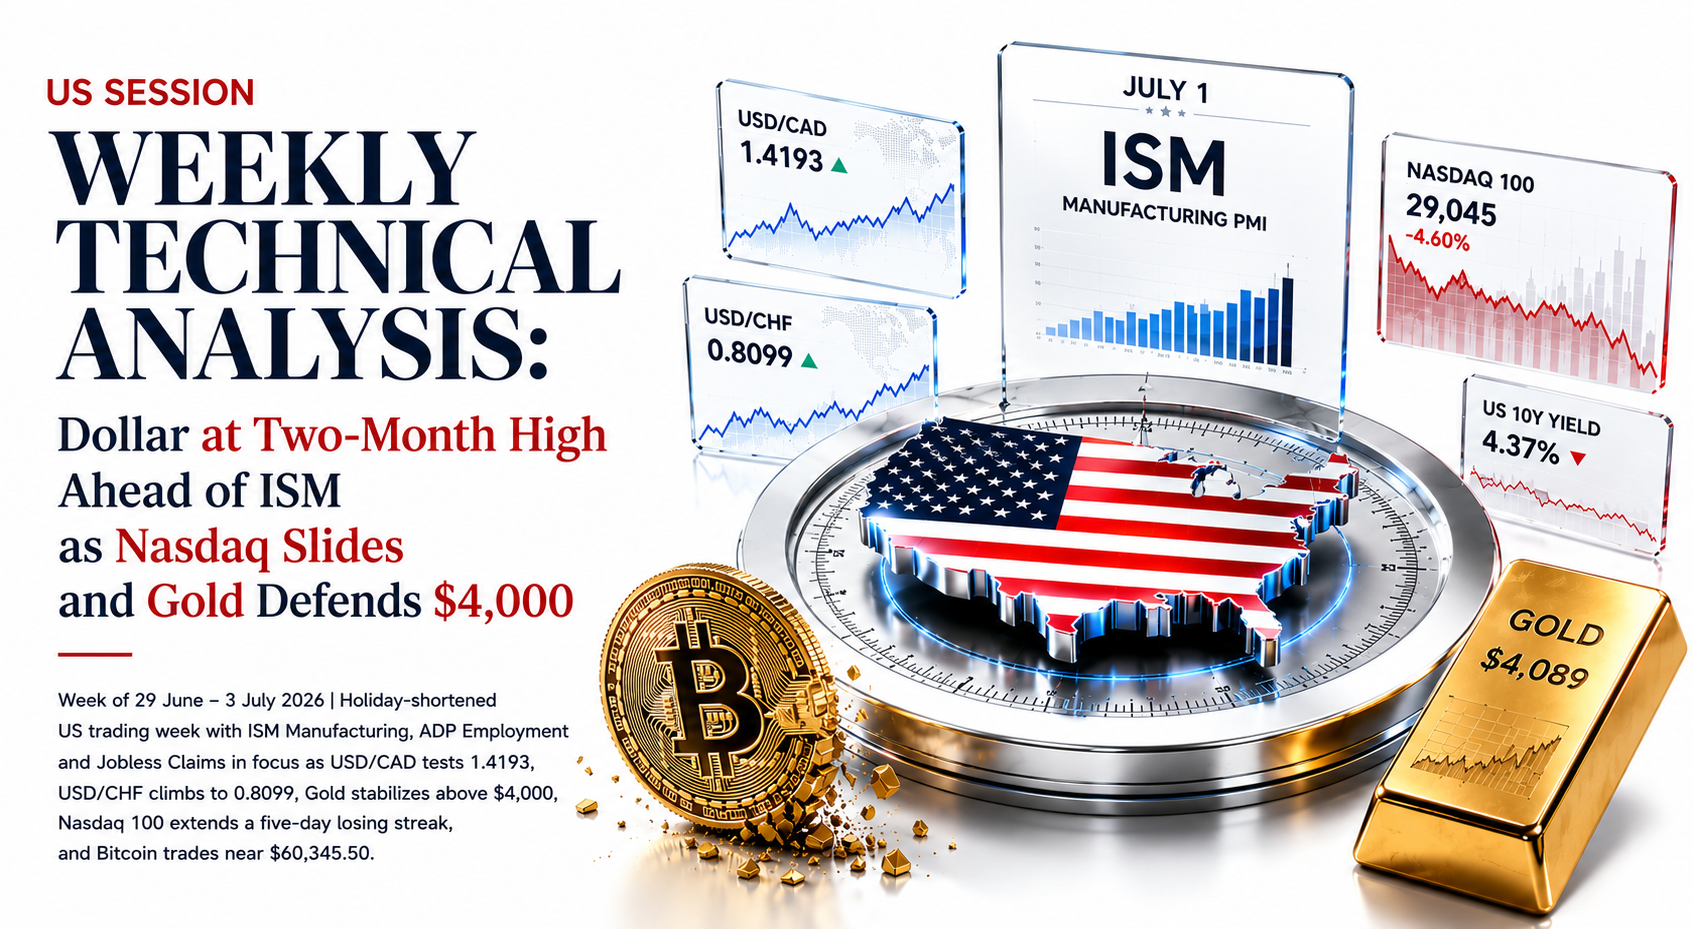
The week of 29 June – 3 July 2026 presents a US session dominated by a single question: does Wednesday’s ISM Manufacturing print confirm or reverse the dollar’s two-month-high regime before the holiday-thinned back half of the week. USD/CAD has climbed to 1.4193 and USD/CHF to 0.8099 as the Dollar Index broke above 100 for the first time since May 2025, gold has slipped to $4,089 after briefly cracking below $4,000 for the first time since November 2025, and wheat at 588.45¢ is unwinding its war-risk premium as Hormuz tensions ease and harvest progress accelerates. Against this backdrop, the Nasdaq 100 at 29,045 has suffered a five-day losing streak on AI-infrastructure financing concerns, the US 10-year yield has eased to a seven-week low of 4.37% despite still-elevated core inflation, and crypto has broken to fresh multi-year extremes — Bitcoin at $60,345.50 and Cardano at $0.146 — in a conspicuous display of Extreme Fear.
In FX, USD/CAD and USD/CHF are both sitting at multi-month highs on broad dollar strength — Wednesday’s ISM Manufacturing print is the binary event that determines whether these levels extend or correct. In commodities, gold’s defence of $4,000 is the week’s most structurally important level — a clean weekly close above $4,100 would confirm stabilization and open a path back toward $4,300, while wheat’s harvest-driven softness should continue unless Tuesday’s acreage report delivers a genuine supply surprise. The Nasdaq 100’s five-day losing streak is the week’s most asymmetric equity risk: a bounce attempt from oversold conditions is plausible on any positive AI-financing news, but the underlying capital-expenditure sustainability question is not resolved by a single week. The US 10-year yield at 4.37% is a buy-the-dip-in-yield setup, not a signal of an imminent dovish pivot. In crypto, both Bitcoin and Cardano remain in a sentiment-driven washout that CSFX treats as a patient, conservatively-sized accumulation opportunity rather than a confirmed bottom.
CSFX’s highest-conviction setups for the week are: a gold long on the $4,020 reclaim (the cleanest technical setup with the strongest structural demand case), a USD/CAD long on ISM-confirmed dips to 1.4180 (post-data confirmation buy), and patient Bitcoin accumulation at the $58,000 shelf (Extreme Fear demand zone ahead of any ISM-driven sentiment shift). USD/CHF is a buy on pullbacks to 0.8050; wheat is a fade of bounces toward $5.98 ahead of Tuesday’s acreage data; the Nasdaq 100 is a tactical bounce buy from 28,650, not a trend-following long; the US 10-year yield is a buy-the-dip toward 4.40%; and Cardano is a $0.130 accumulation play into the broader crypto Extreme Fear cycle. CSFX will issue intra-week alerts if Wednesday’s ISM delivers a material surprise in either direction, if Nasdaq 100 weakness extends beyond six consecutive sessions, if crude oil or shipping-related headlines from the Strait of Hormuz escalate meaningfully, or if Bitcoin ETF outflow data shows signs of stabilizing or accelerating further. Follow all updates at capitalstreetfx.com.
Trade US Markets at CSFX →