ECB Hike Bets Firm · Brent Eases Below $75 · Sterling Under Pressure on UK PMI Miss · DAX at 24,723.76 · ETH at $1,555.69 · ETH at $1,555.69 | Technical Analysis – European Session | 26 June 2026
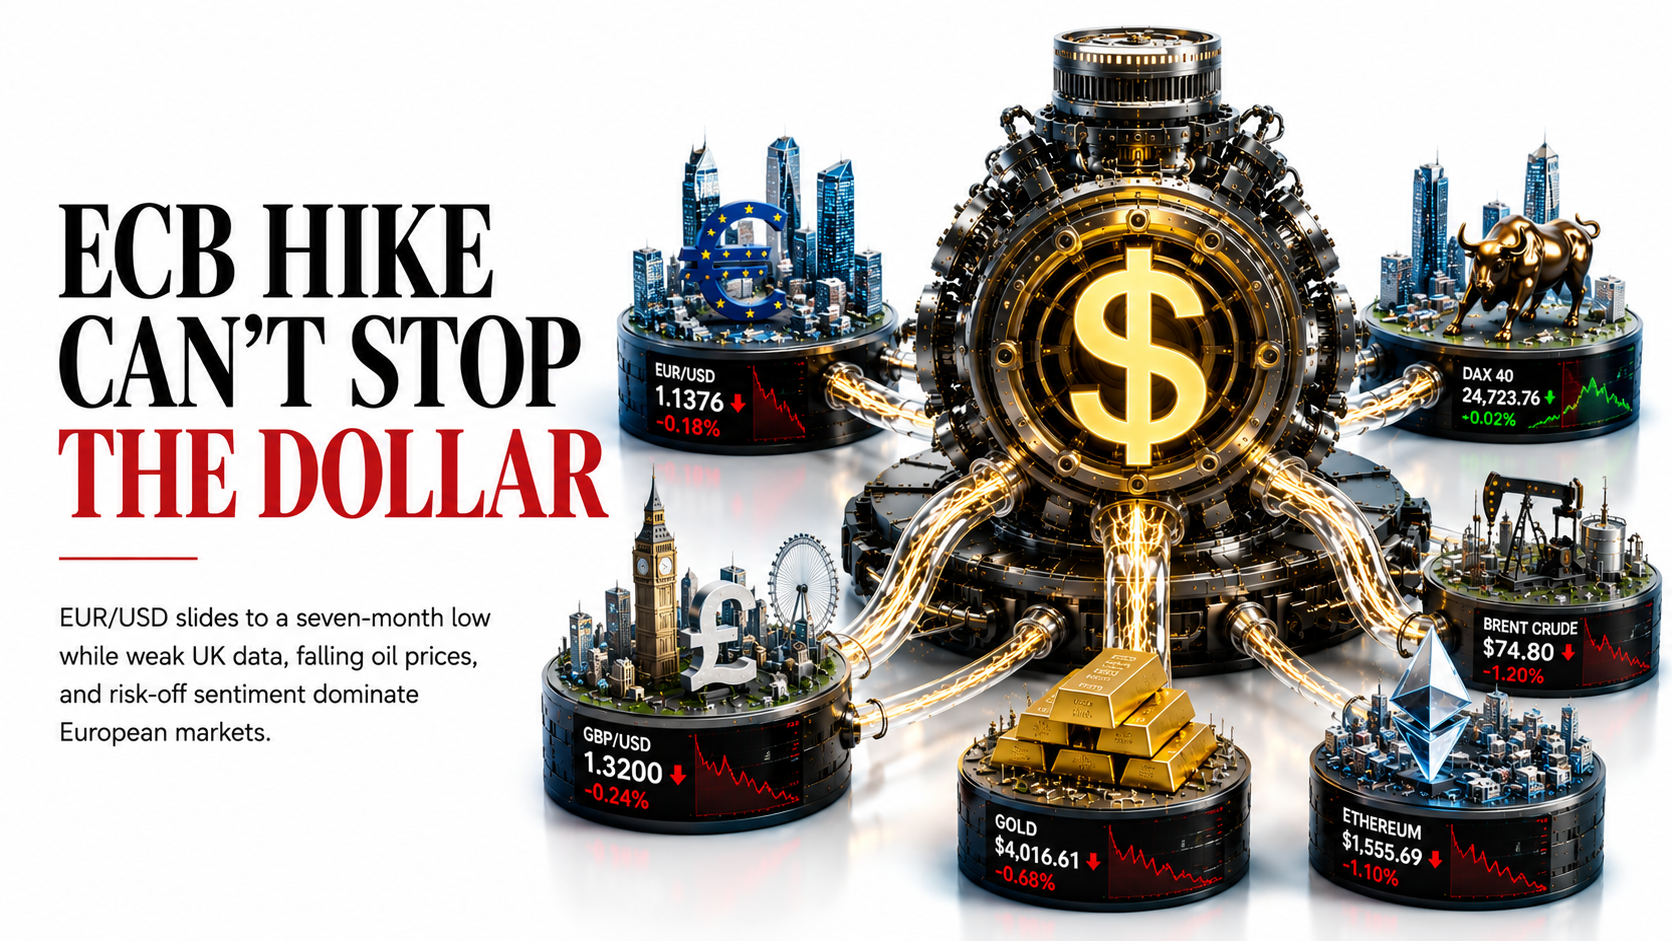
Dollar Dominance and ECB Hike Bets Squeeze EUR/USD as Sterling Buckles Under a 14-Month PMI Low —
DAX Holds Steady on Bayer’s Supreme Court Win
Friday’s European open inherits a complex macro backdrop from the Asian session’s late handover. The US dollar index remains pinned near a 13-month high after Thursday’s hot Core PCE print (3.4% YoY) locked in Fed higher-for-longer expectations, and that hawkish anchor is rippling through every instrument on this page. EUR/USD has slid to its lowest level since late 2025, testing 1.1376, caught between the ECB’s own June rate hike to 2.25% — a constructive move — and the widening acknowledgement that the dollar will not give ground while US inflation runs above 3%. Sterling faces a double squeeze: dollar strength on one side, and on the other, a June composite PMI of 49.4 — a 14-month low and a second consecutive contraction signal — that arrived alongside the political overhang of PM Starmer’s resignation and the market’s unresolved questions about Andy Burnham’s fiscal intentions.
Commodities are being pulled in two directions. Crude oil extended losses below $70 as Hormuz traffic resumes and global supply fears ease, keeping WTI on course for its third consecutive weekly decline. Silver meanwhile has shed ground with broader metals as the strong dollar and rising rate-hike expectations make the non-yielding asset less attractive. The EU 5-year yield at ~2.87% ticked higher as markets price roughly a 50% probability of a further ECB hike in September, tightening financial conditions across the eurozone. In crypto, Ethereum holds its 200-day moving average around $1,640 — a technically significant level — while Cardano has touched fresh five-year lows near $0.143, weighed down by the same macro forces hammering risk assets across the board.
The European session’s key variables into the US afternoon are Fed speakers Williams and Kashkari (any dovish shift could deflate the dollar and reverse much of this week’s moves), the University of Michigan final consumer sentiment print (especially inflation expectations), and the Hormuz shipping updates. Size positions accordingly.
Session Headlines Shaping European Markets
The key developments driving price action in London and Frankfurt right now
The ECB’s Rate Hike Isn’t Enough: Why EUR/USD is Falling Even as Frankfurt Tightens
The defining paradox of Friday’s European session is the same structural tension the Asian session wrestled with from the yen’s perspective: a central bank doing the right thing — tightening — and still watching its currency fall. The ECB raised its deposit facility rate to 2.25% on June 11, its first hike since 2023, responding to eurozone inflation at 3.2%. In a normal cycle, a central bank delivering a genuine surprise tightening would provide a meaningful lift to its currency. EUR/USD fell anyway, because the dollar has an immovable anchor.
That anchor is the Fed’s hawkish posture. Kevin Warsh’s first meeting as Chair produced a unanimous 12–0 hold but a dot plot that flipped from implied cuts to an implied hike, with the median year-end projection rising to 3.8%. Thursday’s Core PCE at 3.4% YoY — hotter than the 3.3% prior — confirmed the Fed cannot ease. With the ECB rate at 2.25% and the Fed floor at 3.50%, the 125–150 basis point gap leaves the dollar structurally bid. Markets have further tempered ECB hike expectations after Lagarde’s comments that the bank need not respond aggressively to Middle East-linked energy price effects — leaving only a coin-flip probability (~50%) for a September hike. Until that gap closes decisively, or US inflation surprises materially to the downside, EUR/USD faces a ceiling — and the current ~1.1370 level may have room to test 1.1300 or below if today’s US data (Michigan sentiment, Fed speakers) reinforce the hawkish narrative.
European Session Economic Calendar — 26 June 2026
Key releases and events shaping price action across today’s European session and into the US afternoon
| Time (BST/CET) | Event | Actual / Expected | Impact | Market Read |
|---|---|---|---|---|
| 🇬🇧08:30 BST (prior) | UK Flash Composite PMI (June) — Services 48.7 vs 50.0 expected | Composite 49.4 — 14-month low, 2nd consecutive contraction | 🔴 CRITICAL | GBP/USD hit to 7-month lows; BoE cut probability rising; fiscal uncertainty compounds |
| 🇪🇺Jun 11 (prior) | ECB Rate Decision — Deposit Facility Rate raised to 2.25% | +25bp hike — first since 2023; inflation 3.2% May | 🔴 CRITICAL | ECB constructive but ~50% for Sep hike only; EUR/USD still pressured by Fed–ECB gap |
| 🇺🇸Thu, prior close | US Core PCE Price Index (May) — THE WEEK’S KEY NUMBER | Actual 3.4% YoY (up from 3.3%) — HOT | 🔴 CRITICAL | Hardens Fed higher-for-longer; DXY 13-mo high; EUR/USD, GBP/USD, Silver, Crypto all lower |
| 🇺🇸15:00 BST tonight | University of Michigan Consumer Sentiment — Final June | Consensus: modest improvement from recent lows | 🟢 MED | Hot inflation expectations = dollar bid, EUR/USD lower, Silver lower; soft print mildly risk-supportive |
| 🇺🇸Fed Speakers Today | NY Fed’s Williams & Minneapolis Fed’s Kashkari | Tone vs recent hawkish repricing | 🟢 MED | Dovish pushback = EUR/USD bounce, Silver relief; hawkish confirmation = further dollar leg up |
| 🇪🇺Ongoing | Eurozone Composite PMI June Flash — 49.5 (Germany 48) | Below expectations; second contraction month | 🟢 MED | Weakens case for aggressive ECB; mixed for EUR; weighs on DAX growth stocks |
| 🇮🇷Ongoing | Strait of Hormuz — Shipping Traffic Resumes; Vessel Struck Off Oman | Brent below $75 as Gulf flows resume; incident revives tail risk | 🔴 HIGH | WTI/Brent under pressure from supply restoration; tail risk = oil spike if Hormuz re-closes |
| 🇬🇧This week | UK Politics — PM Starmer Resigned; Burnham Leadership Bid | Burnham seen as frontrunner; fiscal outlook unclear | 🟢 MED | GBP/USD ceiling capped; gilt yields at 4.85% reflect fiscal risk premium |
European Session Trade Ideas — 26 June 2026
Eight structured setups — EUR/USD, GBP/USD, Silver, Crude Oil, DAX 40, EU 05Y, Ethereum, Cardano — with live prices, levels, and full fundamental and technical analysis

Fundamental Backdrop
EUR/USD trades at 1.1376, a seven-month low, consolidating the damage inflicted by Thursday’s hot US Core PCE (3.4% YoY) and the subsequent dollar rally to a 13-month high. The ECB moved constructively on June 11, raising its deposit facility rate to 2.25% in its first hike since 2023, but the 125–150bp gap to the Fed’s 3.50–3.75% floor keeps the carry trade firmly in the dollar’s favour. Eurozone composite PMI contracted for the second consecutive month (49.5 vs expectations), Germany’s composite hit 48, and ECB President Lagarde’s comments suggesting the bank need not respond aggressively to energy-linked inflation have halved the market’s September hike probability to ~50%. Until US inflation softens materially or the eurozone growth picture stabilises, the structural bias remains EUR-negative.
Technical Outlook
On the daily chart, EUR/USD has broken below the 20-day Bollinger mean and trades well under the 100-day moving average, keeping the broader tone decisively bearish. Price sits just above the lower Bollinger Band support at ~1.1350–1.1351, where the RSI (14) near 28 has slipped into oversold territory — hinting at stretched conditions but not yet signalling a firm reversal. Immediate support: 1.1350 (lower Bollinger Band) — a sustained break opens 1.1300 and potentially 1.1270 (2025 lows). Resistance: 1.1411 (March 13 low), then the 20-day Bollinger middle band near 1.1530 (preferred sell-rally zone), and the 100-day MA above. The expression: sell rallies toward 1.1440, stop above 1.1550 (reclaim of Bollinger mid-band), target 1.1290.
Session Catalysts
Watch: (1) US Michigan sentiment final — hot inflation expectations widen the Fed–ECB gap further; (2) Fed speakers Williams/Kashkari — any dovish pivot provides a relief rally to fade; (3) Hormuz/energy headlines — an oil spike raises eurozone inflation forecasts and modestly supports ECB hike pricing; (4) end-of-week positioning squaring, which historically introduces noise but rarely changes the trend on a hot-PCE Friday.

Fundamental Backdrop
GBP/USD at 1.3200 is under a three-way squeeze that makes every relief rally a potential sell. The first leg is macro: the dollar is at a 13-month high after Core PCE 3.4%, and the Fed’s hawkish hold keeps the carry trade against sterling for as long as the BoE’s 3.75% rate sits nearly level with the Fed floor. The second leg is data: the June UK flash composite PMI fell to 49.4 (a 14-month low), services PMI shocked to 48.7 versus a 50.0 consensus, and two consecutive months of contraction signal a UK economy running out of steam. The third leg is political: PM Starmer’s resignation has opened a leadership race, and while Andy Burnham’s candidacy has reduced the risk of a protracted contest, markets are watching for any signals on UK fiscal trajectory under a Burnham premiership.
Technical Outlook
GBP/USD trades below the 20-day EMA at ~1.3351, and the symmetrical triangle breakdown that FXStreet flagged earlier this week is extending the downside leg. The RSI at 36 hovers above oversold but reflects persistent downside momentum rather than an imminent reversal. Key support: the November 2025 low at 1.3096 (a major psychological level and the likely near-term target), then 1.3000 if sentiment deteriorates. Key resistance: 1.3237 (post-Starmer stabilisation), 1.3350 (20-day EMA, preferred sell-rally entry), and 1.3420–1.3500 (0.382 Fib of March–May cycle). The expression: sell rallies toward 1.3280, stop above 1.3420, target 1.3096.
Session Catalysts
Watch: (1) Any Andy Burnham fiscal policy statement — clarity on gilts reduces political risk premium; (2) US Michigan sentiment / Fed speakers — the same dollar-direction levers that govern EUR/USD; (3) oil prices — the UK is an oil importer, so further WTI weakness marginally reduces UK inflation and tempers the BoE’s hawkish hold; (4) gilt market — 10-year yield at 4.85% is a live constraint; a gilt sell-off would mechanically pressure GBP further.

Fundamental Backdrop
Silver consolidates near $57.79, having pulled back meaningfully from the extraordinary highs seen during the peak of Hormuz disruption fears earlier this year (the 52-week high is $121.79). The macro headwinds are clear: a 13-month-high dollar makes silver more expensive for non-dollar buyers, and markets pricing ~68% probability of a September Fed rate hike reduce the attractiveness of non-yielding metals. On the industrial side, silver demand faces a mixed picture: eurozone and German PMIs are contracting, reducing European manufacturing demand, while the Hormuz re-opening eases raw-material supply fears that had supported prices. The constructive long-term case — solar panel demand, EV components, green infrastructure — remains intact but is not an intraday catalyst.
Technical Outlook
Silver futures (SI) remain below the Daily VC PMI mean of $67.14, keeping the short-term trend neutral to bearish. The primary 2026 support floor sits at ~$61 (78.6% Fibonacci extension of the March–May–June 2026 cycle), with the next meaningful level at $56 (the 61.8% Fib / 2026 low area, also cited as the strongest pivot). Resistance: the $62–$65 zone (0.272 Fib extension), then $68–$72 (0.382 Fib zone, preferred sell-rally entry). A sustained breakout above $68–$72 would strengthen bullish momentum; conversely, a hold below $65.80 followed by a break under $63 exposes $56. Silver futures’ next settlement is July 29, 2026. The expression: sell rallies into $61, stop $67, target $55, recognising Hormuz tail risk as the primary upside threat.
Session Catalysts
Watch: (1) Dollar direction — the Fed speaker pair (Williams/Kashkari) and Michigan sentiment are the intraday levers; (2) Hormuz updates — a fresh disruption incident would spike silver on industrial supply anxiety; (3) Chinese manufacturing data — any sign of demand rebound in China (the largest silver consumer) would provide a bullish catalyst; (4) gold’s behaviour — silver typically amplifies gold moves both up and down at higher volatility.

Fundamental Backdrop
WTI crude holds near $70.27, within a whisker of erasing all war-premium gains from the US–Iran conflict onset, as the supply restoration narrative gathers pace. Saudi Arabian tankers are resuming transit toward Ras Tanura for the first Persian Gulf exports since March. Qatar has issued its first post-war crude tender. The IMO secured safety guarantees enabling more than 11,000 stranded seafarers to begin exiting through Hormuz, and overall tanker transit is running at its fastest wartime pace. A vessel struck by an unidentified projectile off Oman on June 25 revived temporary risk premium, briefly lifting Brent to ~$74.70, but the move faded as traffic continued. Structural headwinds: Iraq threatening to leave OPEC unless quotas increase signals potential supply growth; Brent’s prompt spread has shifted to backwardation-to-contango — a bearish structural signal; and Cushing stocks at ~19 million barrels remain the primary floor under WTI.
Technical Outlook
WTI’s close below $70 on Wednesday was the first such reading since March 2, confirming the supply-relief bear trend. Brent on track for a third consecutive weekly loss. Key support: $68.00 (psychological level / potential target area), $65.00 (Goldman Sachs revised Q4 Brent forecast ~$80, WTI typically at a $5–$8 discount). Key resistance: $73–$75 (previous trading range support, now resistance), $79 (structural stop above which a fresh Hormuz escalation or nuclear talks breakdown could drive a spike). The expression: sell rallies toward the $73–$75 zone, stop above $79, target $65 — but this is a genuinely two-sided trade given the tail risk if peace talks collapse.
Session Catalysts
Watch: (1) Hormuz shipping updates — any fresh incident or Iranian signalling is the binary upside risk; (2) US–Iran nuclear deal progress — a confirmed permanent agreement would accelerate the downside leg; (3) EIA/API inventory data — Cushing stocks are the downside floor; (4) OPEC’s response to Iraq’s quota demand — a fracture could unleash significant additional supply; (5) dollar — a stronger dollar mechanically caps oil for non-USD buyers.

Fundamental Backdrop
The DAX has pulled back to 24,723.76, having recovered from after two tough sessions of tech-led losses, with Thursday’s 1.03% gain closing at ~24,995 and Friday morning holding near 24,890. The catalyst was Bayer’s extraordinary 19% surge after a US Supreme Court ruling in favour of the company in its Roundup weedkiller lawsuits — eliminating a multi-billion-euro litigation overhang. Vonovia gained 3% on a Deutsche Bank buy recommendation, and Volkswagen rose 1.7% after confirming the €7.4 billion sale of its engine unit Everllence to Bain Capital. The DAX faces structural headwinds from Germany’s composite PMI contracting at 48, weak domestic demand, the ECB’s tightening cycle, and the broader global tech rotation. However, the Bayer ruling demonstrates the DAX’s sectoral diversity — pharma, utilities, and industrial stocks provide cushion when tech softens.
Technical Outlook
The DAX’s weekly buy/sell signal on investing.com reads “Strong Buy” while the daily is “Buy” — consistent with a market that remains in an uptrend despite this week’s pullback from near the 52-week high of 25,508. The index has recovered the key 24,400–24,500 support zone (prior resistance-turned-support from Q1 2026) following the global tech rout. Resistance: 25,000 (psychological), 25,200 (weekly close resistance), 25,508 (52-week high). Support: 24,400 (structural entry level), 24,200 (200-day MA area), 23,800 (stop — decisive breakdown below this level negates the bull case). The expression: buy dips toward 24,200, stop below 23,600, target 25,200 — but reduce conviction if Friday’s US data reinforces the risk-off narrative.
Session Catalysts
Watch: (1) Bayer follow-through and litigation news — the Supreme Court ruling is a multi-day positive catalyst; (2) VW Everllence sale confirmation details — positive for balance sheet restructuring narrative; (3) US Michigan sentiment and Fed speakers — a hawkish surprise would revive risk-off and could drag the DAX below 24,600; (4) eurozone growth data — further PMI weakness would raise ECB recession risk concerns; (5) oil prices — lower crude marginally supportive for energy-intensive German manufacturing margins.

Fundamental Backdrop
The EU 5-year government bond yield trades near 2.87%, having risen from sub-2% levels at the start of the year as the ECB pivoted to tightening. The June 11 rate hike to 2.25% (the ECB’s deposit facility rate — first hike since 2023) was the catalyst, with markets now pricing roughly a 50% probability of a further 25bp move in September. Eurozone inflation rose to 3.2% in May, energised by Middle East conflict-related energy costs. However, growth headwinds are intensifying: the eurozone composite PMI contracted at 49.5 in June, GDP growth for 2026 is projected at only ~0.8% by ECB staff, and Lagarde has explicitly said the bank does not need to respond more aggressively to the current inflation dynamics. The tension between inflation risk (upside yield) and growth risk (downside yield) keeps the 5Y at a tactical inflection point.
Technical Outlook
The EU 5-year yield (German 5Y proxy) has been consolidating near 2.87% since the June ECB hike, after the ECB’s hawkish communication embedded a risk premium in the 2–5 year part of the eurozone curve. The 10-year eurozone yield is at 3.29% (per Trading Economics, June 23 data). Sovereign spreads have remained broadly contained, with no material peripheral blowout. The directional trade is that if September hike odds increase from 50% toward 75%, the 5Y yield could extend toward 3.00–3.10%. Conversely, a dovish surprise from the ECB or a collapse in growth data could pull yields back toward 2.50–2.60%. The expression: buy yield dips (sell bond price rallies) near 2.70%, stop on a yield close below 2.50%, target 3.10%.
Session Catalysts
Watch: (1) Any ECB speaker commentary on September policy path; (2) eurozone CPI or growth revisions — surprise upside hardens hike bets; (3) US data — a hot Michigan sentiment or hawkish Fed speakers widens the Atlantic yield gap, modestly supportive of EU yields via global reflation narrative; (4) Hormuz — persistent disruption keeps energy prices elevated and ECB tightening more live; (5) peripheral spreads — Italian BTP vs German Bund remains the stress indicator for the eurozone curve.

Fundamental Backdrop
Ethereum trades at $1,555.69, having declined over 65% from its August 2025 all-time high of $4,946. The macro headwinds are overwhelming the strong structural story: a 13-month-high dollar, a hawkish Fed after Core PCE 3.4%, and sustained outflows from spot Ethereum ETFs as institutional investors reduce high-beta risk exposure. The Fear and Greed index sits at 17 — Extreme Fear. On fundamentals, Ethereum’s network remains the dominant smart contract platform: Pectra (May 2025) and Fusaka (December 2025) upgrades have lowered gas fees, the forthcoming Glamsterdam upgrade (expected mid-2026) promises in-protocol MEV resistance and ePBS. Staking locks up a meaningful portion of supply. However, L1 fee revenue has declined as activity migrated to L2 rollups, creating a valuation debate about ETH’s fee capture.
Technical Outlook
The 200-day moving average at ~$1,668 is the critical bull/bear line; ETH is currently now clearly below it, with the 200-day acting as overhead resistance. The 50-day MA is falling above price, acting as resistance near ~$1,820. The RSI at approximately 28–32 is approaching oversold, suggesting buying pressure may emerge, but the absence of a macro catalyst limits the upside conviction. A confirmed daily close back above the 200-day MA ($1,668) would suggest the selling pressure is abating and open a path toward $1,800–$1,900. Conversely, a break below the recent lows of $1,520–$1,550 would accelerate the decline. The expression: sell rallies toward $1,640–$1,668, stop above $1,780 (reclaim of 200-day MA in a sustained manner), target $1,420 — sizing to allow for an oversold bounce at any point.
Session Catalysts
Watch: (1) Bitcoin price direction — ETH amplifies BTC moves; BTC at ~$59,900 is at a key level; (2) macro risk appetite — Fed speakers and Michigan sentiment; (3) ETF flow data — any reversal in Ethereum ETF outflows would provide fundamental support at the 200-day MA; (4) Glamsterdam upgrade timeline news — a confirmed roadmap acceleration would be a bullish catalyst; (5) gas fee metrics on-chain — a spike in L1 activity would revive the fee-capture narrative.

Fundamental Backdrop
Cardano trades near $0.1440, a five-year low and a 95% decline from its September 2021 all-time high of $3.10. The macro headwinds are the primary driver: dollar strength, Fed higher-for-longer, and the same crypto leverage-flush dynamics that sent $1.5 billion in market-wide liquidations through the system earlier this week. ADA’s own fundamental story has not deteriorated — in fact, the Leios Musashi Dojo testnet went live on June 23, targeting a 30–65x throughput improvement with a November 2026 mainnet goal — but the market is in no mood to reward development activity. The SecondFi wallet exploit on June 24 (374 wallets drained before 129 million ADA was secured) dealt a confidence blow and reinforced the bearish sentiment. ADA trades below both the 50-day and 200-day MAs, both of which are declining.
Technical Outlook
The bearish structure is unambiguous: 30 of 34 technical indicators on a composite basis are signalling sell, per CoinCodex (June 25). The RSI at ~26 is deeply oversold — this is the only near-term bullish signal, flagging that a snap-back bounce is possible at any moment. Pivot support levels: $0.1407 (S1), $0.1336 (S2), $0.1268 (strongest pivot). Resistance: $0.1546 (R1), $0.1614 (R2), $0.1685 (R3). The $0.18–$0.20 zone is the key battleground for any recovery — a reclaim would open $0.22–$0.25. The expression: sell rallies toward $0.152–$0.160, stop above $0.183 (reclaim of R3 plus a cushion), target $0.1268. An oversold-driven snap-back is the primary risk to the short: size accordingly.
Session Catalysts
Watch: (1) Bitcoin direction — ADA amplifies BTC more than most large-caps; (2) broader crypto liquidation risk — if the leverage flush continues, ADA is among the highest-beta names; (3) Leios testnet metrics — if throughput data surprises to the upside, community sentiment can shift fast; (4) SecondFi exploit follow-up — any recovered funds or security update could reduce the confidence discount; (5) US macro (Williams/Kashkari, Michigan) — dollar direction is the upstream variable for all crypto in this session.
Key Questions for the European Session
Detailed answers to Friday’s most important analytical questions for European traders
European Session Summary — Friday, 26 June 2026
Friday’s European session is defined by dollar dominance, rate divergence, and an energy market completing its third weekly decline. The US dollar at a 13-month high — anchored by Core PCE 3.4% and the Fed’s hawkish hold under Warsh — is the upstream variable for every instrument in this report. EUR/USD at 1.1376 and GBP/USD at 1.3200 are both near multi-month lows, squeezed between a dollar that refuses to yield and their own domestic headwinds: eurozone contraction PMIs and Germany’s 48 composite for EUR; a UK services PMI shock at 48.7, Starmer’s resignation, and fiscal uncertainty for GBP. The ECB’s genuine hike to 2.25% is not enough while the Fed–ECB gap sits at 125–150bp.
The actionable framework is clear. Highest-conviction macro: EUR/USD sell rallies toward 1.1440, stop 1.1550, target 1.1290 — the Fed–ECB rate gap and dollar at 13-month highs is the session’s cleanest structural setup, with the ECB’s growth constraint capping any hike acceleration.
For the individual instruments: GBP/USD sell rallies toward 1.3280, stop 1.3420, target 1.3096 — PMI shock plus political uncertainty plus dollar is a triple squeeze with no near-term resolution. Silver sell rallies toward $62, stop $67, target $55 — dollar headwind and PMI weakness weigh; Hormuz tail-risk is the upside threat. WTI Crude sell rallies toward $73, stop $79, target $65 (price at $70.27; holding $70 support is key) — Hormuz reopening overrides the vessel incident; third weekly loss confirms supply restoration narrative. DAX 40 buy dips toward 24,200, stop 23,800, target 25,500 — Bayer +19% anchors Friday’s session; sectoral diversity is the DAX’s shield against tech-rout contagion. EU 5Y yield buy yield dips (sell bond price) near 2.70%, stop yield below 2.50%, target 3.10% — ECB hike cycle ongoing, September 50% priced. Ethereum sell rallies toward $1,640–$1,668, stop $1,900, target $1,420 — below 200-day MA in Extreme Fear; confirmed reclaim of $1,668 would neutralise the short. Cardano sell rallies toward $0.152, stop $0.183, target $0.127 — five-year lows, RSI 26 risks further liquidation flush before macro catalyst arrives. The decisive variable into the US afternoon remains the dollar and the Fed: Michigan sentiment and the Williams/Kashkari remarks are the nearest catalysts that could shift the trajectory. Size positions for the dollar direction — everything else flows from there. None of the above constitutes investment advice.
Access Live European Markets →