EUR/USD ~1.4083 Stalls Below Key Resistance as Germany Composite PMI Slumps to 48.0 — Starmer Resigns, Andy Burnham to Lead UK, DAX ~24,828, Silver ~$62.40/oz, Corn ~$4.13/bu | Technical Analysis – European Session | 23 June 2026
EUR/USD Pinned Below 1.4100 as Germany PMI
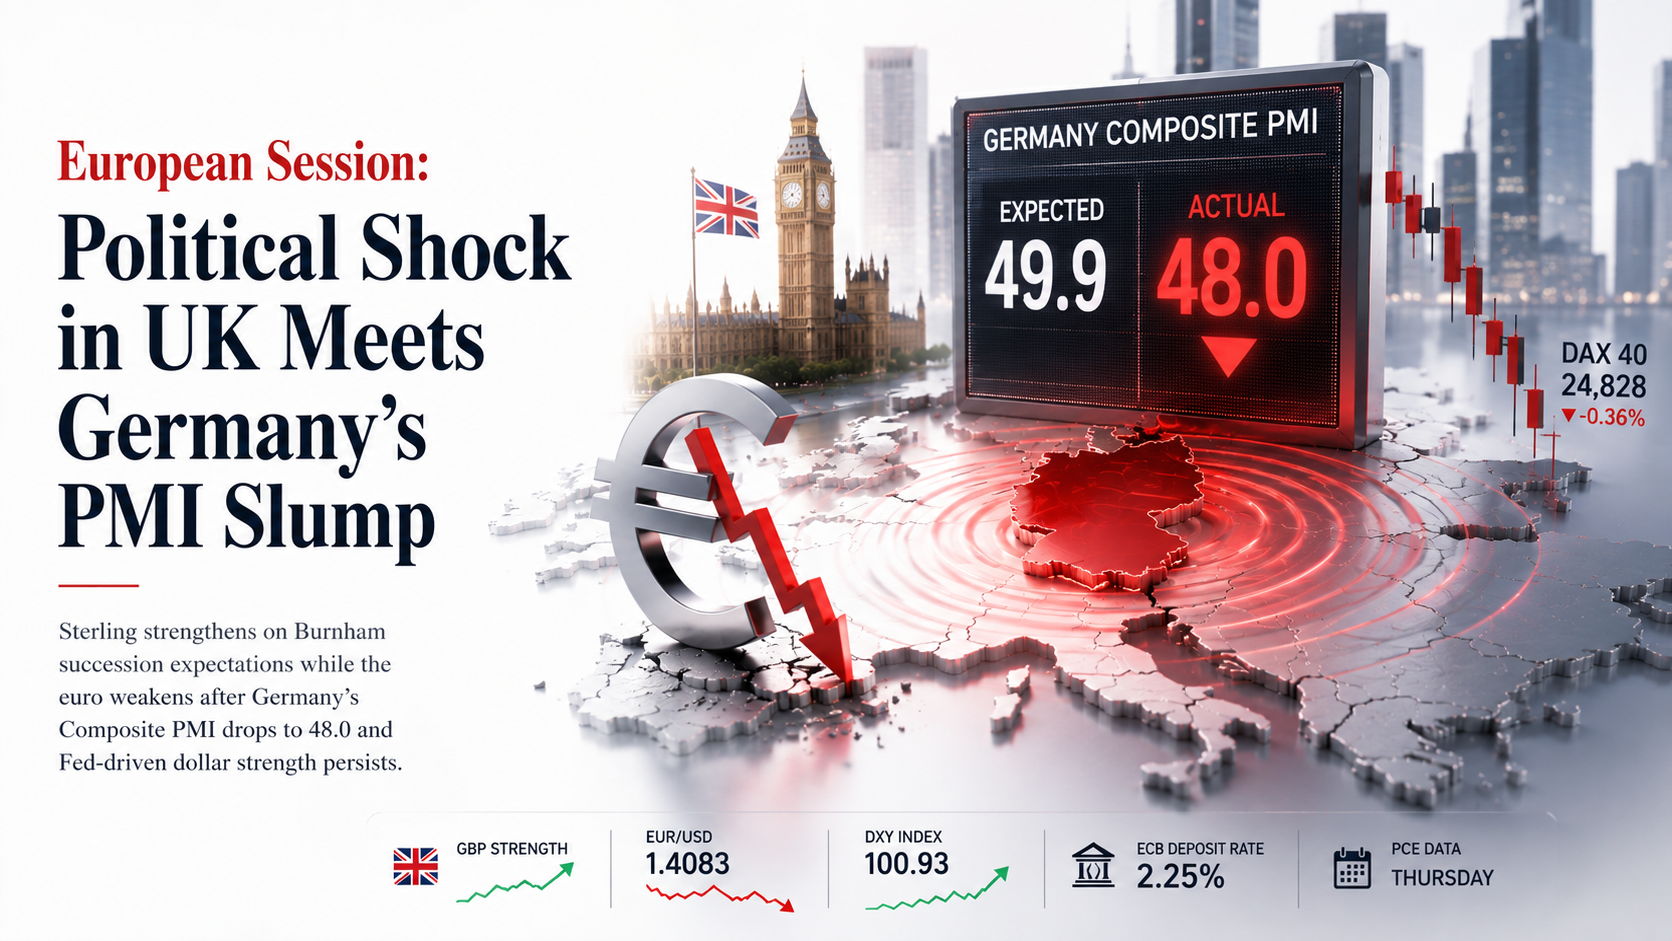
Slumps to 48.0 — Starmer Resigns, Burnham Set for No. 10
Tuesday’s European session opens on a collision of two major event risks landing simultaneously: UK Prime Minister Keir Starmer formally confirmed his resignation on Monday — becoming the seventh British leader in a decade — while Germany’s June flash Composite PMI landed at a deeply disappointing 48.0 against a 49.9 consensus, with the services component collapsing to 46.8. Together, these two catalysts define the session’s macro architecture: sterling is bid on relief that an orderly Burnham succession is now likely, while the euro is losing altitude as the PMI data reinforces the eurozone’s stagflationary trap — the ECB has just hiked to 2.25% into a private sector that is contracting for the third consecutive month.
The geopolitical backdrop inherited from the Asian session remains the foundational macro variable. US-Iran technical talks are continuing in Switzerland, with lower-level negotiators working on the framework agreed at the weekend. Brent crude is holding around ~$77.01, sustaining the tailwind to Eurozone inflation relief that the market first priced when the roadmap to a peace deal was announced. However, the Fed’s hawkish hold on June 17 — with nine of nineteen policymakers now projecting at least one further hike — has acted as a structural dollar prop that prevents EUR/USD from staging any meaningful recovery above 1.1450. The DXY near 13-month highs around 100.93 is the dominant constraint on European risk assets.
In equities, the DAX has so far proven more resilient than the currency, trading at ~24,828 and supported by Germany’s defence spending boom and a recovery in automotive stocks. NatWest Group on the LSE is absorbing the Burnham political transition relatively well, having surged more than 60% over the past 52 weeks on a sector re-rating. In crypto, Ethereum (~$1,648.50) and BNB (~$572.16) are both under pressure from the risk-off macro environment, though the launch of Ethlabs — the institutional Ethereum push backed by Tom Lee, Joe Lubin, and major ETH treasury holders — represents the medium-term catalyst worth monitoring, particularly as ETH slides into deeper correction territory. The EU 30-year Bund yield at ~3.489% is the bond market’s verdict on the ECB’s stagflationary dilemma: rates are rising to fight inflation in an economy that is already contracting.
European Session Market Dashboard
Key prices and moves as of the opening European session, 23 June 2026
European Session News Drivers — 23 June 2026
The six catalysts shaping European session price action right now
European Session Economic Calendar — 23 June 2026
Key data releases and events shaping price action across Frankfurt, London and Paris through the week
| Time (IST) | Event | Actual / Expected | Impact | Market Read |
|---|---|---|---|---|
| 🇩🇪Today AM | Germany June Flash Composite PMI | Actual: 48.0 | Expected: 49.9 | Prev: 48.8 | 🔴 CRITICAL | EUR/USD below 1.1450; services at 46.8 (worst since 2023) — stagflation pressure on ECB |
| 🇩🇪Today AM | Germany June Flash Manufacturing PMI | Actual: 50.0 | Expected: 50.0 | Prev: 50.1 | 🟢 MED | Flatlines on threshold; no direction signal; defence sector and auto revival offsetting energy drag |
| 🇪🇺Today AM | Eurozone June Flash Composite PMI | Actual: 49.5 | Expected: ~49.9 | 🔴 HIGH | Slight recovery from Germany’s deeper miss; confirms 3rd consecutive month of EA contraction |
| 🇬🇧Today AM | UK Political Transition — Starmer Resignation Confirmed | Burnham frontrunner; Streeting endorses him | 🔴 CRITICAL | GBP +0.26%; EUR/GBP -0.34% to 0.8630; gilt 10Y yields -4bp to 4.80%; orderly transition priced |
| 🇬🇧Today later | UK June Flash Composite PMI | Consensus: ~52.5 (services resilient) | 🔴 HIGH | Strong beat would extend GBP gains vs EUR; miss would partly reverse Starmer-relief rally |
| 🇺🇸Today — NY open | US S&P Global Flash PMIs — June Preliminary | Consensus: Manufacturing ~51.5, Services ~53 | 🔴 HIGH | Strong print extends DXY gains, pushes EUR/USD below 1.1400; weak print could spark EUR relief |
| 🇩🇪All week | ECB Speakers — Lane, Wunsch, Schnabel | PMI misses raise forward guidance urgency | 🟢 MED | Dovish surprise could crush EU 30Y yield and support EUR/USD; hawkish repeat keeps both pressured |
| 🇺🇸Thu IST eve | US PCE Price Index (Core) — May | Key Fed inflation gauge; ~40bp more tightening priced | 🔴 CRITICAL | Hot read → EUR/USD tests 1.3950, EU 30Y yields higher, crypto lower; cool read → EUR/USD 1.4250 target |
European Session Trade Ideas — 23 June 2026
Nine structured setups — EUR/USD, EUR/GBP, Silver, Corn, DAX 40, NatWest Group, Ethereum, BNB USD, EU 30Y — with live prices, levels, and full fundamental and technical analysis

Fundamental Backdrop
EUR/USD entered Tuesday’s European session in a structurally weak position, hemmed in below the 1.4100 resistance level that represents the former support breakpoint from the pre-Fed-meeting range. The dominant pressure remains the dollar side: the Fed’s hawkish June 17 hold — with nine of nineteen FOMC members now projecting an additional rate hike — has pushed money-market pricing of extra Fed tightening to roughly 40 basis points by year-end, lifting the DXY to 13-month highs around 100.93. This creates a widening policy differential headwind for EUR/USD on a forward rate basis, even though the ECB has also just hiked to 2.25%. The market’s judgment is that the Fed’s hiking cycle has further to run relative to the ECB’s, particularly now that Germany’s June composite PMI has printed at 48.0 — the third consecutive month below 50 for the Eurozone private sector. The German services component at 46.8, against a 48.7 expectation, is the worst reading since 2023 and tells a straightforward story: the ECB is hiking into a services-sector recession. Pierre Wunsch’s statement that another hike could come as soon as July looks increasingly isolated from the PMI reality. The US-Iran peace talks progress is a two-edged sword for EUR/USD: lower oil prices reduce eurozone inflation (moderately EUR-positive on a fundamentals basis) but simultaneously reduce geopolitical risk premiums, which has historically supported the dollar as a safe-haven unwind boosts risk appetite and USD simultaneously.
Technical Outlook
EUR/USD is trading well below the 200-period SMA on the 4-hour chart, with the MACD deep in negative territory and the RSI hovering around 38 — above oversold but with no meaningful bullish divergence signalling an imminent reversal. The 1.4050 round number is the immediate support; below that the pair has room to test 1.3950 (the target) and the 2026 low near 1.3850 set during peak energy-crisis anxiety in March. The 1.4100–1.4150 zone is now the key resistance band: 1.4100 is where the 4-hour SMA cluster sits, 1.4150 is the round-number sell zone and tactical entry for the short. Any subsequent upside recovery is more likely to run into a wall near 1.4230–1.4260 per FXStreet. The invalidation level is 1.4260, a daily close above which would imply the bears have lost their control of the pair — this would require either a materially soft US PCE on Thursday or a significant ECB communication shift.
Session Catalysts
Watch for: (1) Eurozone Composite PMI flash — already at 49.5, a revision lower would deepen EUR weakness; (2) UK PMI data — strong UK print widens GBP outperformance vs EUR, keeps EUR/GBP under pressure which pulls EUR/USD lower by association; (3) ECB speakers this week — any dovish pivot or acknowledgement of PMI weakness would collapse the ECB hike premium and hit EUR; (4) Thursday’s US PCE — the week’s most binary event for the pair; (5) US Flash PMI today — a strong read extends USD gains and pushes EUR/USD toward 1.4050 support. The optimal risk-reward for the EUR/USD short is to await a rally into the 1.4130–1.4160 zone and sell with a tight stop above 1.4260, targeting 1.3950.

Fundamental Backdrop
EUR/GBP is facing a rare double-pressure event in Tuesday’s session: the EUR leg is weakening due to Germany’s deeply disappointing flash PMI miss (Composite 48.0 vs 49.9 expected), while the GBP leg is strengthening on relief that UK political uncertainty is resolving in an orderly fashion. Keir Starmer’s resignation — the UK’s seventh prime minister in ten years since Brexit — had been widely anticipated after Trump’s Truth Social post on Sunday foreshadowed the move, meaning the actual announcement on Monday generated no new shock. Instead, markets priced in the elimination of the uncertainty premium that had been weighing on sterling: GBP rose to its strongest daily gain in over a month against the euro, UK gilt 10-year yields fell 4bp to 4.80%, and the pound rose against nearly all its major peers simultaneously. The key determinant of how much further EUR/GBP can fall is the choice of Chancellor under a Burnham premiership — Burnham himself has adopted a more market-friendly fiscal stance since May’s initial gilt selloff triggered by his earlier comments, and Pantheon Macroeconomics forecasts the pound will remain broadly stable through year-end. On the EUR side, the ECB’s stated willingness to hike again in July looks increasingly difficult to defend if PMI data continues to deteriorate at this pace, meaning the ECB rate support for EUR is fragile.
Technical Outlook
EUR/GBP touched a one-month high of 0.8689 early Monday before the confirmation of Burnham’s likely succession reversed sentiment, with the pair falling back to 0.8630 as the European session progresses. The key support level to watch is 0.8600, the break of which would open a path toward 0.8570 and then the 0.8500 target. On the upside, resistance sits at 0.8689 (the Monday high), then 0.8720 (the tactical sell level) and 0.8790 (stop). The pair has traded in a 0.8500–0.8720 range over the past 6 weeks, making 0.8720 a clear upper-range rejection point that coincides with the ECB’s original rate-hike premium being priced before Germany’s PMI started deteriorating. A confirmed daily close above 0.8790 would require a fundamental shift — either a genuine ECB pivot away from further hikes, or a Chancellor selection under Burnham that triggers a significant fiscal risk premium for gilts.
Session Catalysts
Watch for: (1) UK June flash PMI data today — a strong reading (services above 53) would accelerate the EUR/GBP decline by strengthening GBP further; (2) ECB speaker responses to today’s PMI misses — any hint of a dovish pivot would steepen the cross’s decline; (3) The Chancellor selection process under Burnham — the market risk is that Burnham picks a Chancellor with less fiscal discipline; (4) BoE commentary — market is pricing approximately 33bp of BoE hiking that ING argues may not materialise, which is an EUR/GBP upside risk if BoE turns more dovish; (5) Thursday’s US PCE — broadly affects both EUR and GBP but USD dynamics drive the most volatility for EUR and GBP crosses indirectly. The trade is to sell any bounce in EUR/GBP toward 0.8720 with a stop above 0.8790, targeting 0.8550 as the UK political transition delivers its full relief-rally premium over 2–4 weeks.

Fundamental Backdrop
Silver is navigating competing forces at ~$62.40/oz in Tuesday’s European session. The metal reached a nominal all-time high of $121.67 on January 29, 2026, before the Middle East war drove energy inflation higher, pushing the Fed toward a hawkish hold and creating the “higher-for-longer” rate environment that systematically reduces the appeal of non-yielding assets like silver. The Fed’s June 17 hold with ~40bp of additional tightening now priced has been silver’s most significant headwind, alongside the DXY at 13-month highs around 100.93. At the same time, the US-Iran peace deal progress is providing a countervailing fundamental signal: lower oil prices at ~$77.01 from the Hormuz normalisation directly reduce inflation expectations, which, if sustained into Thursday’s PCE data, could soften the Fed’s hiking trajectory and provide a relief rally in silver. Silver at ~$62.40 sits approximately 49% below its January all-time high, representing a significant mean-reversion opportunity if the PCE print is softer than expected. The gold-to-silver ratio at approximately 65:1 (gold ~$4,060, silver ~$62.40) is within its historical range, providing no extreme-valuation signal in either direction, though below the structural 40–60 range that silver bulls have historically pointed to as undervaluation territory.
Technical Outlook
Silver has been trading in a $60–$64 range over the past two weeks, accelerating lower from the war-era highs above $100 seen in April and May. The $61 level has provided some support and represents the buy-dip entry zone; a break below $59 would signal a deeper continuation of the downtrend from the all-time high and would invalidate the dip-buying thesis. The upside target of $67 aligns with the resistance band that capped multiple rally attempts since the Fed’s hawkish pivot in mid-June. A breakout above $67 with a confirmed daily close would open a path toward $70–$72. RSI is approximately 45, suggesting the metal is neither oversold nor overbought — a neutral positioning that could break either way on Thursday’s PCE catalyst. The daily chart shows a potential descending wedge formation that, if broken to the upside on a soft PCE print, would provide a technical confirmation for the dip-buying trade.
Session Catalysts
Watch for: (1) Thursday’s US PCE — the single most important catalyst for silver this week; a soft reading reduces Fed hiking expectations and lifts silver aggressively; (2) US Flash PMI today — a services PMI print above 54 would extend the hawkish USD environment and push silver below $65; (3) Iran-US talk progress — any confirmation of a formal peace agreement within the 60-day roadmap would sustainably lower oil and inflation expectations, a medium-term silver tailwind; (4) DXY moves — silver’s inverse dollar correlation means any reversal of the 13-month high in DXY would provide immediate silver upside; (5) Physical demand signals — India’s silver imports and solar panel manufacturing orders remain the structural demand floor that has kept silver above $60 even during the Fed-tightening period. The optimal trade is to wait for a dip toward $61 triggered by a strong US PMI today, position long with a stop below $59, and hold for the PCE catalyst.

Fundamental Backdrop
Corn is trading at ~$4.1329/bu on the CBOT, near 9-month lows set in October 2025 (~$4.10/bu), having lost approximately 10% in the past month. The decline has been driven by two interconnected forces: first, corn’s well-documented biofuel correlation with crude oil prices means that the significant decline in Brent from above $100 during peak Hormuz conflict anxiety to ~$77.01 today has mechanically dragged corn lower via reduced ethanol demand expectations. Second, the dollar’s ascent to 13-month highs at DXY 100.93 makes US corn exports more expensive for foreign buyers, which directly reduces international demand. Against those bearish forces, there are three counter-factors that argue for buying dips near support: China’s purchase of approximately 264,000MT of US corn for 2026-27 delivery as part of the broader US-China agricultural trade framework (signalling the beginning of what StoneX analyst Arlan Suderman called “China coming in to purchase at least a portion of what it committed to”); USDA’s June 30 Acreage report, which is expected to show a potential upward revision to soybean plantings that could displace some corn, creating an intra-grain rebalancing; and the fact that corn at $4.10–4.13 is already trading at historically compressed biofuel-parity valuations, meaning much of the oil-price decline is already in the price.
Technical Outlook
Corn has printed a modest +0.37% recovery today to $4.1329/bu after the prior session’s softness, suggesting some dip-buying at the 9-month low zone. The RSI is below 30 per Barchart’s note, signalling oversold territory and historically increasing the probability of a mean-reversion bounce. The $4.05 buy-dip entry zone represents a re-test of the October 2025 lows, which was a multi-month support floor before the Middle East conflict sent corn higher on biofuel demand. The invalidation stop at $3.85 sits below all major recent support levels; a break there would signal a structural breakdown implying much weaker than expected demand. The $4.50 target aligns with the former support zone from early June that became resistance after the oil-linked decline accelerated. For a more aggressive scenario, a confirmed China buying acceleration and a soft US PCE could push corn back toward $4.70–$4.80 by July.
Session Catalysts
Watch for: (1) USDA weekly export sales data — any confirmation of accelerating China buying would be immediately bullish; (2) June 30 USDA Acreage report — the most important binary catalyst for corn in the next 7 days; larger-than-expected soybean planting intentions would reduce corn area and support corn prices; (3) Midwest weather — abundant rainfall and moderate temperatures are the primary bearish weather factor; any signs of heat stress developing into late June or July would be a sharp bullish catalyst; (4) Oil price trajectory — Brent stability around $77 with further downside limited by the 60-day Iran deal timeline would reduce the biofuel-demand drag; (5) DXY — any softening in the dollar following a soft US PCE on Thursday would immediately improve the export competitiveness of US corn and trigger a short-covering rally. Corn’s RSI in oversold territory makes this a higher-probability mean-reversion trade than a directional trend setup.

Fundamental Backdrop
The DAX 40 is trading at ~24,828, having retreated from session highs on persistent PMI headwinds in Tuesday’s session despite the deeply disappointing Germany Composite PMI print of 48.0 — well below the 49.9 consensus — and the broader risk-off tone created by dollar strength and hawkish Fed positioning. The index is sustaining its gains primarily through two sector-specific tailwinds: first, Germany’s defence spending stimulus programme has been a significant and sustained demand driver for the index’s defence components, with Rheinmetall consistently outperforming; second, the automotive sector is showing early signs of recovery as Mercedes-Benz Group and BMW added approximately 2% each in recent sessions, supported by reports that the EU is preparing tariffs on Chinese plug-in hybrid vehicles. The DAX’s 52-week range of 21,863 to 25,507 shows the index has rallied substantially from its lows, and the all-time high at 25,507 represents a natural ceiling. The tension for the DAX over coming weeks is between the structural defence-and-auto tailwind and the macro headwind from a stagflatory Eurozone (ECB hiking into contraction) and a strong dollar (which pressures Eurozone export earnings when converted back to euros). Volkswagen remains a notable underperformer within the index, having dropped more than 4% recently on ex-dividend pressure.
Technical Outlook
The DAX is trading within a tightening intraday range of 24,680–24,940, with the 52-week high at 25,507 acting as the critical resistance ceiling. The fundamental backdrop argues for caution on fresh long positions at these levels given the PMI deterioration. The structure is that of a market retreating from its all-time high zone under macro pressure, which is a distribution pattern. The sell-rally strategy targets the 25,200 zone — a natural recovery resistance level — with a stop above 25,700 (which would represent a decisive momentum return requiring a fundamental re-rating) and a target at 24,100, where the prior 6-month accumulation range and key round-number support sit. A break of the 24,100 support zone on daily close would open a path toward 23,000–23,500, the next major support cluster from the pre-rally base.
Session Catalysts
Watch for: (1) Eurozone Flash PMI at 49.5 — already known but further below-consensus individual country reads will weigh; (2) ECB speakers — any dovish pivot or acknowledgement of growth concerns would initially support DAX via lower rate expectations; (3) US PMI today — a weak US reading could trigger a risk-off that cascades into European equities; (4) Automobile sector headlines — any EU tariff confirmation on Chinese EVs/PHEVs would be acutely positive for BMW, Mercedes, Stellantis within the DAX; (5) Rheinmetall and defence orders — Germany’s defence spending programme remains the most durable structural DAX tailwind, and any NATO spending commitment acceleration would add to this. The DAX is best shorted at the 25,500 ATH ceiling rather than chased long at current mid-range levels, making this a patience trade pending the right entry point.

Fundamental Backdrop
NatWest Group has delivered exceptional shareholder returns over the past twelve months — a 52-week gain of approximately 60% — driven by a sector re-rating in UK banking as higher interest rates improved net interest margins, and by NatWest’s specific execution of its digital transformation and cost rationalisation strategy. The bank’s most recent guidance revision saw it raise full-year income expectations to £16.3 billion and forecast returns exceeding 18%, with one more BoE base rate cut expected in Q1 2026 having already been absorbed into its margin outlook. The near-term uncertainty introduced by Keir Starmer’s resignation and the prospective Burnham premiership is manageable but real: in May 2026, Burnham’s initial comments about UK fiscal rules triggered a GBP and gilt selloff; since then he has adopted a more market-friendly tone, and Pantheon Macroeconomics notes that markets reacted positively to the clear succession timetable. The key risk for NatWest is that a Burnham Chancellor selection that surprises on fiscal looseness could push UK gilt yields higher, squeezing the valuation of UK financials that are already trading at stretched multiples after the 60% rally. The bank’s 3.7% dividend yield provides a cushion against moderate price weakness. NatWest’s market cap stands at approximately £68.83B with 59,100 employees.
Technical Outlook
NatWest’s 52-week range runs from approximately 291p to the February 2026 all-time closing high of ~600p (equivalent to ~$18.28 NYSE ADR). The stock has pulled back from that high amid the political transition news, currently trading around 659p (approximately $15.38 NYSE equivalent). The 490p buy-dip level aligns with a key support cluster where previous resistance became support in April 2026 and where the stock consolidated before the final leg of its rally. A confirmed daily close below 460p would signal a more significant breakdown and would require reassessing the structural bull thesis. The 585p target level represents a re-test of the 52-week highs, which would be achievable if: (a) Burnham’s Chancellor choice is market-friendly; (b) the BoE holds or hints at a more gradual cutting cycle; and (c) NatWest’s H1 2026 earnings (due later this summer) confirm the guidance upgrade trajectory. The stock’s price-to-book is estimated at a modest discount to intrinsic value (~$21.87 per Benjamin Graham’s formula at a $15.38 market price), suggesting the fundamental value case is intact even if near-term political risk weighs.
Session Catalysts
Watch for: (1) The Chancellor selection process — the most binary near-term risk for NatWest is whether Burnham’s Chancellor is a centrist or a fiscal expansionist; (2) BoE guidance — approximately 33bp of BoE hiking is priced by markets; if ING’s view that the BoE won’t hike proves correct, gilt yields would fall and bank valuations would compress marginally; (3) UK June Flash PMI today — a strong reading (services above 53) supports the “resilient UK economy” thesis that underpins NatWest’s UK consumer lending profitability; (4) NatWest-specific newsflow — the bank’s focus on disciplined growth, digital transformation and climate/sustainable finance are medium-term re-rating catalysts; (5) European banking sector tone — DAX performance and broader EU financial sector sentiment affect NatWest’s sector correlation even though it is a pure UK domestic play. The trade is to be patient for a 490p dip triggered by political transition uncertainty and buy with a 460p stop, targeting 585p on a 4–8 week horizon.

Fundamental Backdrop
Ethereum is trading at ~$1,648.50 in Tuesday’s European session, down approximately 67% from its August 2025 all-time high of $4,955 and under pressure from a macro environment that is structurally hostile to non-yielding risk assets: the Fed’s hawkish hold has pushed risk-free rates higher, reducing the relative appeal of crypto assets. The 14-day RSI at approximately 36 places ETH in neutral-to-bearish conditions per CoinCodex, with 21 of 30 technical indicators signalling bearish. The bearish technical picture is, however, increasingly at odds with a developing institutional adoption narrative. The launch of Ethlabs — backed by Ethereum co-founder Joe Lubin, FundStrat’s Tom Lee, and major ETH treasury holders BitMine and Sharplink — is explicitly designed to accelerate institutional Ethereum adoption, following the precedent of Baillie Gifford’s UK-regulated tokenised bond fund (BAGEY) settling on Ethereum with BNY Mellon custody. The key tension is between a near-term macro headwind (hawkish Fed, risk-off sentiment) and a medium-term structural demand catalyst (institutional adoption, Ethlabs, ETH staking yields). Japan’s lower house passage of legislation moving crypto under securities law is another medium-term institutional legitimisation signal that tends to drive ETH’s correlation with traditional financial assets higher over time, gradually reducing its speculative volatility premium.
Technical Outlook
ETH is now testing the $1,600–$1,650 support zone that has become the critical demand floor as the post-ATH correction deepens. The 50-day MA sits at approximately $1,673 and the 200-day MA at $1,668, meaning the current price has now broken below both — a bearish structural signal that puts dip-buyers on alert for further downside. The $1,550 buy-dip entry reflects the next meaningful support band; a break below $1,430 would signal a decisive structural breakdown from the recovery thesis and would open a path toward the $1,300–$1,350 support zone that was the January 2026 trough. The $1,900 target represents the breakout level above the descending channel that has contained ETH since the August 2025 peak; a close above $1,900 would confirm the channel break and set up a move toward $2,000 and beyond. The key near-term binary catalyst for ETH is Thursday’s US PCE: a soft print would reduce hawkish Fed expectations, improving crypto risk appetite broadly and likely pushing ETH above $1,800 immediately.
Session Catalysts
Watch for: (1) Thursday’s US PCE — the most important macro catalyst for crypto this week; soft data would reduce rate expectations and provide a cross-asset crypto relief rally; (2) Ethlabs development announcements — any specific institutional partnership or product launch from the new entity would be immediately ETH-positive; (3) Bitcoin price action — ETH has shown high correlation (0.62) with Bitcoin; BTC holding above $62,000 is a necessary condition for ETH’s recovery thesis; (4) BTC spot ETF flow data — sustained inflows into Bitcoin ETFs represent institutional crypto demand that benefits ETH by correlation; (5) DeFi TVL signals — declining TVL on Ethereum has been a structural headwind; any reversal in on-chain lending protocols like Aave would signal improving ETH network utilisation. The $1,600 buy-dip entry requires patience and should not be forced; traders should wait for a legitimate test of the $1,550–$1,600 zone before scaling in with a defined $1,430 stop.

Fundamental Backdrop
BNB is trading near $572.16 in Tuesday’s European session, under broad crypto risk-off pressure from the macro environment — namely the Fed’s hawkish hold and DXY strength — while the token-specific fundamentals remain relatively stable. BNB hit an all-time high of $1,355 in October 2025, reflecting the post-regulatory-clarity bull market driven by Binance’s landmark $4.3 billion Department of Justice settlement in 2024 and the leadership transition following CZ’s departure, which ultimately restored long-term confidence. From that high, BNB has pulled back approximately 58%, a sharper correction than Bitcoin but consistent with the broader altcoin market structure of high-beta moves in both directions. On fundamentals, the BNB Chain continues to show resilience: 24-hour trading volume surged +47.10% in the past day to approximately $997 million, signalling meaningful accumulation activity. The Auto-Burn mechanism — which systematically reduces BNB’s total supply toward 100 million tokens — provides a structural supply-side deflation floor that distinguishes BNB from pure speculative assets. BNB Chain’s total value locked (TVL) in DeFi protocols remains stable above $5 billion, and the cross-chain utility (BNB Chain ↔ Ethereum ↔ other EVM networks) positions it as infrastructure rather than pure speculation. Regulatory clarity from Japan’s securities law and MiCA implementation in Europe are near-term uncertainty factors but medium-term legitimisation drivers.
Technical Outlook
BNB is trading in the $565–$580 zone, extending its decline from the $1,355 all-time high as macro headwinds mount. The $530 buy-dip level represents a key support zone where the RSI would likely reach oversold territory on a standard pullback and where multiple prior short-term support bases were established during the mid-2026 sell-off. The stop at $490 sits below significant structural support; a close below $490 would signal a breakdown toward $400–$420. The $660 target is the former support level that became resistance during the most recent decline phase — a re-test of $660 would require both the macro backdrop to improve (soft PCE reducing Fed tightening expectations) and BNB-specific catalysts (exchange volume recovery, new BNB Chain partnerships). The 24-hour volume surge of +47% is the most immediately bullish signal in the current data: elevated volume at recent lows is a classic accumulation signature and argues against chasing shorts at current levels.
Session Catalysts
Watch for: (1) Bitcoin’s ability to hold above $62,000 — the leading indicator for the entire altcoin space including BNB; (2) BNB Chain TVL updates — any reversal in DeFi outflows on BNB Chain would be a positive network-utilisation signal; (3) Thursday’s US PCE — reduces Fed hiking expectations if soft, providing cross-asset crypto relief; (4) Regulatory developments in Europe (MiCA) — as MiCA implementation progresses, exchange-traded BNB products become more feasible in EU jurisdiction, expanding the institutional addressable market; (5) Binance platform trading volumes — as the world’s largest exchange, Binance’s trading activity and BNB fee discounts create a direct demand-for-BNB link; any increase in overall crypto market activity boosts BNB demand structurally. The dip-buy at $530 is a patience trade that requires a meaningful risk-off leg to play out before entry, rather than a chase at the current $572 mid-range level.

Fundamental Backdrop
The EU 30-year Bund yield at approximately 3.489% is the bond market’s clearest expression of the ECB’s stagflationary dilemma: the central bank has just hiked its deposit rate to 2.25% — the first rate increase since 2023 — into an economy whose composite PMI has now contracted for three consecutive months. This paradox drives a very specific pattern in the yield curve: short rates rise mechanically with ECB policy, but long rates rise for a different and more dangerous reason — the market is pricing an elevated long-run inflation risk premium because the ECB has validated that it will sacrifice growth to fight energy-driven inflation. The ECB staff June 2026 projections note HICP reached 3.0% in April (the highest since late 2022), driven primarily by the Middle East energy shock, while Eurozone GDP contracted 0.1% in Q1 2026. That is a textbook stagflationary configuration for long-duration bonds: growth is falling, but the central bank is hiking, which means neither the growth bull case nor the deflationary bear case for bonds is playing out cleanly. ECB member Pierre Wunsch’s comment that another hike could come as soon as July now looks aggressive given today’s PMI data, but the bond market is not yet pricing a full ECB pivot — it is instead pricing a higher terminal rate path with a sharper subsequent recession, which is precisely the environment in which long-end yields can continue to drift higher even as short-end expectations stabilise.
Technical Outlook
The 30-year Bund yield has been trending higher since the ECB hike was confirmed, with the yield rising from approximately 3.04% (the level cited in CSFX’s June 8 European session analysis) to the current 3.489% — a rise of 45 basis points in two weeks. The trend is intact as long as the yield stays above 3.20% on a closing basis, which represents the pre-hike consolidation zone and the stop level for the short-duration position. The 3.60% target aligns with the technical projection from the breakout above the 3.20–3.30% resistance range: measured-move analysis suggests 3.55% as the first significant resistance zone above current levels. The key risk to the yield-rise thesis is if ECB speakers significantly shift their forward guidance toward a pause or if eurozone growth data comes in materially weaker than expected (which could perversely reduce the term premium if markets expect rate cuts before the next hike). Thursday’s US PCE has an indirect but important effect: a soft PCE would reduce global rate expectations broadly, including European long-end yields, potentially capping the move at 3.52%.
Session Catalysts
Watch for: (1) ECB speakers this week — Wunsch, Lane, and Schnabel’s responses to today’s PMI misses will be the defining communication of the week for EU bonds; a dovish shift could cap the yield rise at 3.45%; (2) Today’s Eurozone Composite PMI confirmation at 49.5 — the data is already released but any individual country surprise could modify expectations; (3) Thursday’s US PCE — a global rates event that will affect Bund yields via the global term premium channel; (4) German fiscal developments — Germany’s government infrastructure and defence spending programme is increasing Bund supply at the 30-year end, which structurally pressures long-end yields; (5) EU-Iran energy deal progression — a durable peace deal that sustainably lowers energy prices would be the most powerful potential ECB-dovish catalyst, reducing the inflation basis for further hikes and compressing long-end yields. The short-duration (short-Bund-price, long yield) position has the most straightforward risk-reward at current levels given the stagflationary policy mix.
European Session — Frequently Asked Questions
The structural questions behind today’s market moves, answered in depth
European Session Summary — 23 June 2026
Tuesday’s European session is defined by a dual headline collision: UK Prime Minister Keir Starmer’s resignation — the country’s seventh leader in a decade — resolved the near-term political uncertainty premium with sterling rallying and gilt yields falling 4bp, while Germany’s June flash Composite PMI crashing to 48.0 against a 49.9 consensus reaffirmed the Eurozone’s stagflationary trap of ECB hiking into contraction. The macro architecture for the session is therefore split: GBP outperforms, EUR struggles, the DAX shows remarkable resilience on defence and auto tailwinds, and the EU 30-year Bund yield pushes toward 3.42% as the bond market prices the ECB’s difficult policy path. The dollar remains the global dominant force at 13-month highs, capping any recovery in EUR/USD and maintaining pressure on silver, crypto, and commodity prices through the strong-USD channel.
The actionable framework is clear. Highest-conviction trade: EUR/GBP sell-rallies toward 0.8720, stop 0.8790, target 0.8500 — the Burnham orderly succession eliminates the GBP political premium while Germany’s PMI collapse strips the ECB hike premium from EUR simultaneously.
In FX, EUR/USD sell-rallies toward 1.4150, stop 1.4260, target 1.3950 — the Germany PMI miss cemented EUR’s inability to reclaim the 1.4100 breakpoint, and the DXY at 13-month highs with 40bp of additional Fed tightening priced makes this the dominant structural trade. In metals, Silver buy-dips toward $61.00, stop $59.00, target $67.00 — oversold RSI and Thursday’s PCE as a potential catalyst for a relief rally in non-yielding assets; patience required. In grains, Corn buy-dips toward $4.05, stop $3.85, target $4.50 — oversold RSI below 30, China buying signal confirmed, and June 30 USDA Acreage report as the binary catalyst. In indices, DAX 40 sell-rallies toward 25,200, stop 25,700, target 24,100 — the PMI stagflation trap creates a structural ceiling at the all-time high zone; patience for the entry level. In UK equities, NatWest Group buy-dips toward 490p, stop 460p, target 585p — 52-week +60% run maintains structural momentum; Burnham Chancellor risk creates the dip-buying entry window. In crypto, Ethereum buy-dips toward $1,550, stop $1,430, target $1,900 — Ethlabs institutional narrative is the medium-term catalyst; wait for the PCE to resolve macro direction first. In bonds, EU 30Y short-duration (long yield) from 3.489%, stop at yield reversal through 3.20%, target 3.60% — ECB hiking into contraction with inadequate fiscal response is the most structurally clear fixed income trade on the session. The pivotal variables for the rest of the week: (1) ECB speakers’ response to today’s PMI disaster; (2) UK PMI data today and the Burnham Chancellor selection; (3) Thursday’s US PCE relative to consensus — the single most important number for every asset class this week.
Access Live European Markets →