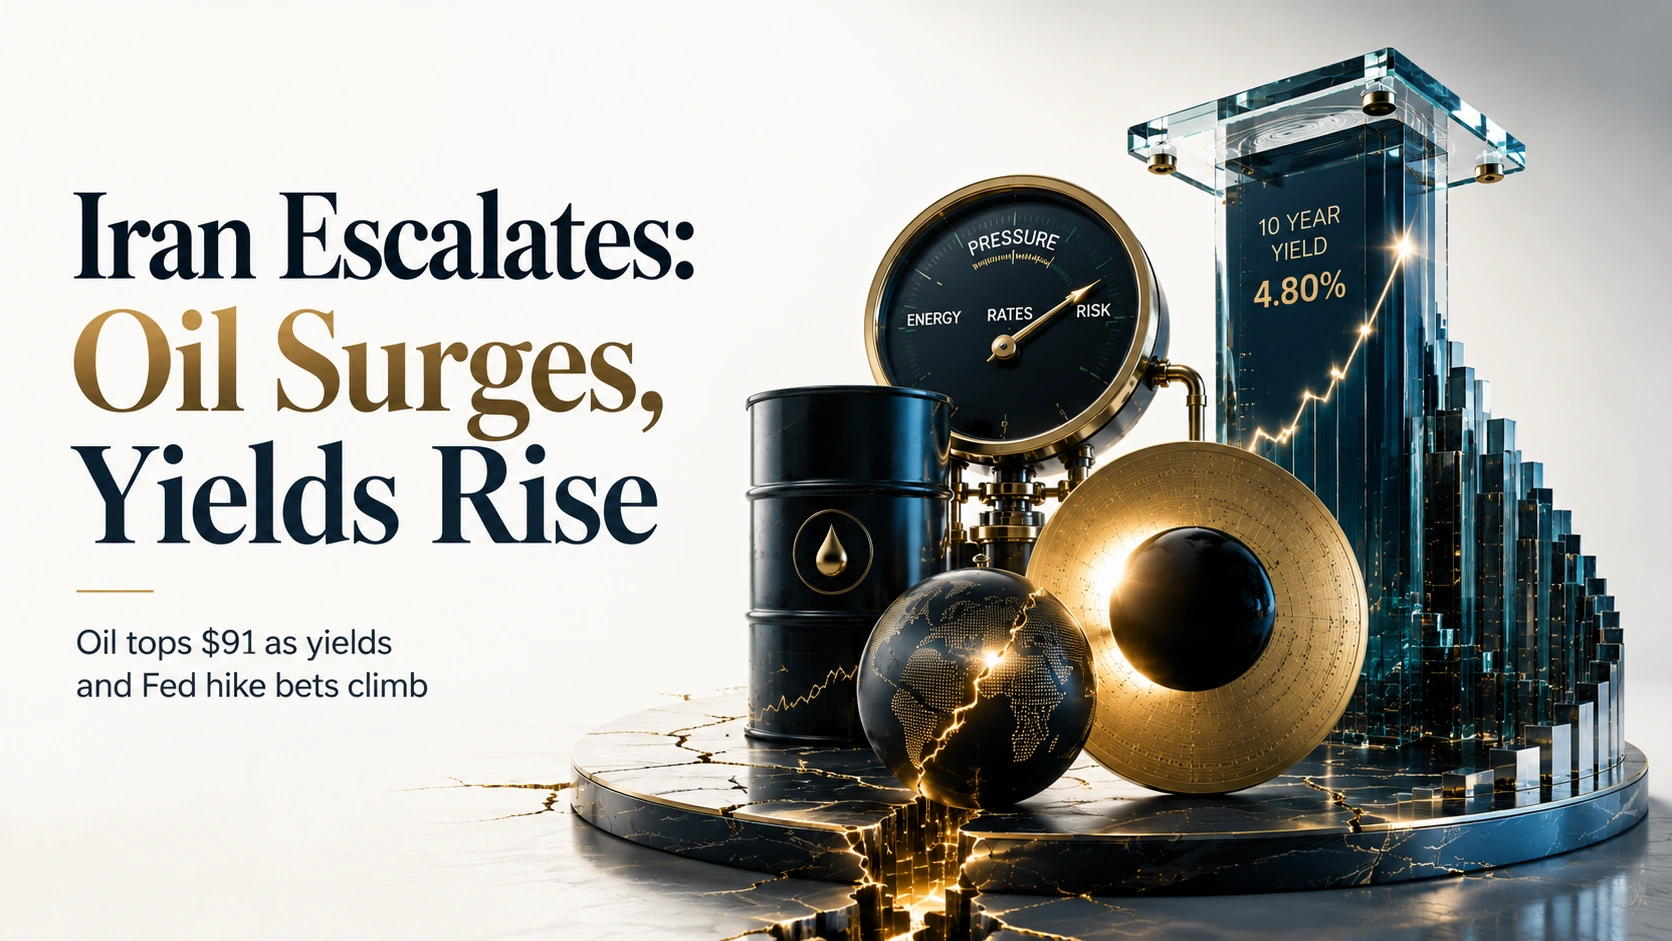
Iran Retaliates With Strikes on US Bases and the UAE as the 10-Year Yield Holds Near 2025 Highs and Oil Tops $91 | Technical Analysis – US Session | 2 September 2026
Iran Retaliates With Strikes on US Bases and the UAE as the 10-Year Yield Holds Near 2025 Highs and Oil Tops $91
USD/CAD · USD/CHF · Gold · Crude Oil · Nasdaq 100 · US 10Y Yield · BTC/USD · XRP — live US market outlook today, updated through the trading session
US Market News — Live Now, 2 September 2026
Top-moving headlines shaping the US market outlook today, updated through the session
Iran Retaliates for Larak Island Strikes, Hitting US Bases and Targets in the UAE and Jordan
Iran struck back overnight against Tuesday’s US strikes on Iranian rocket launchers near the Strait of Hormuz, launching rockets and drones at American military bases and hitting additional targets in the UAE and Jordan. President Trump has warned of a much larger response should Tehran continue escalating, while a senior Iranian military source said any further retaliation would be “many times greater,” keeping Wall Street on edge into the US session.
GeopoliticsOil Extends Rally for a Third Session, WTI Tops $91 as Brent Nears $95
West Texas Intermediate is trading near $91.98 a barrel, up almost 2% on the day and building on Tuesday’s 5.2% jump, its biggest one-day gain in five weeks, while Brent crude holds close to $95. The advance comes despite US Energy Secretary Chris Wright confirming a record 17 million barrels transited the Strait of Hormuz on Monday, underscoring how much geopolitical risk premium the market is now pricing into every barrel.
CommoditiesUS 10-Year Yield Holds Near Highest Level Since January 2025 at 4.80%
The US 10-year Treasury yield is holding near 4.80% after pausing a five-session rally that had pushed it above 4.81%, its highest level since October 2023 on some measures. Markets now price roughly a 65-66% probability of a 25-basis-point Fed hike at the 15-16 September FOMC meeting, up sharply from about 40% a week ago, following Fed Chair Kevin Warsh’s reinforced hawkish tone.
RatesNasdaq 100 Futures Slip and VIX Jumps Over 9% as Rising Yields Squeeze Tech
Nasdaq 100 futures are trading near 29,069.50, lower on the session as surging Treasury yields and rising oil prices weigh on richly valued chip and AI-infrastructure names, with the CBOE Volatility Index jumping more than 9% to above 16. Dell shares surged roughly 9% overnight on strong earnings and guidance, offering a partial offset to the broader index-level weakness.
EquitiesGold Struggles for Its Usual Safe-Haven Bid, Holds Near a Two-Week Low
Gold is trading near $4,370.76 an ounce, clawing back part of Tuesday’s slide to a two-week low around $4,330, but the metal remains under pressure as rising Treasury yields and a firmer Dollar dominate price action even amid active US-Iran hostilities. Traders note that this time the geopolitical shock is lifting oil, yields and the Dollar together, rather than delivering gold’s textbook safe-haven bid.
CommoditiesBitcoin and XRP Tumble as Crypto Risk Appetite Sours on the Reignited Iran War
BTC/USD is trading near $77,000, down roughly 1.5-2% on the day as the widening Iran conflict drives a broad risk-off move across digital assets, even after Bitcoin ETFs posted their best month of 2026 in August with roughly 25% gains. XRP is trading near $1.33, down almost 3% and underperforming the wider crypto complex despite a record week of spot XRP ETF inflows above $110 million.
CryptoLive · Updated through the US morning session, Wednesday 2 September 2026
US Economic Calendar This Week — 2 September 2026
Key releases and events shaping price action through the rest of the week
| Time | Event | Forecast / Detail | Impact | Market Read |
|---|---|---|---|---|
| 🇺🇸Overnight (Recap) | Fed Chair Kevin Warsh Reinforces Hawkish Tone on Inflation | Markets price roughly 65-66% odds of a September Fed hike | 🔴 CRITICAL | Still the dominant driver of the broad Dollar bid and rising yields |
| 🇮🇷Overnight | Iran Retaliates: Strikes US Bases and Targets in the UAE and Jordan | Response to Tuesday’s US strikes on Larak Island near Hormuz | 🔴 CRITICAL | Keeps oil, yields and risk sentiment on edge through the US session |
| 🇺🇸Today | US 10-Year Treasury Yield Holding Near January 2025 High | Yield near 4.80%, pausing a five-session rally above 4.81% | 🔴 CRITICAL | Reflects hawkish repricing of the September FOMC decision |
| 🇺🇸Today | US ADP Employment Change (August) | Key labour-market gauge ahead of Friday’s Non-Farm Payrolls | 🔴 CRITICAL | A soft print would revive rate-cut chatter and could pressure the Dollar |
| 🇺🇸Today | US ISM Manufacturing PMI (August) | Gauge of factory-sector activity and price pressures | 🟢 MEDIUM | A hot prices-paid component would reinforce September hike bets |
| 🇺🇸Today | US JOLTS Job Openings (July) | Labour-demand gauge watched closely by the Fed | 🟢 MEDIUM | Softer openings would add to two-way risk around the rate path |
| 🇨🇦Today | Bank of Canada Rate Decision | BoC widely expected to hold rates unchanged | 🟢 MEDIUM | A hold alongside a hawkish Fed widens the US-Canada rate gap for USD/CAD |
| 🇺🇸Friday, 4 September | US Non-Farm Payrolls (August) | The week’s key US data risk alongside the Fed’s rate path | 🔴 CRITICAL | A strong print would further cement September Fed hike pricing |
| 🇺🇸Tue-Wed, 15-16 September | FOMC Meeting | ~65-66% probability of a 25bp hike priced by markets | 🔴 CRITICAL | The dominant near-term catalyst for the Dollar, yields and equities |
US Session Trade Ideas — USD/CAD, Gold and More
Technical setups and fundamental context across the session’s eight key instruments
USD/CAD
Why This Setup
Roughly 65-66% odds of a September Fed hike against a Bank of Canada widely expected to hold today is a genuine tailwind for the widening US-Canada rate gap, though oil’s advance toward $92 is a real source of two-way risk given the Loonie’s status as a commodity-linked currency.

USD/CHF
Why This Setup
A hawkish Fed against an SNB holding its policy rate near zero is a genuine tailwind for the pair, though a stronger-than-expected Swiss PMI rebound to 57.1 and renewed Middle East-driven safe-haven flows into the Franc are a real source of two-way risk.

Gold
Why This Setup
Roughly 65-66% odds of a September Fed hike and a 10-year yield near 4.80% are a genuine headwind for a non-yielding metal, though the widening Iran war and record central-bank buying of 289 tonnes last quarter are a real source of two-way risk that could still spark a delayed safe-haven bid.

Crude Oil
Why This Setup
Iran’s retaliatory strikes on US bases and targets in the UAE and Jordan are a genuine tailwind that keeps the geopolitical risk premium bid, though the record 17 million barrels that transited Hormuz on Monday and any de-escalation headline remain a real source of two-way risk.

Nasdaq 100
Why This Setup
A 10-year yield near 4.80% and rising oil-driven inflation expectations are a genuine headwind for long-duration tech, though Dell’s roughly 9% overnight surge on strong earnings and guidance is a real source of two-way risk that could spark a relief bounce into the close.

US 10Y Yield
Why This Setup
Roughly 65-66% odds of a September Fed hike and oil-driven inflation pressure from the widening Iran conflict are a genuine tailwind for yields, though a soft ADP print today or Friday’s Non-Farm Payrolls is a real source of two-way risk that could cap the move higher.

BTC/USD
Why This Setup
August’s roughly 25% gain and the best month for Bitcoin ETFs in 2026 remain a genuine tailwind for institutional demand, though hawkish-Fed-driven risk-off tied to the widening Iran war is a real source of two-way risk that has driven a sharp pullback this morning.

XRP
Why This Setup
A record week of spot XRP ETF inflows above $110 million is a genuine tailwind for institutional demand, though broader hawkish-Fed-driven crypto risk-off tied to the widening Iran war and heavy structural escrow supply are a real source of two-way risk.

US Session FAQ — 2 September 2026
Quick answers to the questions traders are asking this session
Why did Iran retaliate and what happened overnight?
Why is Crude Oil surging even as the conflict widens?
Why is the US 10-Year Treasury yield near its highest level since January 2025?
Why are Nasdaq 100 futures and the VIX both up together?
Why isn’t Gold getting its usual safe-haven bid from the Iran war?
Why is USD/CAD rising despite oil’s advance, which usually supports the Loonie?
Why are Bitcoin and XRP falling today?
What should traders watch for the rest of the US session?
US Session Summary — Wednesday, 2 September 2026 (Live Update)
Wednesday’s US session is trading on the back of a sharp overnight escalation, after Iran retaliated for Tuesday’s US strikes on Larak Island near the Strait of Hormuz by hitting American bases with rockets and drones and striking additional targets in the UAE and Jordan. The widening conflict follows Fed Chair Kevin Warsh’s reinforced hawkish tone on inflation, which has pushed the market-implied probability of a 25-basis-point Fed hike at the 15-16 September FOMC meeting to roughly 65-66%, up sharply from around 40% a week ago.
The US 10-year Treasury yield is holding near 4.80%, its highest level since January 2025, pausing after a five-session rally that had pushed it above 4.81%. USD/CAD has climbed to around 1.3894, as a broad Dollar bid built on hawkish Fed repricing outweighs oil’s usual support for the commodity-linked Loonie, with the Bank of Canada widely expected to hold rates at today’s meeting. USD/CHF is firm near 0.8130, up for a second straight session, as the widening gap between a Fed that looks close to hiking and a Swiss National Bank anchored near zero continues to lift the pair, even after a stronger-than-expected Swiss PMI rebound.
Crude Oil is extending its advance to $91.98 (Brent near $95) after Iran’s retaliatory strikes, even though US Energy Secretary Chris Wright confirmed a record 17 million barrels transited the Strait of Hormuz on Monday, and Gold is trading near $4,370.76, clawing back part of Tuesday’s slide to a two-week low but still missing its usual safe-haven bid as yields and the Dollar dominate. Nasdaq 100 futures are lower near 29,069.50 as rising yields and oil squeeze AI and chip names, with the VIX up more than 9%, even as Dell’s strong earnings offer a single-stock offset. Crypto markets are sharply lower, with BTC/USD easing toward $77,000 and XRP sliding toward $1.33 as the reignited Iran war drives a broad risk-off move despite strong underlying ETF demand for both assets.
Highest-conviction session idea: favour dips in the Fed-supported Dollar complex and the conflict-driven Crude Oil and US 10-Year Yield trades, while fading Nasdaq 100 rallies into resistance and treating Gold’s failure to rally on the Iran war as a genuine bearish signal, staying alert to any further escalation or de-escalation headline as the dominant swing factor for risk sentiment into the FOMC’s 15-16 September decision.
For the individual instruments: USD/CAD buy dips toward 1.3830, stop 1.3760, target 1.4020 — the widening US-Canada rate gap is a genuine tailwind, though oil’s advance toward $92 is a real source of two-way risk. USD/CHF buy dips toward 0.8060, stop 0.8000, target 0.8220 — the widening Fed-SNB rate gap is a genuine tailwind, though a stronger Swiss PMI and renewed safe-haven flows into the Franc are a real source of two-way risk. Gold sell rallies toward $4,460, stop $4,520, target $4,180 — hawkish Fed hike bets are a genuine headwind, though the widening Iran war and record central-bank buying are a real source of two-way risk. Crude Oil buy dips toward $89.50, stop $86.50, target $96.00 — Iran’s retaliatory strikes are a genuine tailwind, though the record Hormuz transit volume and any de-escalation headline are a real source of two-way risk. Nasdaq 100 sell rallies toward 29,350, stop 29,650, target 28,400 — rising yields are a genuine headwind, though Dell’s strong earnings and guidance are a real source of two-way risk. US 10Y Yield buy dips toward 4.70%, stop 4.60%, target 5.00% — hawkish Fed hike bets and oil-driven inflation risk are a genuine tailwind, though a soft ADP or Non-Farm Payrolls print is a real source of two-way risk. BTC/USD buy dips toward $73,000, stop $69,000, target $84,000 — August’s strong ETF inflow month is a genuine tailwind, though hawkish-Fed-driven crypto risk-off is a real source of two-way risk. XRP buy dips toward $1.20, stop $1.10, target $1.55 — a record week of ETF inflows is a genuine tailwind, though broader crypto risk-off is a real source of two-way risk. The decisive variable for the rest of the day is the market’s ongoing digestion of Iran’s retaliatory strikes alongside today’s ADP Employment Change, ISM Manufacturing PMI and JOLTS data, positioning into Friday’s Non-Farm Payrolls, and the FOMC’s 15-16 September decision. Size positions accordingly, and note that fast-moving Middle East headlines carry genuine event risk that could exaggerate moves in either direction.
Prices and levels in this report are indicative intraday figures compiled from live coverage and may differ from your broker’s feed. This report is for informational and educational purposes only and does not constitute investment advice.