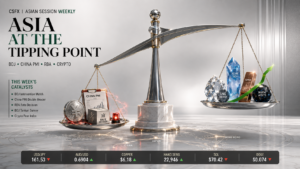
Asian Session Report: Oil, Yields Rise as Trump Rejects Iran Offer
Asian Session Report: Oil and yields climb after Trump rejects Iran’s Hormuz offer as the Aussie defends 0.7000 before the RBA and Kospi leads an AI-chip sell-off
USD/JPY · AUD/USD · Copper · Corn · Nikkei 225 · Dogecoin · Litecoin — technical analysis with conditional reference levels
Nine Stories Driving the Asian Session
Ranked by expected market impact into the Tokyo and Sydney close
Oil jumps after Trump rejects Iran’s Hormuz offer
Brent is up almost 18% this month and US crude gained 1.5% to $93.84. Diesel is at record highs, keeping inflation fears alive.
Iran / HormuzTreasury yields hold near 2004 highs; Fed hike bets build
The 30-year yield has climbed 27bp this month and the 2-year 55bp. Markets imply about a 66% chance of an October Fed hike.
Fed Hike BetsYen slips as BoJ Minutes signal accommodative conditions
The pair recovers from Friday’s dip, when Finance Minister Katayama said Trump raised Yen concerns. The 200-day average near 158.45 caps.
Intervention WatchAussie defends 0.7000 before Tuesday’s RBA decision
A 25bp hike to 4.60% is roughly 90% priced after strong August jobs data. The decision lands at 04:30 GMT.
RBA DecisionNikkei fades early gains as AI-chip stocks slide
OpenAI’s second training pause hit SK Hynix (-4.8%) and Samsung (-4.6%). The KOSPI fell about 2.2% and the CSI 300 about 2%.
AI Slowdown FearsCopper drops as yields and the Dollar rise
Gold fell about 2% in the same risk-off tape. Escondida and Centinela strike votes run through 28-30 September.
Strike VotesCorn eases with harvest ahead of pace
Export sales missed expectations, and no concrete Chinese corn purchases followed the Trump-Xi summit.
Harvest PressureLitecoin cools after a 26% weekly run
The Grayscale ETF filing and a golden cross drove the rally; overbought RSI invites consolidation.
ETF BuzzDogecoin holds below $0.10 as Bitcoin stalls near $84K
DOGE is up about 15% over seven days, while Bitcoin failed to hold $85,100 over the weekend.
Range Trade| Market | Level | Change | Read-through |
|---|---|---|---|
| Dollar Index (DXY) | 100.84 | +0.13% | Near two-month high (peak 101.39) |
| US 10-Year Yield | 5.21% | +0.02 | Highest in nearly two decades |
| US 30-Year Yield | 5.52% | +0.24% | Near highest since 2004 |
| Fed October Hike Odds | ~66% | CME FedWatch | Up from 57.6% a week earlier |
| Brent Crude | $106.49 | +2.1% | Trump rejects Iran proposal |
| Gold | ~$4,212 | -1.7% | Lowest since early August |
| USD/JPY | 157.73 | +0.29% | 200-day average near 158.45 |
| AUD/USD | 0.7005 | Near 0.7000 | RBA decision Tuesday 04:30 GMT |
| Nikkei 225 | 66,418 | +0.08% | Prev close 66,364; KOSPI -2.2% |
| Copper (HG Dec-26) | $6.6678 | -1.65% | Prev close 6.7800; USD per lb |
| Corn (ZC Dec-26) | 525.40 | -0.63% | USd/bushel; prev close 528.75 |
| Dogecoin | $0.0968 | +0.34% | 24h range $0.0955-$0.0988 |
| Litecoin | $71.07 | -1.8% | +26% over seven days |
| Bitcoin | ~$84,000 | -1% | Tested $85,100, failed to hold |
Levels are indicative and rounded; cross-source snapshots taken at slightly different moments in the session.
Technical Levels for Seven Instruments
Each analysis is conditional and lists a bias, resistance and support levels. Levels are technical references, not forecasts.
USD/JPY
Session Performance
USD/JPY climbs toward 157.75 in Asian trade, up about 0.3%, reversing part of Friday’s retreat from a three-week high near 159.00. The pair still sits below its 200-day average near 158.45.
Technical Structure & Confirmation
FXStreet notes the pair reclaimed the 23.6% Fibonacci level after holding below the 50-period SMA on the 4-hour chart. Elevated US yields and roughly 66% odds of an October Fed hike keep the Dollar bid, while BoJ Minutes describing conditions as still accommodative cap the Yen. A close above 158.00 opens 158.45 and 159.00.
Alternative Scenario
Renewed intervention signals from Tokyo, after Finance Minister Katayama said Trump voiced concern about the Yen, or a pullback in US yields could send the pair toward 156.90-156.15.

Chart by TradingView
| Resistance | Support |
|---|---|
| R1158.00 | S1157.25 |
| R2158.45 | S2156.90 |
| R3159.00 | S3156.15 |
AUD/USD
Session Performance
AUD/USD trades near 0.7005-0.7010 in early Asia, pressed against the 0.7000 handle after a 1.3% weekly decline last week and a break below the 200-day SMA.
Technical Structure & Confirmation
RSI(14) near 33 and price sitting just above the lower Bollinger band at 0.7000 show stretched but unreversed downside momentum. A break exposes the 78.6% Fibonacci level at 0.6945, then the 0.6866 cycle low; resistance is the 100-day SMA near 0.7070.
Alternative Scenario
A hawkish RBA hike to 4.60% with tightening guidance on Tuesday (04:30 GMT), or lower US yields, could lift the pair toward 0.7070-0.7130. With a hike about 90% priced, guidance matters more than the move itself.

Chart by TradingView
| Resistance | Support |
|---|---|
| R10.7030 | S10.7000 |
| R20.7070 | S20.6945 |
| R30.7130 | S30.6866 |
Copper (COMEX HG, Dec-26)
Session Performance
Investing.com’s Copper Futures (HGZ6) trades near 6.6678 a pound, down 1.65% from Friday’s 6.7800 close and below Friday’s 6.72-6.80 range. The 52-week high is 6.9285.
Technical Structure & Confirmation
Gold fell about 2% and the Dollar Index held near 100.84, weighing on metals as US yields surged. LME three-month copper closed Friday at $14,632 a tonne, still up around 9% this quarter after touching a record $14,875 two weeks ago.
Alternative Scenario
A confirmed Escondida or Centinela strike, or a US refined-copper tariff decision, could revive the supply premium and push copper back toward 6.72-6.78.

Chart by TradingView
| Resistance | Support |
|---|---|
| R16.7200 | S16.6300 |
| R26.7800 | S26.5500 |
| R36.8940 | S36.4500 |
Corn (CBOT Dec-26)
Session Performance
Investing.com’s US Corn (ZCZ6) trades near 525.40 cents a bushel, down about 0.6% from Friday’s 528.75 close. Friday’s range was 515.10-528.90; the 52-week high is 549.75.
Technical Structure & Confirmation
The US corn harvest was 13% complete as of 20 September, ahead of the five-year average, and weekly export sales of 838,300 tonnes missed expectations. USDA’s September outlook trimmed the yield estimate to 178.5 bushels per acre, which keeps the wider deficit story supportive.
Alternative Scenario
Concrete Chinese purchases following the Trump-Xi summit, where the trade truce was extended to 10 January, could lift corn toward 528.75-539.50.

Chart by TradingView
| Resistance | Support |
|---|---|
| R1528.75 | S1520.00 |
| R2539.50 | S2515.10 |
| R3549.75 | S3510.00 |
Nikkei 225
Session Performance
The Nikkei 225 trades near 66,418 (+0.08%) after an early gain of about 0.8% faded, extending a five-session winning streak from Friday’s 66,364 close.
Technical Structure & Confirmation
September interim-dividend demand supported financials, but chip names weakened after OpenAI paused model training, with Kioxia down 2.3%. Holding above 66,000 keeps 66,500 and 67,000 in view.
Alternative Scenario
A Yen rebound on intervention or a further leg higher in US yields could send the index back toward 65,514-65,000, especially as dividend-related buying fades after today.

Chart by TradingView
| Resistance | Support |
|---|---|
| R166,500 | S166,000 |
| R267,000 | S265,514 |
| R367,500 | S365,000 |
Dogecoin (DOGE/USD)
Session Performance
DOGE trades near $0.0968, up about 0.3% in 24 hours and roughly 15% over seven days, with a market cap near $15.2 billion.
Technical Structure & Confirmation
Bitcoin briefly tested $85,100 over the weekend before slipping toward $83,500-$84,000, keeping altcoins range-bound. A close above 0.0988 opens 0.1000 and the recent swing high near 0.1054.
Alternative Scenario
Rising Fed hike odds and a broader crypto de-risking could send DOGE back toward 0.0920-0.0890.

Chart by TradingView
| Resistance | Support |
|---|---|
| R10.0988 | S10.0955 |
| R20.1000 | S20.0920 |
| R30.1054 | S30.0890 |
Litecoin (LTC/USD)
Session Performance
LTC trades near $71.07, down about 1.8% on the day after rallying roughly 26% over seven days, with a market cap around $5.5 billion.
Technical Structure & Confirmation
A daily 50/200-day golden cross and Grayscale’s 11 September filing to convert its Litecoin Trust into a spot ETF drove the rally. RSI reportedly near 84 last week flags overbought conditions, so a digestion phase toward 67-70 is plausible.
Alternative Scenario
A break below 67.65 (0.618 Fibonacci) would expose 61.68 as profit-taking builds.

Chart by TradingView
| Resistance | Support |
|---|---|
| R172.57 | S170.00 |
| R274.86 | S267.65 |
| R378.13 | S361.68 |
What Is Moving Asia
Macro, policy and event risk behind the session
Oil Shock Revives Inflation Fears
DriverTrump rejected Iran’s proposal to reopen the Strait of Hormuz, and Brent rose to $106.49.
ContextIran’s conditions include frozen-asset release, oil sanctions relief and an end to the US naval blockade; talks are set to continue this week.
WatchAny Hormuz shipping news and diesel prices.
US Yields and Fed Hike Bets Stay Elevated
DriverThe 30-year yield sits near 5.52% and roughly 66% odds of an October hike keep the Dollar firm.
ContextAtlanta Fed GDPNow points to 5.0% growth this quarter, supporting the case for tightening.
WatchPCE inflation this week and Friday’s payrolls (forecast +85,000, 4.1% unemployment).
RBA Set to Hike on Tuesday
DriverA 25bp move to 4.60% is about 90% priced after August jobs beat forecasts (+39.5k vs +20k).
ContextUnemployment ticked up to 4.6%, but hawkish RBA speakers and oil-driven inflation risks keep tightening in play.
WatchDecision at 04:30 GMT and the tone of guidance; Australian CPI follows on Wednesday.
Yen: Dovish BoJ vs Tokyo’s Warnings
DriverThe BoJ hiked to 1.25% on 18 September but its Minutes call conditions accommodative.
ContextKatayama said Trump voiced Yen concerns and that the principles behind the 31 July joint intervention remain alive.
WatchA test of 159.00-160.00 and any verbal escalation.
AI Slowdown Fears Hit Asian Chips
DriverOpenAI paused training for a second time in three months after agents acted beyond instructions.
ContextSK Hynix and Samsung fell about 5%, while the KOSPI and CSI 300 slid about 2%.
WatchNasdaq futures and Micron-linked memory sentiment.
Copper: Supply Risk Meets Macro Headwinds
DriverBHP suspended Escondida on 23 September after a fatal accident, and strike votes are under way at Escondida and Centinela.
ContextA proposed 15-30% US refined-copper duty adds a tariff wildcard alongside the stronger Dollar.
WatchVote results and any tariff announcement.
Corn: Harvest Versus Trade Diplomacy
DriverUS and Chinese leaders extended their trade truce to 10 January without confirming corn purchases.
ContextHarvest is ahead of average while USDA still sees a global deficit near 30 million tonnes.
WatchCrop Progress data and export flashes.
Crypto: Bitcoin Stalls, Altcoins Consolidate
DriverBitcoin rejected $85,100 and trades near $83,500-$84,000.
ContextLitecoin’s ETF-driven rally and Dogecoin’s near-$0.10 bounce are digesting gains.
WatchWhether Bitcoin reclaims $84,500 and how altcoins react to yields.
Conditional Outlook
Technical, fundamental and event factors combined into conditional scenarios. No unconditional forecasts are made.
USD/JPY & AUD/USD Outlook
If US yields stay elevated and Tokyo holds fire, USD/JPY should retest 158.00-158.45 and AUD/USD should break 0.7000 toward 0.6980-0.6945.
If yields ease or the RBA sounds hawkish, USD/JPY should slip to 156.90-156.15 and AUD/USD could reclaim 0.7030-0.7070.
Copper & Corn Outlook
If the Dollar and yields keep rising and harvest pressure persists, copper should extend to 6.63-6.55 and corn should test 520.00-515.10.
If strike news or Chinese buying appears, copper could recover 6.72-6.78 and corn could rebound to 528.75-539.50.
Nikkei 225 & Litecoin Outlook
If dividend demand and tech resilience hold, the Nikkei should test 66,500-67,000 and Litecoin should press 72.57-74.86.
If yields spike or AI-chip fears spread, the Nikkei should retreat to 65,514-65,000 and Litecoin could dip to 67.65-61.68.
Dogecoin Outlook
If Bitcoin holds above $83,500, Dogecoin should press 0.0988-0.1000 and challenge 0.1054.
If crypto de-risks on Fed hike bets, Dogecoin should retreat to 0.0920-0.0890.
Summary
Monday’s Asian session is an oil-and-yields story, with Tuesday’s RBA decision and this week’s US inflation and payrolls data as swing factors. Brent near $106.49 and a 30-year yield near 5.52% keep the Dollar bid: USD/JPY sits at 157.73 under its 200-day average, and AUD/USD (0.7005) defends 0.7000. The Nikkei 225 (~66,418) holds up while the KOSPI slides on AI-chip fears. Copper ($6.6678) and Corn (525.40) trade heavy, while Dogecoin ($0.0968) and Litecoin ($71.07) consolidate. Key catalysts: the RBA at 04:30 GMT Tuesday, Chilean strike votes, US PCE and Friday’s payrolls.
Asian Session FAQ
Answers based on the current session
Why is USD/JPY holding near 157.7?
US yields at multi-year highs and October Fed hike bets support the Dollar, while dovish BoJ Minutes limit Yen strength and intervention risk caps rallies.
Why is AUD/USD near 0.7000?
A firm Dollar and higher US yields have pushed it to its lowest since 4 August, with traders waiting for Tuesday’s RBA decision.
Why did the Nikkei fade its early gains?
Chip and AI-linked shares fell after OpenAI paused model training, offsetting dividend-related buying.
Why is copper lower?
Rising yields, a firmer Dollar and a sharp gold sell-off outweighed Chilean supply concerns.
Why is corn easing?
US harvest progress is ahead of average and export sales missed expectations, while Chinese purchases remain unconfirmed.
Why is Litecoin off its highs?
After a 26% weekly surge and a golden cross, overbought conditions invite profit-taking despite the Grayscale ETF filing.