Oil’s Middle East Spike Drives the 10-Year to the Brink of 5% as Wall Street Braces for Fed Week | Technical Analysis – US Session | 14 September 2026
Oil’s Middle East Spike Drives the 10-Year to the Brink of 5% as Wall Street Braces for Fed Week
USD/CAD · USD/CHF · Gold · Crude Oil · Nasdaq 100 · US 10Y · BTC/USD · XRP — live US market outlook today, updated through the trading session
US Market News — Live Now, 14 September 2026
Top-moving headlines shaping the US market outlook today, updated through the session
Oil Jumps Toward $104 as Saudi Pipeline Stays Shut and Hormuz Risk Builds
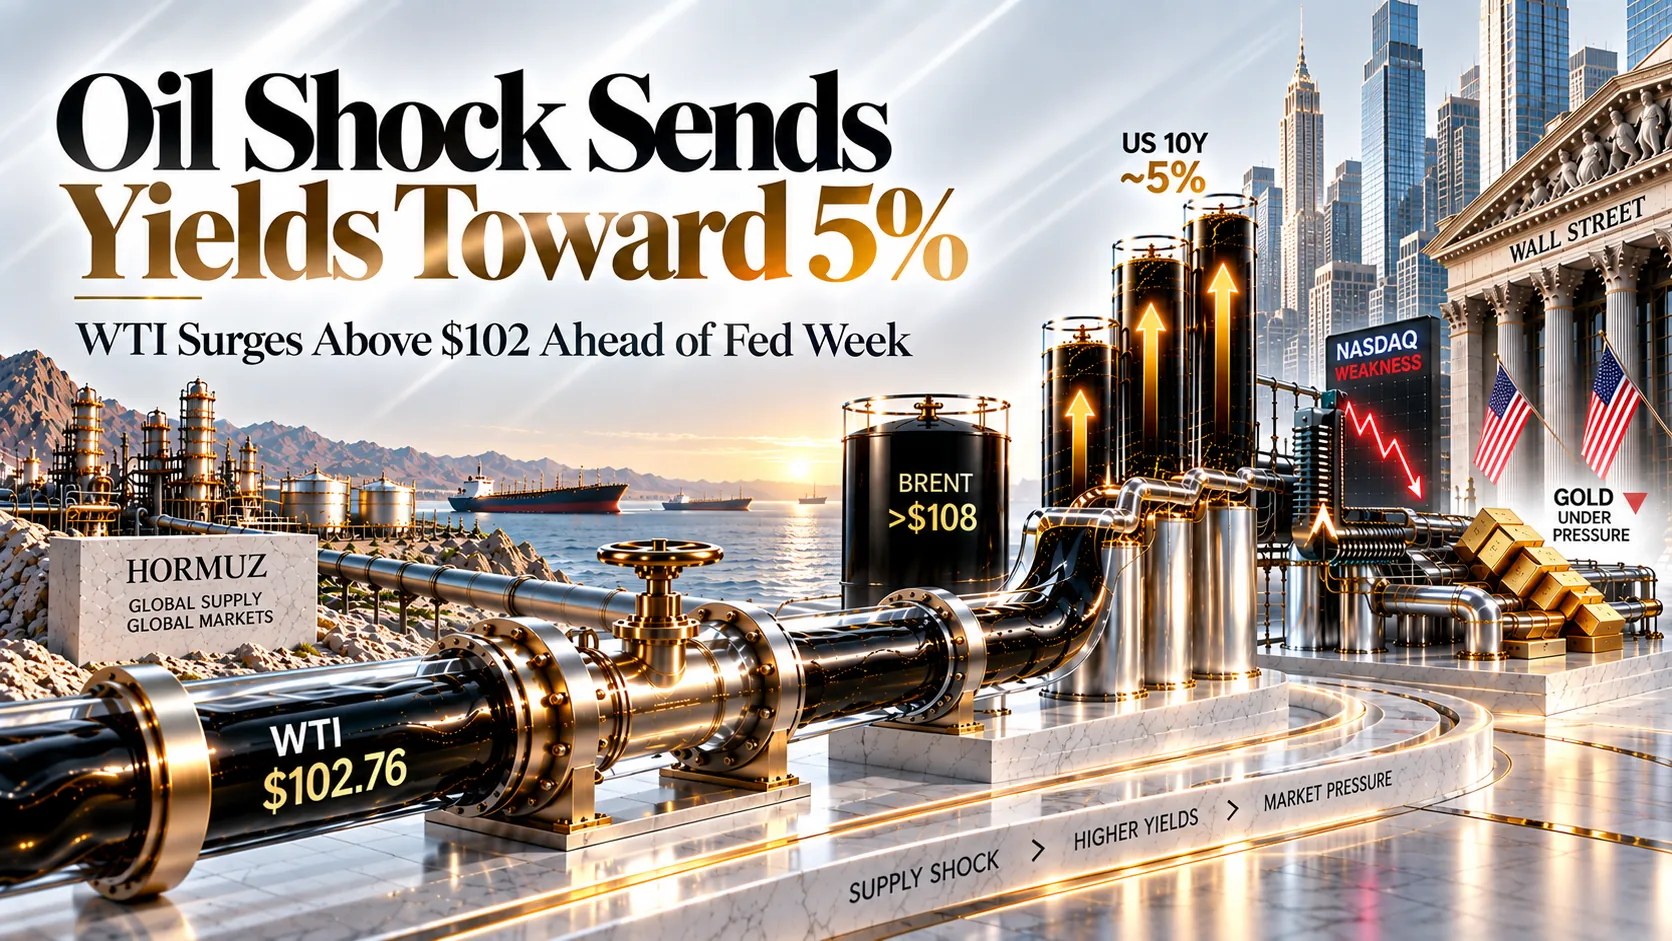
WTI crude is up close to 3.9% near $102.76 a barrel and Brent has cleared $108 after Saudi Arabia confirmed its East-West pipeline — its main route bypassing the Strait of Hormuz — remains shut following a drone strike traced to Iran-backed militias in Iraq. Riyadh says repairs are underway, but the outage has stripped the market of a key supply buffer just as the war in the Middle East continues to spread.
Energy10-Year Treasury Yield Nears 5% as Traders Brace for Wednesday’s Fed Decision
The 10-year Treasury yield has climbed to roughly 4.97%, its highest level since 2023, as surging oil prices and Friday’s sticky CPI print push traders to price close to 85–90% odds of a 25-basis-point hike when the FOMC delivers its decision Wednesday at 2:00pm ET. Fed Chair Kevin Warsh has said he won’t pre-signal the outcome, and reports of friction with the White House over the rate path are adding to the uncertainty.
RatesNasdaq 100 Slides Toward 28,870 as AI Slowdown Warnings Hit Chipmakers
The Nasdaq 100 is down roughly 1.5–1.7% near 28,870 after Anthropic’s chief executive published an essay calling on the AI industry to slow the development of frontier models over safety concerns, a call President Trump publicly denounced as a “SICK conspiracy.” Nvidia and Broadcom are among the session’s heaviest drags as a broad semiconductor gauge sinks alongside the rise in Treasury yields.
EquitiesDollar Firms Broadly; USD/CAD and USD/CHF Buoyant Into FOMC
The Dollar has posted its biggest daily gain since June as hawkish Fed bets dominate the macro narrative. USD/CAD is firm near 1.3871 even though the oil rally would typically support the commodity-linked Loonie, while USD/CHF holds near 0.8168, with safe-haven Franc demand from Middle East risk only partly offsetting the broader Dollar bid heading into Wednesday’s decision.
ForexGold Pressured Near $4,302.78 as Rising Real Yields Outweigh War Risk
Gold is down toward roughly $4,302.78 an ounce, pressured as the 10-year Treasury yield’s push toward 5% and a broadly firmer Dollar overwhelm the metal’s traditional safe-haven bid from the ongoing Middle East war. The move continues a pattern seen since the conflict began, with Gold increasingly trading on rate expectations rather than pure geopolitical risk.
CommoditiesBTC Holds Near $77,700, XRP Firm at $1.40 Ahead of CLARITY Act Vote
BTC/USD is consolidating below the $80,000 mark near $77,700, up modestly on the day. XRP is holding near $1.40, above its 20-, 50- and 200-day moving averages, as traders position for Tuesday’s US Senate cloture vote on the CLARITY Act, a procedural step that needs 60 votes to advance the bill’s federal crypto market-structure framework.
CryptoLive · Updated through the US morning session, Monday 14 September 2026
US & Global Economic Calendar This Week — 14 September 2026
Key releases and events shaping price action through the rest of the week
| Time | Event | Forecast / Detail | Impact | Market Read |
|---|---|---|---|---|
| 🇺🇸Monday, Overnight | Saudi East-West Pipeline Outage | Shut after drone attack traced to Iran-backed militias in Iraq; repairs underway | 🔴 CRITICAL | Keeps WTI and Brent elevated through the US morning |
| 🇺🇸Last Friday, 11 September | US CPI Report | Headline steady around 3.4% y/y; core sticky near target overshoot | 🔴 CRITICAL | Cemented close to 85–90% priced odds of a Wednesday Fed hike |
| 🇺🇸Tuesday, 15 September | US Senate CLARITY Act Procedural Vote | Cloture vote on the Digital Asset Market Clarity Act; 60 votes needed | 🟢 MEDIUM | Key regulatory catalyst that XRP and broader crypto are trading into |
| 🇺🇸Tuesday, 15 September | FOMC Meeting Begins | Two-day policy meeting opens; decision due Wednesday | 🔴 CRITICAL | Sets up the week’s dominant cross-asset event risk |
| 🇺🇸Wednesday, 16 September, 2:00pm ET | FOMC Rate Decision & Press Conference | Markets pricing close to 85–90% odds of a 25bp hike; Chair Warsh press conference at 2:30pm ET | 🔴 CRITICAL | The decisive event risk this week for the Dollar, yields, equities and Gold |
| 🇺🇸This Week | US Retail Sales | Watched for signs of consumer resilience despite rising energy costs | 🟢 MEDIUM | Swing factor for growth expectations alongside the Fed decision |
| 🇯🇵Thursday–Friday, 17–18 September | Bank of Japan Meeting | Markets widely expect a 25bp hike to 1.25% | 🔴 CRITICAL | Key swing factor for broader Yen crosses and global risk sentiment this week |
| 🇺🇸🇮🇷Ongoing | US-Iran War & Strait of Hormuz | WTI near $102.76, Brent above $108 after today’s spike | 🔴 CRITICAL | Remains the dominant swing factor for oil, inflation and risk sentiment |
US Session Trade Ideas — USD/CAD, Gold, Nasdaq 100 and More
Technical setups and fundamental context across the session’s eight key instruments
USD/CAD
Why This Setup
Hawkish Fed bets and the Dollar’s broadest single-day gain since June are a genuine tailwind for USD/CAD heading into Wednesday’s decision, even though the Loonie’s status as an oil-linked currency amid a near-4% WTI rally is a real source of two-way risk that could cap the pair’s advance if crude strength persists.

USD/CHF
Why This Setup
Broad Dollar strength into a close to 85–90%-priced Fed hike is a genuine tailwind for USD/CHF, though renewed Middle East war headlines continue to lend the safe-haven Franc some underlying bid, a real source of two-way risk that has kept the pair’s advance measured rather than one-directional.

Gold
Why This Setup
The 10-year Treasury yield’s climb toward 5% and a broadly firmer Dollar are a genuine headwind that has decoupled Gold from its usual safe-haven role this session, though the ongoing Middle East war and any sign the Fed holds rates steady remain a real source of two-way risk that could spark a sharp reversal higher.

Crude Oil (WTI)
Why This Setup
The Saudi East-West pipeline shutdown and the broader spread of the US-Iran war are a genuine tailwind that has stripped the market of a key supply buffer, though confirmation that repairs are progressing quickly or any de-escalation in the Gulf is a real source of two-way risk that could unwind part of today’s spike.

Nasdaq 100
Why This Setup
A deepening semiconductor selloff tied to AI slowdown warnings, combined with a Treasury yield pushing toward 5%, is a genuine headwind for growth-heavy tech names, though any dovish surprise from Wednesday’s Fed decision or a swift cooling of the AI-safety debate is a real source of two-way risk that could fuel a sharp relief rally.

US 10-Year Treasury Yield
Why This Setup
Oil-driven inflation risk stacked on top of close to 85–90%-priced Fed hike odds is a genuine tailwind pushing yields toward the psychologically important 5% level, though Wednesday’s actual FOMC decision and press conference remain a real source of two-way risk that could just as easily send yields sharply lower on a dovish surprise.

BTC/USD
Why This Setup
BTC’s ability to hold above the low-$77,000s despite a broad risk-off tone in equities is a genuine tailwind, though rising real yields and a firmer Dollar into Wednesday’s Fed decision remain a real source of two-way risk that could pressure crypto alongside other risk assets if the hike comes with a hawkish tone.

XRP
Why This Setup
XRP holding above its 20-, 50- and 200-day moving averages into a nine-week streak of ETF inflows is a genuine tailwind, though Tuesday’s knife-edge Senate cloture vote on the CLARITY Act is a real source of two-way risk that could swing the pair sharply in either direction depending on the outcome.

US Session FAQ — Monday, 14 September 2026
Quick answers to the questions traders are asking this session
Why is crude oil surging and how is it connected to the Fed?
Why is the 10-year Treasury yield close to 5%?
Why is the Nasdaq 100 falling today?
Why are USD/CAD and USD/CHF both higher despite very different backdrops?
Why is Gold falling if there’s a war going on?
What’s happening with BTC/USD and XRP heading into this week’s catalysts?
What should traders watch for the rest of the US session and the week?
US Session Summary — Monday, 14 September 2026 (Live Update)
Monday’s US session is carrying a Middle East supply shock and a pivotal Fed week into the same trading hours. WTI crude is holding a roughly 3.9% gain near $102.76 a barrel and Brent has topped $108 after Saudi Arabia shut its East-West pipeline following a drone attack traced to Iran-backed militias in Iraq, stripping the market of a key buffer against further Strait of Hormuz disruption. Equities are responding with clear caution: the Nasdaq 100 has slid roughly 1.5–1.7% toward 28,870 as a semiconductor selloff deepens after Anthropic’s chief executive called for the AI industry to slow frontier model development, a call President Trump publicly denounced, with the S&P 500 and Dow also lower.
Currency, rates and metals markets are trading defensively into Wednesday’s FOMC decision. USD/CAD has firmed to roughly 1.3871, up on the day, as broad Dollar strength outweighs the oil-driven support that would normally lift the commodity-linked Loonie, while USD/CHF holds near 0.8168 as Franc safe-haven demand only partly offsets the same Dollar bid. The 10-year Treasury yield has climbed to about 4.97%, within reach of the 5% threshold last crossed in 2023, as oil-driven inflation risk stacks on top of Friday’s sticky CPI print. Gold is the session’s clearest casualty of that yield move, slipping toward $4,302.78 an ounce even as the Middle East war continues. In crypto, BTC/USD is holding near $77,700 below the $80,000 mark while XRP holds near $1.40, above its key moving averages, ahead of Tuesday’s CLARITY Act cloture vote.
Highest-conviction session idea: stay long Crude Oil on dips while the Saudi pipeline outage persists, fade Nasdaq 100 rallies while the AI-slowdown debate and rising yields keep pressuring chipmakers, and treat Wednesday’s FOMC decision as the dominant cross-asset catalyst for the remainder of the week — while watching Tuesday’s CLARITY Act vote as the binary event for crypto positioning.
For the individual instruments: USD/CAD buy dips toward 1.3830, stop 1.3790, target 1.3960 — broad Dollar strength into Fed week is a genuine tailwind, though the oil-linked Loonie’s own strength is a real source of two-way risk. USD/CHF buy dips toward 0.8130, stop 0.8090, target 0.8250 — hawkish Fed bets are a genuine tailwind, though Franc safe-haven demand from Middle East risk is a real source of two-way risk. Gold sell rallies toward 4,330, stop 4,380, target 4,180 — rising real yields are a genuine headwind, though the ongoing war and any dovish Fed surprise are a real source of two-way risk. Crude Oil buy dips toward 101.50, stop 99.00, target 108.00 — the Saudi pipeline outage is a genuine tailwind, though swift repairs or de-escalation are a real source of two-way risk. Nasdaq 100 sell rallies toward 29,300, stop 29,600, target 28,200 — the AI-slowdown selloff and rising yields are a genuine headwind, though a dovish Fed surprise is a real source of two-way risk. US 10-Year Yield favors a test of 5.00% toward 5.10%, watch 4.85% as invalidation — oil-driven inflation risk and hawkish Fed odds are a genuine tailwind, though Wednesday’s actual decision is a real source of two-way risk. BTC/USD buy dips toward 76,000, stop 74,000, target 82,000 — relative resilience versus equities is a genuine tailwind, though broad risk sensitivity to the Fed decision is a real source of two-way risk. XRP buy dips toward 1.35, stop 1.32, target 1.50 — steady ETF inflows and support above key moving averages are a genuine tailwind, though Tuesday’s knife-edge CLARITY Act vote is a real source of two-way risk. The decisive variable for the rest of the US session and into Wednesday’s Fed decision is whether the Saudi pipeline outage deepens into a broader supply crisis or gets resolved quickly, and whether the AI-safety debate continues to weigh on tech. Size positions accordingly, and note that fast-moving Hormuz, Fed and CLARITY Act headlines carry genuine event risk that could exaggerate moves in either direction.
Ready to act on today’s setups? Open an Account with Capital Street FX and trade every instrument covered in this report on our Zero Account‘s 0.0 Pips Spreads and 1:10000 Leverage, across 2000+ Instruments, with a welcome deposit bonus and 24/7 Live Support on hand for every session.
Not sure which account fits your style? Compare our Account Types side by side with our Account Comparison tool, browse current Promotions / Bonus offers, and trade from our Trading Platform suite. Funding is simple via our Deposit & Withdrawal options. For ongoing coverage, explore our Forex Analysis Pages, Commodity Analysis Pages and Crypto Analysis Pages, plus our Daily Market Analysis and Weekly Market Analysis reports and the full Economic Calendar. New to trading? Visit our Trading Education / Blog, or reach our Contact Us / Live Support team any time.
Access Live US Markets →