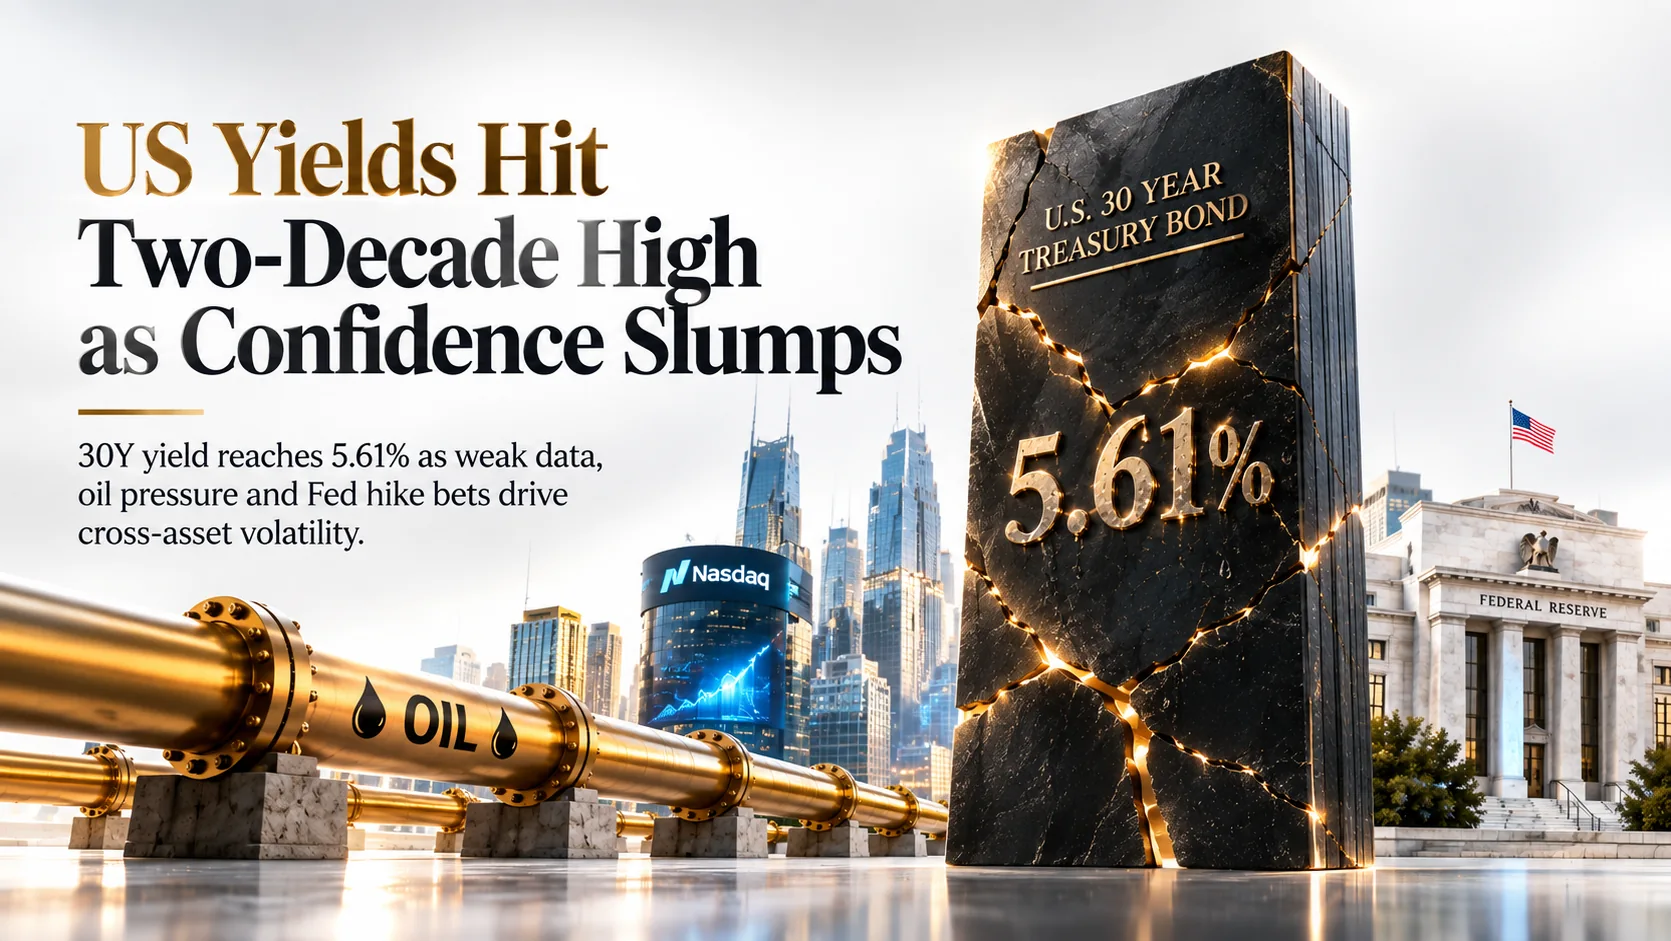
US Session Report: 30-Year Yield Above 5.61% at a Two-Decade High as Consumer Confidence Sinks and Silver Slips Below $61 | 29 September 2026
US Session Report: 30-Year Yield Above 5.61% at a Two-Decade High as Consumer Confidence Sinks and Silver Slips Below $61
US stocks slipped in midday trade as the long bond sold off again and tech gave back early gains. The 30-year Treasury yield touched 5.613%, a two-decade high, with the 10-year near 5.27%. The S&P 500 traded lower after Monday’s 0.8% fall to 7,683.69, Nasdaq 100 futures hovered near 30,500, WTI fell about 2% to $90.75 and Brent to about $103.6 as Saudi pipeline flows recovered.
Data at 14:00 GMT undershot: Conference Board confidence dropped to 81.9, the weakest since April 2014, and JOLTS openings fell to 7.079M vs 7.23M expected. Markets still price as many as four Fed hikes over 12 months. USD/CAD trades near 1.4198, USD/CHF near 0.8355, silver near $60.85, Bitcoin near $83,111 and Litecoin near $68.60. Next up: Fed speakers, US-Iran talks, quarter-end flows and Friday’s payrolls.
Snapshot: US session, 29 September 2026 (~12:30 ET / 16:30 GMT)Top Stories Moving the Market
Long bond hits its highest since 2002 as oil-driven inflation fears persist
The yield touched 5.613% while the 10-year traded near 5.27%. Markets price as many as four Fed hikes over 12 months after the September increase.
Consumer confidence falls to its lowest since April 2014; JOLTS misses
The Conference Board index dropped 6.7 points and present business conditions turned negative for the first time since Sep 2024. JOLTS openings fell to 7.079M vs 7.23M expected.
Oil slides as Saudi pipeline flows recover, but US-Iran talks stay stuck
Brent fell to about $103.6. Yanbu flows are near 3.5m bpd of 7m capacity, while Trump signals a deal may wait until after the midterms.
Wall Street slips as tech gives back early gains
The S&P 500 traded lower after Monday’s 0.8% drop to 7,683.69. Carnival jumped about 11.7% on earnings, FICO fell about 21.6% and Oura delayed its IPO.
Technical Summary
USD/CAD
FX · Dollar bid on Fed-hike bets; US import ban adds to CAD pressureThe pair trades well above its 20-day EMA with the DXY near 101.35 and markets pricing further Fed hikes. A US ban on about $1bn of Canadian imports took effect today and lower crude is a small CAD drag. A hold above 1.4150 keeps 1.4235 and 1.4290 in view; a slip under 1.4090 would signal fading dollar momentum.
| Resistance | Support |
|---|---|
| R11.4235 | S11.4150 |
| R21.4290 | S21.4090 |
| R31.4350 | S31.4016 |
USD/CHF
FX · Franc weakens as yields rise; SNB seen on hold at 0%USD/CHF rallied about 4% since late August and sits at 16-month highs despite a six-year-high KOF indicator (109.1). The franc is a popular carry-funding currency with the SNB at 0%. A clean break of 0.8340 opens 0.8375 and 0.8400, but RSI is stretched and a pullback to 0.8300 is possible after today’s weak US data.
| Resistance | Support |
|---|---|
| R10.8340 | S10.8300 |
| R20.8375 | S20.8263 |
| R30.8400 | S30.8200 |
Silver (XAG/USD)
Metals · Below the H&S neckline as yields and dollar climbSilver fell about 5% on Monday and is heading for roughly an 8.5% loss in September after breaking a head-and-shoulders neckline near $62.20. It trades under its 50-, 100- and 200-day averages ($63.88, $65.65, $73.19). Oversold RSI invites short-covering bounces toward $61.80, which would be a fade area; a break of $60.30 exposes $59.40.
| Resistance | Support |
|---|---|
| R1$61.80 | S1$60.30 |
| R2$62.20 | S2$59.40 |
| R3$63.88 | S3$58.00 |

Crude Oil (WTI)
Energy · Saudi pipeline flows recover; US-Iran talks stalledWTI reversed lower as Saudi flows through the East-West pipeline recovered to about 3.5m bpd and Hormuz flows reached roughly 77% of pre-war levels (Kpler). Trump has said a deal may come after the midterms, so downside is not one-way. Below $92.60 the bias is lower toward $90.00; an Iran headline can spike prices quickly. Brent trades near $103.6.
| Resistance | Support |
|---|---|
| R1$92.60 | S1$90.00 |
| R2$93.60 | S2$88.50 |
| R3$95.00 | S3$86.50 |

Nasdaq 100
Equities · Early tech bounce fades under record-high yieldsThe index gave back an early gain as the 30-year yield hit 5.61% and confidence data disappointed. Monday’s futures range was 30,357-30,898 with value area 30,537-30,717. Below 30,640 sellers target Monday’s low at 30,357 and then 30,100; a move above 30,720 would neutralise the bearish read. AI-safety headlines and a White House AI lunch add event risk.
| Resistance | Support |
|---|---|
| R130,640 | S130,357 |
| R230,717 | S230,100 |
| R330,898 | S329,850 |

US 30Y Treasury Yield
Rates · Long bond at its highest in over two decadesThe 30-year yield has risen six straight sessions on oil-driven inflation fears and heavy corporate-debt supply, with the 10-year near 5.27% and the 2-year at 4.92%. Weak JOLTS and confidence only briefly slowed the sell-off. Holding above 5.56% keeps 5.61% and 5.65% in play; a close under 5.52% would show exhaustion. Higher yields mean lower bond prices.
| Resistance | Support |
|---|---|
| R15.61% | S15.56% |
| R25.65% | S25.52% |
| R35.70% | S35.45% |

Bitcoin (BTC/USD)
Crypto · Holding above $82,500 as ETF inflows meet yield pressureBitcoin bounced from Monday’s $82,500 low and sits above the $82,800 double-bottom neckline noted by Fidelity’s Timmer, with ETF inflows of $2.4bn last week. Rising yields and weak US data cap momentum. A hold above $83,000 targets $85,000 and $87,500; a daily close under $82,000 would reopen the breakout failure.
| Resistance | Support |
|---|---|
| R1$85,000 | S1$83,000 |
| R2$87,500 | S2$82,500 |
| R3$90,000 | S3$82,000 |

Litecoin (LTC/USD)
Crypto · Consolidating after a ~30% weekly surgeLTC rolled over from $72.50 and trades under the $69.37 pivot with open interest up 9%. Bulls need to reclaim $71.72 to target $75-$80; a failure risks a mean-reversion to the $60-$62 breakout zone. Momentum has flattened and the upper Bollinger Band sits near $75.91, so size risk carefully.
| Resistance | Support |
|---|---|
| R1$69.37 | S1$65.00 |
| R2$71.72 | S2$62.00 |
| R3$75.00 | S3$60.00 |

What to Expect from the Next Session
- Treasury yields. A close above 5.61% on the 30-year would extend the two-decade high and pressure the Nasdaq 100, silver and crypto; a reversal below 5.52% would ease the squeeze.
- US-Iran talks. Progress on Hormuz could push WTI toward $88.50; a stalemate keeps $92-$93 as resistance.
- AI event risk. Headlines from the White House AI lunch and the Anthropic IPO leak could swing tech sentiment in Asia and Europe.
- Quarter-end and payrolls. Rebalancing on 30 Sep, then Friday’s NFP and Eurozone CPI decide whether hike bets grow.
What Is Moving the Market
Bond rout and Fed hikes
The 30-year yield reached 5.613% and the 10-year is near 5.27%, both multi-year highs. The Fed raised rates 25bp in September and futures price up to four more hikes in 12 months, with roughly 70% odds for October.
Soft data, sticky inflation
Confidence at 81.9 and JOLTS at 7.079M point to cooling demand, yet energy costs keep inflation fears alive. Traders now lean on Friday’s payrolls to judge whether the Fed can keep tightening.
Oil, Hormuz and the talks
Qatari mediators held separate indirect talks with the US and Iran. Saudi exports are recovering, but Iranian officials reportedly doubt a deal before November, leaving oil headline-driven.
AI headlines and risk assets
Reuters reported details of a leaked Anthropic IPO prospectus (not yet filed) and the WSJ said OpenAI shelved a model over safety tests. AI executives lunch with Trump today; Nvidia announced a $150bn buyback and AMD agreed to buy World Labs for $8.2bn.
Economic Calendar / Events
| Time (GMT) | Country | Event | Forecast vs. Actual |
|---|---|---|---|
| 13:00 | US | S&P/Case-Shiller 20-City HPI (Jul) | Actual +2.5% y/y, +0.3% m/m |
| 14:00 | US | JOLTS Job Openings (Aug) | Actual 7.079M vs 7.23M fcst, prev 7.335M (rev.) |
| 14:00 | US | CB Consumer Confidence (Sep) | Actual 81.9 vs ~89-90 fcst, prev 88.6 (rev.) |
| Session | US | Remarks from six Fed officials | No forecast; tone on further hikes |
| Afternoon ET | US | Trump lunch with AI executives at the White House | AI regulation and safety headlines |
| Session | US/IR | Qatar-mediated indirect US-Iran talks | Hormuz reopening; oil headline risk |
| Wed 30 Sep | Global | Month- and quarter-end flows | Rebalancing can distort yields and equities |
| Fri | US/EU | US non-farm payrolls; Eurozone flash CPI | Key for Fed and ECB hike bets |
Summary
The US session is defined by a bond market pushing the 30-year yield to a two-decade high near 5.61% while consumer confidence and job openings weaken. USD/CAD sits near 1.4198 and USD/CHF near 0.8355 under a firm dollar, silver trades near $60.85, WTI near $90.75, the Nasdaq 100 near 30,500, Bitcoin near $83,111 and Litecoin near $68.60. Watch yields, US-Iran headlines, quarter-end flows and Friday’s payrolls.
FAQ
Q:Why is the 30-year yield at a two-decade high?
A:Oil-driven inflation fears, expectations of more Fed hikes and heavy corporate-debt supply have pushed it to 5.613%. Outlets differ on whether it is the highest since 2002 or 2004.
Q:Why did consumer confidence matter today?
A:The index fell to 81.9 from 88.6, the weakest since April 2014, while JOLTS also missed. It raises growth worries even as inflation risks keep hike bets alive.
Q:What is driving USD/CHF to 0.8355?
A:A firm dollar backed by yields and the franc’s role as a low-rate funding currency. Watch 0.8340 for a breakout and 0.8300 for support.
Q:What could move oil next?
A:Any US-Iran breakthrough, Saudi export recovery and Hormuz shipping data. Lower flows risk would pull WTI toward $88.50, while a breakdown of talks could lift it back above $93.