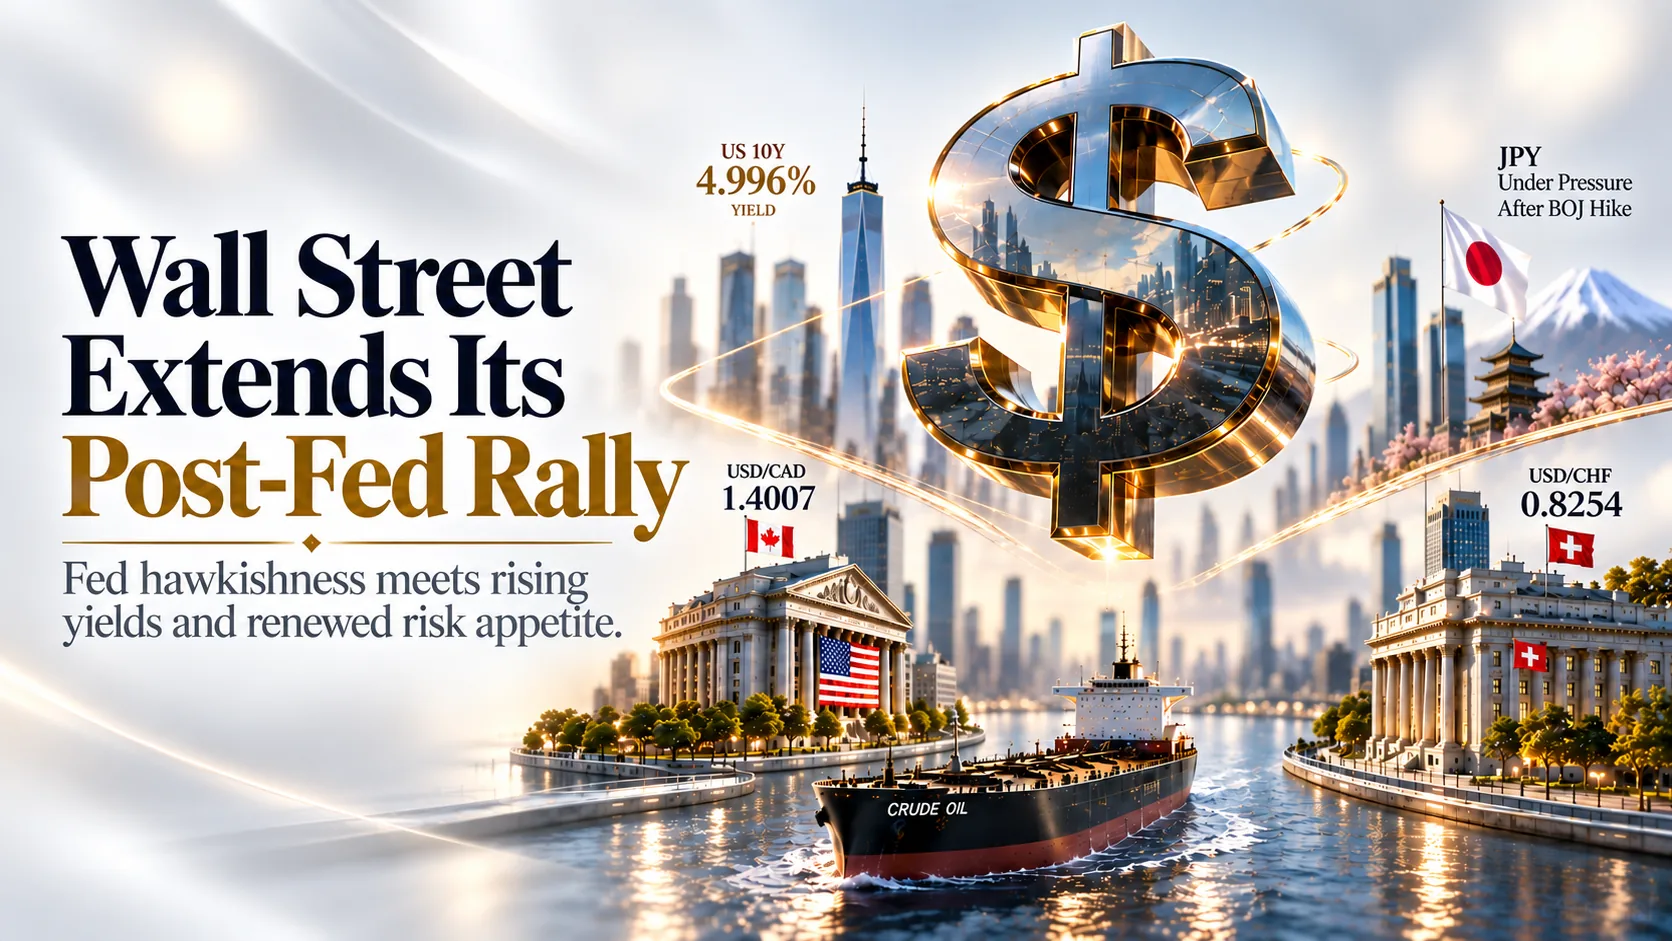
Wall Street Extends Its Post-Fed Rally as Yields Push Toward 5% and Bitcoin Roars Back Above $80,000 | Technical Analysis – US Session | 18 September 2026
Wall Street Slips as the 10-Year Yield Breaks Back Above 5% on Hawkish Bowman Remarks, While Bitcoin Holds Firm Above $80,000
USD/CAD · USD/CHF · Gold · Crude Oil · S&P 500 · US 10Y · BTC/USD · XRP/USD — live U.S. market outlook today, updated through the New York close
U.S. Market News — Live Update, 18 September 2026
Top-moving headlines shaping the U.S. market outlook today, cross-checked against Reuters, Investing.com and Bloomberg through the New York close
Fed Delivers First Rate Hike Since 2023, Unanimous 12-0 Vote Lifts Rates to 3.75%-4.00%
Wednesday’s FOMC decision, chaired by Kevin Warsh, raised the federal funds rate by 25 basis points in a unanimous vote, the first increase in more than three years. The updated dot plot showed 16 of 18 officials expecting at least one more hike before year-end. Warsh cited resilient growth, a solid labor market and still-elevated inflation as the basis for a “firm, unanimous decision.”
Central BanksS&P 500 Closes Lower as Rising Yields Snap Wall Street’s Post-Fed Rally; Buffett Steps Down as Berkshire Chair
The S&P 500 and Nasdaq 100 posted their best day since early August on Thursday, but Friday’s gains reversed as the 10-year yield’s push back above 5% pressured more than 350 S&P 500 members; the index closed near 7,620.74, down about 0.22%, while the Dow fell roughly 0.38%. Chip stocks were a bright spot on a bullish Nvidia-driven outlook that lifted Samsung and SK Hynix. Separately, Warren Buffett confirmed he is stepping down as Berkshire Hathaway’s chairman, a headline Wall Street is treating as “the end of an era” rather than a market-moving event.
EquitiesTreasury Yields Break Back Above 5% as Bowman’s Hawkish Remarks Reinforce the Fed’s “One More Hike” Signal
The U.S. 10-year Treasury yield has climbed back above the 5% level, last around 5.00%-5.03%, its highest since 2007, after Fed Governor Michelle Bowman said inflation will remain elevated for some time and that rate cuts are not yet appropriate. The median FOMC projection points to the fed funds rate ending 2026 at 4.1%, implying one further quarter-point hike before year-end and no cuts in 2027; the yield move has weighed on equities into the close.
Rates & BondsCrude Oil Falls for a Third Session as Saudi Pipeline Restoration Eases Supply Fears
WTI crude has slipped to around $95.90 a barrel, down roughly 0.6%-1.3% on the day, while Brent fell about 1.6% to near $103.17, as Saudi Arabia targets recovery of about half its East-West pipeline capacity within days and full restoration within six weeks, on top of rerouting cargoes to Asian refiners via Oman. The unresolved Strait of Hormuz standoff with Iran remains a latent geopolitical risk, but easing Saudi supply concerns are the dominant driver into the close.
CommoditiesBitcoin Tops $80,000 as SEC’s Tokenized-Stock Exemption and CFTC Framework Offset CLARITY Act Setback
Bitcoin has climbed back above $80,000, well off its session low near $76,200-$76,350, as traders look past last week’s failed 49-50 Senate cloture vote on the Digital Asset Market CLARITY Act. Fresh regulatory tailwinds are helping: the SEC’s five-year exemption for tokenized-stock trading lifted Coinbase, Circle and Robinhood, while the CFTC has sent a proposed crypto market-structure framework to the White House for review. XRP is riding the same wave, up toward $1.38-$1.39 and testing the $1.40 resistance zone.
CryptoUpdated through the New York close · 18 September 2026
U.S. Economic Calendar — Today’s Key Events
Key releases and events shaping price action through the New York session (times ET unless noted)
| Time (ET) | Event | Forecast / Detail | Impact | Market Read |
|---|---|---|---|---|
| 🇺🇸Wednesday (passed) | Fed Interest Rate Decision | Hiked 25bp to 3.75%-4.00%; unanimous 12-0 vote | 🔴 CRITICAL | Dot plot signals one more hike in 2026; keeps yields and the Dollar underpinned into Friday |
| 🇯🇵03:00 ET (passed, overnight) | Bank of Japan Rate Decision | Hiked 25bp to 1.25%, a 31-year high; split 7-2 vote | 🔴 CRITICAL | Yen weakness helps keep the broader Dollar Index bid into the U.S. open |
| 🇺🇸09:15 ET | Industrial Production & Capacity Utilization (Aug) | Cons. +0.3% MoM / 76.4% utilization | 🟢 MEDIUM | Gauge of factory-sector momentum after the Fed’s hike; feeds the “resilient economy” narrative |
| 🇺🇸09:15 ET | Manufacturing Production (Aug) | Cons. +0.3% MoM vs. +0.2% prior | 🟢 MEDIUM | Supports Warsh’s case that growth can absorb tighter policy |
| 🇺🇸10:00 ET | Conference Board Leading Economic Index (Aug) | Cons. +0.1% MoM vs. +0.2% prior | ⚪ LOW | A soft print would reinforce debate over how much further the Fed tightens this year |
| 🇺🇸Passed | FOMC Member Bowman Speaks | Said inflation will stay elevated for some time; rate cuts not yet appropriate | 🔴 HIGH | Reinforced the hawkish dot plot, pushed the 10-year yield back above 5% and weighed on stocks |
| 🇺🇸13:00 ET | Baker Hughes U.S. Rig Count (Weekly) | Prev. 450 oil rigs / 591 total rigs | ⚪ LOW | Read-through for U.S. supply growth against the Saudi-driven crude glut |
| 🌈Ongoing | Saudi East-West Pipeline Restoration / Hormuz Standoff | Saudi targets ~50% pipeline capacity restored within days, full within six weeks; Hormuz standoff with Iran unresolved | 🟢 MEDIUM | Easing supply fears are the dominant driver pressuring Crude Oil lower; Hormuz remains a latent geopolitical floor |
U.S. Session Trade Ideas — USD/CAD, Gold, BTC/USD and More
Technical setups and fundamental context across the session’s eight key instruments
USD/CAD
Why This Setup
Wednesday’s hawkish Fed hike, Friday’s follow-up from Governor Bowman, and the broad post-BOJ Dollar bid keep USD/CAD pinned near a roughly one-month high, even as a widening Fed-BoC rate divergence does the heavier lifting. A genuine two-way risk sits in any recovery in oil prices, which have instead been easing on Saudi pipeline-restoration headlines, but rate-differential support for the Dollar remains the dominant driver into the close.

USD/CHF
Why This Setup
The Swiss National Bank’s decision to hold its policy rate at 0% at its September quarterly meeting removes a source of CHF support just as the Fed’s hawkish hike, reinforced by Bowman’s Friday remarks, keeps the Dollar broadly bid and the 10-year yield above 5%. A resurgence in safe-haven demand tied to the still-unresolved Hormuz standoff is the main two-way risk that could cap upside.

Gold
Why This Setup
Gold is giving back part of its overnight gain as the firmer Dollar and a 10-year yield that has now broken above 5% weigh on the non-yielding metal, though the unresolved Strait of Hormuz standoff and a lingering geopolitical risk premium keep dip demand intact even as the dominant oil-supply narrative has turned bearish for crude. A genuine two-way risk is a further leg higher in yields if next week’s U.S. data surprises to the upside.

Crude Oil (WTI)
Why This Setup
Saudi Arabia’s pipeline-restoration progress and its continued rerouting of extra cargoes to Asian refiners via Oman are a genuine headwind for prices, now the dominant driver behind crude’s third straight lower session. The unresolved Strait of Hormuz standoff with Iran remains a real source of two-way risk that could spark a spike higher on any fresh escalation headline, even though it is not currently setting the tone.

S&P 500
Why This Setup
An AI-and-chip-led rally and a resilient economy per Warsh’s own remarks remain a genuine tailwind for dip-buyers, though a 10-year yield that has now broken decisively above 5% on Bowman’s hawkish comments is a real source of two-way risk that pressured more than 350 index members into Friday’s close and could extend into next week.

US 10Y Treasury Yield
Why This Setup
Wednesday’s hawkish dot plot, the median official’s 4.1% year-end fed funds projection, and Friday’s reinforcing remarks from Governor Bowman are a genuine tailwind that has already pushed yields above the 5% level, though a level this close to a full percentage point above February’s low increases the odds of profit-taking on soft U.S. data, a real source of two-way risk into next week.

BTC/USD
Why This Setup
Traders looking past last week’s failed CLARITY Act cloture vote, helped by fresh regulatory tailwinds from the SEC’s tokenized-stock exemption and the CFTC’s framework review, are a genuine tailwind for the sharp bounce off the $76,200-$76,350 area, though the CLARITY Act’s failure itself means underlying regulatory uncertainty for U.S. crypto market structure remains a real source of two-way risk that could resurface quickly.

XRP/USD
Why This Setup
A broad crypto-market bounce and renewed risk appetite alongside Bitcoin’s sharp recovery, plus incremental regulatory progress from the SEC and CFTC, are a genuine tailwind as XRP retests the $1.40 resistance zone, though the CLARITY Act’s failure to advance in the Senate remains a real source of two-way risk for anything tied to U.S. regulatory clarity on digital assets.

U.S. Session FAQ — 18 September 2026
Quick answers to the most common questions traders are asking this session
Why are Treasury yields rising after the Fed already hiked rates?
Why is Bitcoin back above $80,000 today?
Why is Crude Oil falling even with the Hormuz standoff unresolved?
Why is USD/CAD near a 12-day high while oil is rebounding?
What should traders watch heading into next week?
U.S. Session Summary — Friday, 18 September 2026 (Live Update)
Friday’s U.S. session was shaped by the lingering aftermath of Wednesday’s Fed rate hike, hawkish follow-up remarks from Fed Governor Michelle Bowman, an overnight jolt from the Bank of Japan, and a sharp risk-on move across crypto markets. The Federal Reserve, under Chair Kevin Warsh, unanimously raised the federal funds rate by 25 basis points to a range of 3.75%-4.00% on Wednesday, the first hike since July 2023, with the updated dot plot signaling one more increase before year-end. Bowman’s comments that inflation will stay elevated and that cuts are not yet appropriate reinforced that hawkish backdrop, and combined with the Bank of Japan’s overnight hike to a 31-year high of 1.25%, kept the broader Dollar bid and pushed the U.S. 10-year Treasury yield back above the psychologically important 5% level, to around 5.00%-5.03%, its highest since 2007.
Equity and commodity markets traded a genuine push-pull. The S&P 500 closed near 7,620.74, down about 0.22%, with the Dow off roughly 0.38% and the Nasdaq down about 0.16%, as rising yields pressured more than 350 index members even though chip stocks stayed firm on a bullish Nvidia-driven outlook. Crude Oil (WTI) fell for a third straight session to around $95.90 as Saudi Arabia’s East-West pipeline restoration progress and continued rerouting of cargoes to Asia eased supply concerns, though the unresolved Strait of Hormuz standoff remains a latent risk. Gold eased back from a session high near $4,419-$4,440 to trade near $4,360-$4,385 as the firmer Dollar and rising yields offset safe-haven demand. In FX, USD/CAD trades near a roughly one-month high of 1.4005-1.4007 and USD/CHF holds near 0.8242-0.8254 after the SNB’s September hold at 0%, both underpinned by broad Dollar strength. In crypto, BTC/USD has climbed back above $80,000 and XRP/USD has advanced toward $1.38-$1.39, as both majors extend a sharp rebound from last week’s CLARITY Act-driven selloff, helped by the SEC’s new tokenized-stock exemption and a CFTC framework sent to the White House for review. Separately, Warren Buffett confirmed he is stepping down as Berkshire Hathaway’s chairman, a notable headline that did not materially move the broader tape.
Highest-conviction session idea: fade sharp rallies in the 10-year yield back toward 5.05%-5.10% given the risk of profit-taking on soft U.S. data even after Bowman’s hawkish push, while staying long USD/CAD and USD/CHF dips as broad Dollar strength and Fed-BoC/SNB rate divergence remain the dominant cross-asset drivers; treat Crude Oil rallies as a fade given the Saudi pipeline-restoration headwind, but respect the Hormuz-driven two-way risk as a latent tail risk; and treat the bounce in BTC/USD and XRP/USD as a genuine risk-on move, now reinforced by incremental regulatory progress (the SEC’s tokenized-stock exemption, the CFTC’s framework review) rather than a full structural resolution of U.S. crypto regulatory uncertainty.
For the individual instruments: USD/CAD buy dips toward 1.3960, stop 1.3910, target 1.4090 — broad Dollar strength is a genuine tailwind, though oil’s rebound is a real source of two-way risk. USD/CHF buy dips toward 0.8220, stop 0.8180, target 0.8320 — the SNB’s hold at 0% is a genuine tailwind, though Hormuz-driven safe-haven flows are a real source of two-way risk. Gold buy dips toward 4,360, stop 4,310, target 4,460 — the Hormuz risk premium is a genuine tailwind, though rising yields and a firmer Dollar are a real source of two-way risk. Crude Oil sell rallies toward 104.50, stop 106.50, target 99.50 — extra Saudi supply to Asia is a genuine headwind, though the unresolved Hormuz standoff is a real source of two-way risk. S&P 500 buy dips toward 7,560, stop 7,480, target 7,750 — the AI-led rally is a genuine tailwind, though rising yields are a real source of two-way risk. US 10Y sell yield rallies toward 5.05%, stop 5.15%, target 4.80% — the hawkish dot plot is a genuine tailwind for yields, though profit-taking risk on soft data is a real source of two-way risk. BTC/USD buy dips toward 77,500, stop 74,000, target 86,000 — a fading CLARITY Act shock is a genuine tailwind, though the bill’s failure keeps regulatory uncertainty as a real source of two-way risk. XRP/USD buy dips toward 1.29, stop 1.22, target 1.50 — the retest of former support as resistance is a genuine tailwind, though the CLARITY Act’s failure is a real source of two-way risk. The decisive variable heading into next week is whether the 10-year yield holds above 5% after Bowman’s hawkish remarks or fades back below it, and whether further Fed commentary confirms or walks back Wednesday’s dot plot. Size positions accordingly, and note that fast-moving Fed and geopolitical headlines carry genuine event risk that could exaggerate moves in either direction.
Ready to act on today’s setups? Open an Account with Capital Street FX and trade every instrument covered in this report on our Zero Account‘s 0.0 Pips Spreads and 1:10000 Leverage, across 2000+ Instruments, with a welcome deposit bonus and 24/7 Live Support on hand for every session.
Not sure which account fits your style? Compare our Account Types side by side with our Account Comparison tool, browse current Promotions / Bonus offers, and trade from our Trading Platform suite. Funding is simple via our Deposit & Withdrawal options. For ongoing coverage, explore our Forex Analysis Pages, Commodity Analysis Pages and Crypto Analysis Pages, plus our Daily Market Analysis and Weekly Market Analysis reports and the full Economic Calendar. New to trading? Visit our Trading Education / Blog, or reach our Contact Us / Live Support team any time.
Access Live U.S. Markets →