Market Outlook on BP PLC Today: Technical Summary, Fundamental News and a Trade Setup With Entry, Stop Loss and Take Profit | 16-09-2026
Market Outlook on BP PLC Today: Technical Summary, Fundamental News and a Trade Setup With Entry, Stop Loss and Take Profit
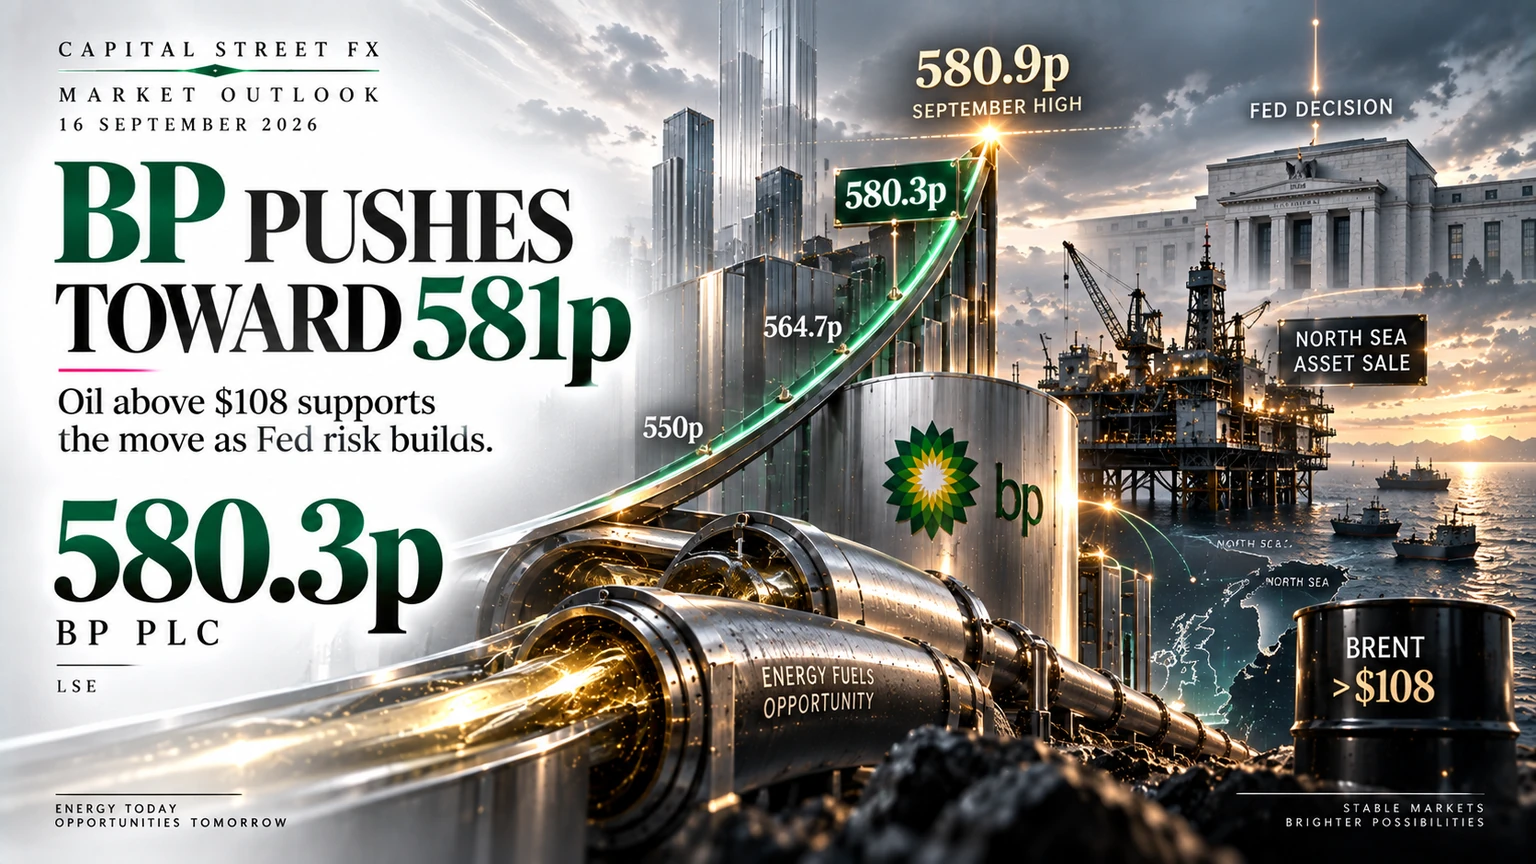
BP PLC trades at 580.3p, up 1.59% on the day, pressing the 580.9p swing high as Brent above $108 and a crowded North Sea auction meet a Federal Reserve decision this afternoon.
The market outlook on BP PLC for the next 24 hours starts with an unusually clean technical picture. The BP share price has climbed from a July low near 450p in a series of higher lows along a rising trendline, and at 580.3p it is now testing the zero point of that Fibonacci grid at 580.9p. BP trades above its short-term moving average at 544.4p and above the deeper averages at 531.1p and 529.8p, a stacked configuration that is what an intact uptrend looks like on a daily chart. The daily RSI at 70.49, running well ahead of its signal line at 57.46, is the one caution flag: momentum is strong, but it is stretched, and the same reading marked the March 2026 top near 604p.
The fundamental backdrop behind that chart is doing real work. Brent crude is holding above $108 a barrel after Saudi Arabia shut its East-West pipeline following attacks launched from Iraqi territory, removing an alternative route for roughly 7 million barrels a day around a Strait of Hormuz already constrained by an Iranian blockade on tankers, while Libya has suspended several fields and warned of force majeure. BP’s second-quarter profit more than doubled, net debt has come down to about $22.3 billion, the dividend has been raised, and the UK North Sea portfolio put on the block in July has drawn interest from Adura, NEO Next+, EnQuest, Harbour Energy, Ithaca Energy, Serica Energy and Var Energi. Goldman Sachs now carries a 700p target on BP shares and Morgan Stanley 598p, against BofA at 500p. Against that, the Federal Reserve announces at 2:00 PM ET today with a quarter-point hike to 3.75%-4.00% roughly 86% to 92% priced, the 10-year Treasury yield has touched a 19-year high above 5.04%, and the Bank of England follows on Thursday — which is why this BP outlook is built around defined levels rather than a directional bet into two central bank meetings inside 24 hours.
Fundamental News Set to Impact the BP Share Price Next
The stories driving today’s BP move and shaping the outlook for the next 24 hours
BP PLC Technical Summary and Chart Analysis for Today
Daily structure, Fibonacci levels, moving averages and RSI as of 16 September 2026

The technical summary for BP PLC today shows a share price working at the very top of its recent range. BP is at 580.3p after opening at 570.3p and trading between 564.7p and 580.3p, a 15.6p session range that is wide by BP’s own standards and tells you the tape is active rather than drifting. The Fibonacci grid on the daily chart is measured from the July base near 449.95p up to the swing high at 580.9p, and price is sitting flush against that zero line. Everything between 550.0p, the 23.6% retracement, and 580.9p has been reclaimed, which is the definition of a market that has worked through its supply.
The moving average configuration reinforces that read. BP trades above the short-term average at 544.4p and above the two deeper averages at 531.1p and 529.8p, and those deeper averages flattened out and turned up through August rather than continuing to roll over. The rising trendline drawn from the early-July low now sits in the mid-550s and has caught three separate pullbacks since, most recently in early September, which makes the 550p to 556p band the first place a disciplined buyer looks on weakness. The RSI is the counterweight: at 70.49 against a 57.46 signal line, momentum has pushed into overbought territory for the first time since the March 2026 peak near 604p, and while an overbought RSI inside a trend is more often a continuation signal than a reversal signal, it does mean the reward for chasing an intraday spike at 580p is thin. That is why the BP trade setup below is built around a confirmed daily close above 581.5p or a patient pullback entry, rather than a market order at the high.
BP PLC Technical Levels at a Glance · Next 24 Hours
- Resistance 1: 580.9p — the September swing high and the zero point of the Fibonacci grid
- Resistance 2: 598p to 604.1p — the Morgan Stanley target and the March 2026 swing high
- Resistance 3: 620p — the next round-number objective above the March peak
- Support 1: 564.7p — today’s session low
- Support 2: 550.0p — the 23.6% retracement, with the rising trendline just beneath
- Support 3: 544.4p to 529.8p — the moving average cluster and the 38.2% retracement at 530.9p
- Pivot zone: 556p to 568p — where a pullback entry is favoured if BP rotates back inside the range
- Momentum: RSI 70.49 versus signal 57.46 — stretched, arguing for confirmed closes over intraday chasing
Calendar — Events That Can Move BP PLC in the Next 24 Hours
Key releases, central bank decisions and company events shaping the BP outlook over the coming 24 hours
| Date / Time | Event | Detail | Impact |
|---|---|---|---|
| Today 16 Sep, 2:00 PM ET | Federal Reserve Rate Decision and Dot Plot | A 25 basis point hike to 3.75%-4.00% is roughly 86% to 92% priced. The BP reaction will come from the Summary of Economic Projections and the tone on inflation, which drive the dollar, real yields and the discount rate applied to energy cash flows | HIGH |
| Today 16 Sep, 2:30 PM ET | Chair Kevin Warsh Press Conference | The press conference has repeatedly been the larger mover this cycle. Guidance on whether this is a one-off insurance hike or the start of a sequence sets the dollar path for the rest of the week and with it the sterling-denominated BP share price | HIGH |
| Today 16 Sep, 10:30 AM ET | EIA Weekly Petroleum Status Report | Crude, gasoline and distillate inventories plus refinery utilisation. With the US SPR near record lows and Middle East flows disrupted, a larger-than-expected crude draw would extend the Brent bid that has been carrying BP shares higher | MEDIUM |
| Next 24 hours Unscheduled | Saudi East-West Pipeline and Libya Headlines | The shut Saudi pipeline removed an alternative export route around the Strait of Hormuz and repairs may take weeks. Confirmation of a restart would deflate part of the crude risk premium and weigh on BP; a further Libyan force majeure would do the opposite | HIGH |
| Tomorrow 17 Sep, 12:00 BST | Bank of England Rate Decision | Sterling strength or weakness feeds straight into BP’s pence quote on the LSE. A hawkish Bank of England lifts the pound and mechanically caps the BP share price in London even if the dollar value of the business is unchanged | MEDIUM |
| Next 24 hours Unscheduled | North Sea Sale Process Headlines | Any leak on indicative bids, valuation or a shortlist from Adura, NEO Next+, EnQuest, Harbour, Ithaca, Serica or Var Energi is capable of moving BP shares several percent inside a single session | MEDIUM |
| Ongoing Session | Test of the 580.9p Swing High | Whether BP can close above 580.9p and convert the top of the September range into support, or fails and rotates back toward 564.7p and 550p, is the single biggest technical swing factor for the next 24 hours | HIGH |
| Ongoing Session | FTSE 100 and Global Risk Appetite | The 10-year Treasury yield has touched a 19-year high above 5.04%. Broad de-risking in equities would pull BP down with the index regardless of where crude trades, a persistent if indirect driver | LOW |
Two central bank decisions inside 24 hours is an unusual amount of scheduled risk for a single-stock outlook, and it is the defining feature of this BP session. The Federal Reserve sets the dollar and the real yield curve that price BP’s dollar-denominated cash flows; the Bank of England sets the sterling rate at which those cash flows are quoted in pence on the London Stock Exchange. A trader holding BP through both is taking currency risk and rates risk on top of the oil and company-specific risk the position was opened for.
BP PLC Trade Setup for the Next 24 Hours: Entry, Stop Loss and Take Profit
BP PLC (LON: BP.) · 580.3p • PRESSING THE TOP OF THE SEPTEMBER RANGE — Buy a Confirmed Close Above 581.5p or a Pullback Into 556p–568p, Target the 598p–620p Zone
BP PLC · BP. / London Stock Exchange
Technical Summary (Next 24 Hours)
BP is at 580.3p after a 564.7p to 580.3p session, closing on the 580.9p swing high with every daily moving average beneath it. A confirmed daily close above 581.5p converts the top of the September range into support and opens 598p and the 604p March high. Failure at 580.9p does not break the trend; it simply rotates BP back toward 564.7p and the 550p to 556p trendline band, which is where the second entry sits.
Fundamental Driver
Brent above $108 on Saudi pipeline and Libyan supply disruption is lifting BP’s upstream realisations, while a competitive North Sea auction and a 700p Goldman Sachs target add company-specific support. Against that, the Fed decides at 2:00 PM ET today and the Bank of England on Thursday, so the crude bid and the rates and currency backdrop are pulling in opposite directions inside the same 24 hours.
Risk Management
Risk on the breakout entry is roughly 38.5p against 16.5p to 38.5p of reward to the staged targets, which is a modest one-to-one at TP1 and improves to roughly one-to-one at TP3; the pullback entry at 556p to 568p carries the same 543p stop for materially less risk and a better profile, which is why it is the preferred expression. With an RSI at 70.49 and two central bank decisions inside the window, size conservatively, consider taking part of the position off at 598p, and treat a daily close below 543.0p as the point at which the idea is done rather than an invitation to average down.

There are two clean ways to express this BP idea. The breakout version waits for a daily close above 581.5p, which confirms that the 580.9p ceiling capping BP through the first half of September has finally given way, and accepts a higher entry price in exchange for that confirmation before pressing toward 598p and the 604.1p March high. The pullback version waits for BP to rotate back into 556p to 568p, just above the 23.6% retracement at 550.0p and the rising trendline from the July low, and offers a much better entry against the same 543.0p stop — at the cost of possibly never getting filled if the breakout comes first.
A few small things worth knowing before sizing a BP position today. BP reports in dollars but quotes in pence, so Thursday’s Bank of England decision changes the pence price mechanically even if nothing about the business changes. The share buyback that was paused in February 2026 to protect the balance sheet has not been restored, so a resumption announcement is an unpriced upside catalyst that could arrive with any trading update. The North Sea sale is an early-stage process with no guarantee any bidder proceeds, so treat leaked valuations as sentiment rather than fact. And the crude risk premium currently in the BP share price is geopolitical, which means it can leave as quickly as it arrived: a single credible headline about the Saudi East-West pipeline restarting would take several dollars out of Brent in a session and BP would follow.
FAQ: Today’s BP PLC Share Price, Technicals and Trade Setup
Common questions traders ask about BP on 16 September 2026
Conclusion: BP Presses the Range High Into a Federal Reserve Decision
BP PLC enters the next 24 hours at 580.3p, up 1.59% and pressing the 580.9p swing high with every daily moving average beneath it and a rising trendline from the July low intact. The fundamental case underneath that chart is the strongest it has been this year: Brent above $108 on genuine supply disruption, a doubled second-quarter profit, net debt down to roughly $22.3 billion, a raised dividend, a competitive auction for the North Sea portfolio and a 700p target from Goldman Sachs. The offsetting risks are all scheduled and all land inside the window — the Federal Reserve at 2:00 PM ET today, Chair Warsh half an hour later, and the Bank of England on Thursday — with an RSI at 70.49 saying the advance is stretched.
That combination argues for levels rather than conviction. A confirmed daily close above 581.5p is the trigger for continuation toward 598p and 604p; a rotation back into 556p to 568p is the better-priced entry against the same 543.0p stop; and a daily close below 543.0p is where this BP outlook stops being valid. Traders who size for two central bank decisions rather than one will have a considerably easier session than those who do not.
None of this is investment advice. BP PLC is a headline-sensitive, oil-linked equity, and today’s levels can shift quickly on Federal Reserve commentary, Middle East supply news or an unexpected update from the North Sea sale process. Always size positions to your own risk tolerance and confirm every level against a live feed before acting.