Market Outlook on Dow Jones Today: Technical Summary, Fundamental News and a Trade Setup With Entry, Stop Loss and Take Profit | 07-10-2026
Market Outlook on Dow Jones Today: Technical Summary, Fundamental News and a Trade Setup With Entry, Stop Loss and Take Profit
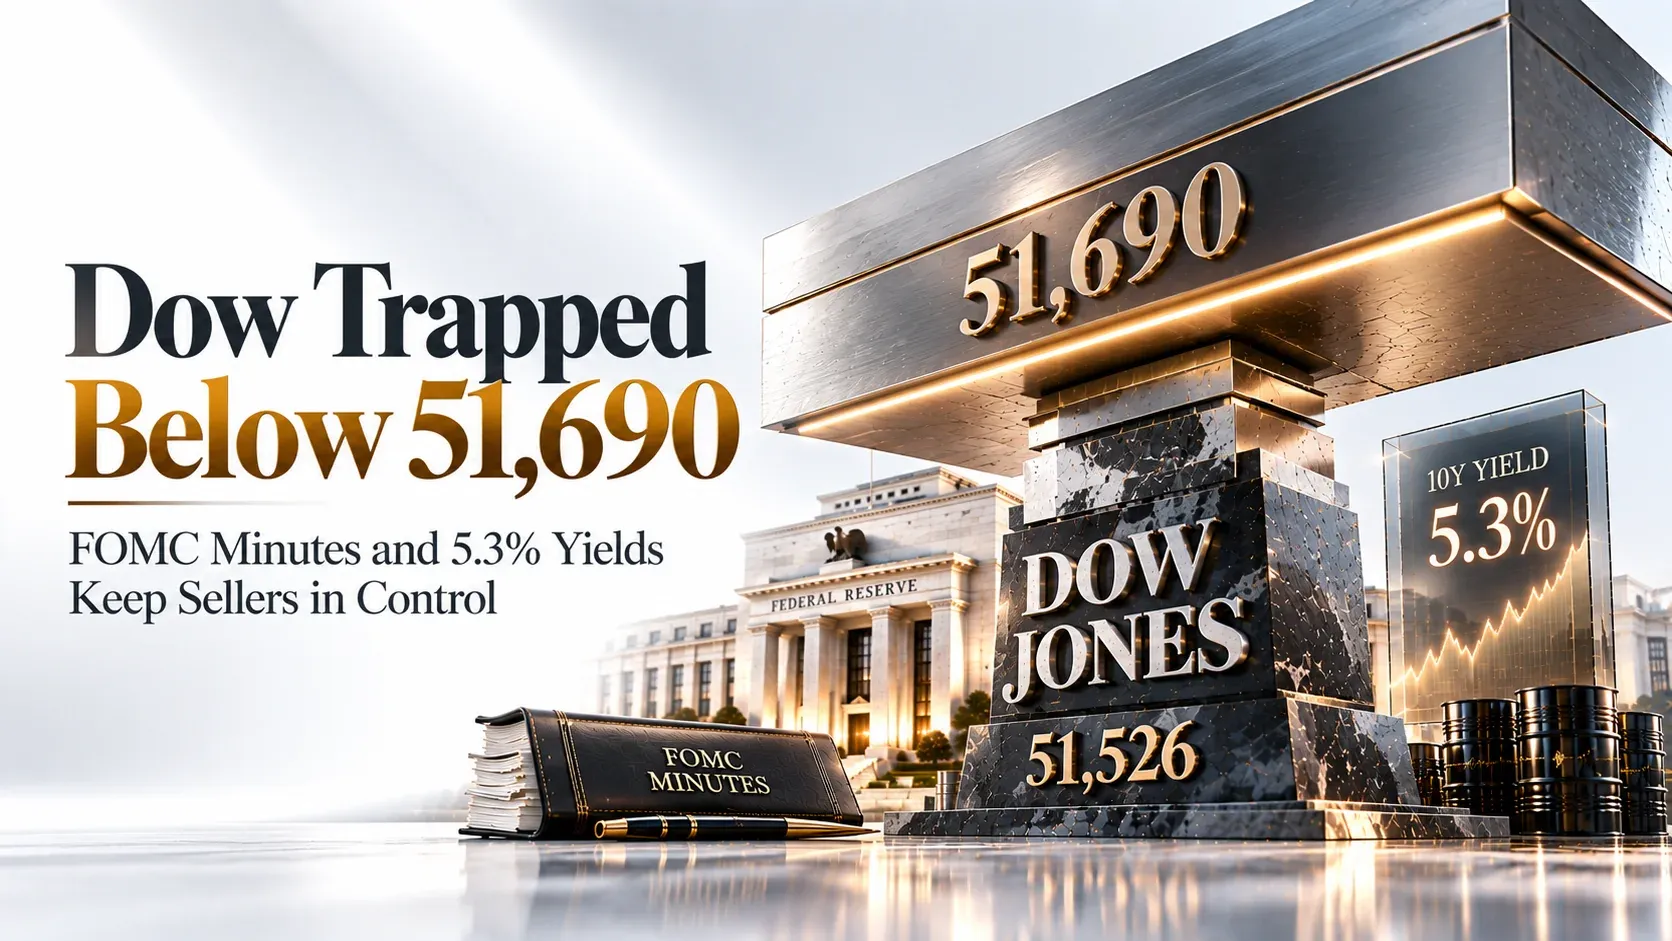
The Dow Jones is at 51,526 inside a symmetrical triangle, just under its 51,690 fast moving average, with a $39 billion 10-year auction and the FOMC minutes as the main event risks in the next 24 hours.
This Dow Jones market outlook is built for the next 24 hours only, from 13:35 IST on Wednesday 7 October to 13:35 IST on Thursday 8 October. That window covers the full New York session (19:00 to 01:30 IST) and the start of Asian trading on Thursday. Tuesday’s daily candle opened at 51,449.14, reached a high of 51,677.17, fell to 51,428.14 and closed at 51,526.14, so the high stopped just 12 points under the 51,689.67 fast moving average. Investing.com showed the US 30 contract near 51,403, about 0.23% lower, early on Wednesday.
The fundamental case is yields, the Federal Reserve and oil. The Fed raised rates by 25 basis points on 16 September to a 3.75%-4.00% range, its first increase in three years, and the minutes of that meeting are released at 23:30 IST. The 10-year Treasury yield is near 5.3%, its highest in more than two decades, a $39 billion 10-year auction is held at 22:30 IST and WTI crude is back above $90 after Saudi-Houthi attacks and a Gulf of Mexico storm. September payrolls rose only 29,000, which keeps the labour market in focus. The S&P 500 closed at a record 7,818.93 and the Nasdaq Composite at 27,599.79, while the Dow closed at 51,521.28 on the official count.
With the daily RSI at 44.62, above its 39.70 average but still under the 50 midline, and price below the 51,689.67 average, this Dow Jones trade setup favours selling a rally into 51,620-51,690 with a stop loss at 51,860 and take profit at 51,430, 51,150 and 51,000. The Dow Jones sits between a falling resistance line near 52,650 and a rising support line near 50,660, so a hawkish minutes release or a weak auction would favour the downside, while a close above 51,690 would cancel the idea.
Key Takeaways for the Next 24 Hours
- Bias: range-bound with a mild downside lean while the Dow Jones stays below the 51,689.67 fast moving average and inside the symmetrical triangle.
- Sell zone: 51,620-51,690. Stop loss: 51,860. Take profit: 51,430, 51,150, 51,000.
- Key resistance: 51,677-51,690, 52,096, 52,650-52,688. Key support: 51,428, 51,150, 51,000, 50,660.
- Main drivers: FOMC minutes, Treasury yields near 5.3%, the 10-year auction, oil near $90 WTI and $100 Brent, and the gap between a record Nasdaq and a lagging Dow.
- Event risk: EIA 20:00 IST, 10-year auction 22:30, FOMC minutes 23:30, Wall Street close 01:30 Thursday; Waller 14:00 and jobless claims 18:00 on Thursday fall just after the window.
Fundamental News Set to Impact This Dow Jones Market Outlook
The stories driving the next 24 hours
Dow Jones Technical Summary for the Next 24 Hours
Daily structure, symmetrical triangle, moving averages and RSI as of 7 October 2026 (log-scale chart)

The Dow Jones technical summary shows an index squeezed inside a symmetrical triangle. A falling resistance line from the early-August peak near 54,700 now sits near 52,650, and a rising support line from the late-March low near 45,150 now sits near 50,660 (both read from the chart). The Dow Jones fell about 7% from the peak to an early-October low near 50,600, where the rising line held, and has since recovered to 51,526. The yellow fast moving average at 51,689.67 capped Tuesday’s high at 51,677, and the slower averages at 52,095.64 and 52,688.45 sit above, with the 52,688.45 average meeting the falling triangle line.
Momentum is soft but turning. The daily RSI is 44.62 against its average of 39.70, which is above the average but below the 50 midline, so buyers have not yet taken control. For the next 24 hours the Dow Jones chart favours a 51,150 to 51,900 range with a mild downside lean: a rally into 51,620-51,690 is the preferred sell zone, a New York close above 51,690 opens 52,096 and 52,650, and a break below 51,428 puts 51,150, 51,000 and the 50,660 triangle floor back in play. Tuesday’s 249-point range is a fair guide to normal movement, but the minutes at 23:30 IST can double it.
Dow Jones Technical Levels at a Glance · Next 24 Hours
- Resistance 1: 51,677-51,690 — Tuesday’s high and the fast moving average (51,689.67)
- Resistance 2: 52,096 — slow moving average (52,095.64)
- Resistance 3: 52,650-52,688 — falling triangle line (read from chart) and the 52,688.45 average
- Support 1: 51,428 — Tuesday’s low
- Support 2: 51,150 — September swing lows (read from chart)
- Support 3: 51,000 — round number
- Support 4: 50,660 — rising triangle line (read from chart); early-October low near 50,600
- Indicator: RSI 44.62 vs average 39.70
- Note: levels are read from the chart and published data; confirm them on your own platform
Calendar — Events That Can Move the Dow Jones in the Next 24 Hours
Times in IST with US Eastern time alongside; marker numbers match the event markings on the charts in Sections 1 and 3
| Date / Time | Event | Detail | Chart Marker | Impact |
|---|---|---|---|---|
| Now Ongoing | Oil, Saudi-Houthi and Treasury yield headlines | WTI above $90, Brent near $100-101; the 10-year yield near 5.3% sets the tone for equity valuations | 1 | HIGH |
| Today 16:30 IST / 7:00 AM ET | MBA mortgage applications | Weekly housing-finance gauge; prior reading showed a 30-year mortgage rate of 7.30% | — | LOW |
| Today 19:00 IST / 9:30 AM ET | US cash open | First test of the 51,690 fast moving average; Tuesday’s high was 51,677 | 2 | MEDIUM |
| Today 20:00 IST / 10:30 AM ET | EIA weekly crude inventories | Prior build of 0.922M barrels; oil swings feed straight into yields and inflation expectations | 3 | MEDIUM |
| Today 20:30 IST / 11:00 AM ET | NY Fed consumer inflation expectations | Prior one-year reading 3.6%; higher expectations add to hike fears | 4 | LOW |
| Today 22:30 IST / 1:00 PM ET | $39 billion 10-year note auction | A weak tail lifts yields and pressures equity valuations | 5 | HIGH |
| Today 23:30 IST / 2:00 PM ET | FOMC minutes, 15-16 September | Detail on the first hike in three years, the 3.75%-4.00% range and appetite for another increase | 6 | HIGH |
| Thu 8 Oct 00:30 IST / 3:00 PM ET | US consumer credit (August) | Forecast $14.4B versus $18.06B previous | 7 | LOW |
| Thu 8 Oct 01:30 IST / 4:00 PM ET | Wall Street close | Sets the Wednesday daily candle; closing level versus 51,690 decides the idea | 8 | MEDIUM |
| Thu 8 Oct 07:00 IST / 9:30 AM Beijing | China markets reopen after Golden Week | Asia-Pacific reaction to the minutes and to the move in yields | 9 | MEDIUM |
| Thu 8 Oct 14:00 IST / 4:30 AM ET | Fed Governor Waller speaks | Outside the window by 25 minutes; hawkish comments would extend any move after the minutes | — | MEDIUM |
| Thu 8 Oct 18:00 IST / 8:30 AM ET | US initial jobless claims | Consensus 200,000 versus 197,000 prior; outside the window | — | MEDIUM |
| Thu 8 Oct 23:30 IST / 1:00 PM ET | $22 billion 30-year bond auction | Prior yield 5.31%; outside the window | — | MEDIUM |
| Wed 14 Oct | US CPI inflation | Follows JPMorgan and Citigroup earnings on 13 October; outside the window | — | HIGH |
| Wed 28 Oct | FOMC rate decision | Markets price about an 80% chance of a hold; outside the window | — | HIGH |
The next 24 hours run from 13:35 IST on Wednesday to 13:35 IST on Thursday. Wall Street trades from 19:00 to 01:30 IST, the China market reopens at 07:00 IST on Thursday, and rows without a chart marker fall outside the window and are listed for planning. US clocks go back on 1 November, which moves the US close to 02:30 IST. Times for the EIA report, auction and minutes follow the standard US release schedule; check your own calendar for last-minute changes.
Dow Jones Trade Setup for the Next 24 Hours: Entry, Stop Loss and Take Profit
Dow Jones Industrial Average · 51,526 • SELL THE RALLY — Enter 51,620-51,690, Stop 51,860, Target 51,430-51,000
Dow Jones Industrial Average (TVC:DJI)
Why This Setup, In Brief
The Dow Jones is inside a symmetrical triangle, below its 51,689.67 fast moving average, with an RSI under 50. Selling a rally into 51,620-51,690, where Tuesday’s high and the average meet, keeps the stop at 51,860 above both and puts each target on a chart level: Tuesday’s low, the September lows and the 51,000 round number.
Catalyst Behind the Setup
The 10-year yield near 5.3%, the 10-year auction at 22:30 IST and hawkish minutes at 23:30 IST are the catalysts for lower prices. The setup fails if the minutes sound cautious on rates, the auction is strong and buyers push the Dow Jones through 51,690 and 51,860.
Risk Management
From a 51,655 entry the stop is 205 points (0.40%). TP1 is 225 points (1.1R), TP2 is 505 points (2.5R) and TP3 is 655 points (3.2R). At $1 per point per contract, one contract risks about $205. The order may not fill if the index never rallies, so do not chase a sell below the zone; consider taking partial profit at TP1 and moving the stop to entry.

There are two ways to trade this Dow Jones idea. The patient version sells the 51,620-51,690 rally with a stop at 51,860. The breakdown version waits for a move below Tuesday’s low at 51,428 and targets 51,150 and 51,000, accepting a smaller reward. If the New York session closes above 51,690 at 01:30 IST, the sell idea has failed and 52,096 and 52,650 become the next resistance levels. Thursday’s jobless claims and the 30-year auction fall after the window, so this is a short-term trade, not a view on the full month.
The Small Things Worth Knowing Before You Size This Trade
- The 51,526 price is TradingView’s TVC feed. The official close was 51,521.28, and a CFD or futures contract such as US30 can quote 100 points or more away from the cash index, so adjust the levels to your broker’s price.
- The minutes can gap price. The 23:30 IST release can move the Dow Jones 150 points in minutes and widen spreads, so a stop at 51,860 can slip. Many traders avoid opening new positions for ten minutes either side.
- Points are not dollars. The $1 per point example is only an illustration; contract sizes differ by broker, so check the value of one point before sizing.
- The Dow is price-weighted. A small group of high-priced members can move the index, so a single stock headline can push the Dow Jones away from the S&P 500.
- The chart is log scale and levels are approximate. The 52,650 and 50,660 triangle lines and the 51,150 swing low are read from the chart and can differ slightly between platforms.
- Overnight holding costs. Holding an index CFD past the US close can incur financing charges, and daylight saving changes on 1 November will shift US times by an hour in IST.
FAQ: Dow Jones Market Outlook Today, Explained
Common questions traders ask on 7 October 2026
Conclusion and Outlook for the Next 24 Hours
The Dow Jones trades near 51,526 inside a symmetrical triangle, below its 51,689.67 fast moving average, while the S&P 500 and Nasdaq set record closes. The next 24 hours are shaped by the $39 billion 10-year auction at 22:30 IST, the FOMC minutes at 23:30 IST, oil near $90 WTI and a Treasury yield near 5.3%, with Waller and jobless claims on Thursday just after the window.
This Dow Jones trade idea is to sell a rally into 51,620-51,690, with a stop loss at 51,860 and take profit at 51,430, 51,150 and 51,000. A New York close above 51,690 cancels the idea and turns attention to 52,096 and 52,650, while a break below 51,428 opens the 51,150 and 51,000 targets.
For traders acting on this idea with flexible leverage and fast execution, Capital Street FX offers tools for trading global markets. New traders can open an account in minutes, and existing clients may want to check the current deposit bonus terms before sizing a position.
Open an AccountRelated Research from the CSFX Desk
Looking at single stocks as well? See the companion report, Trade Idea for Salesforce Inc (CRM) Today, for a software stock sitting on a rising trendline under the same 10-year auction and FOMC minutes risk. For commodities, read Trade Idea for Shell Plc.