Market Outlook on Amazon (AMZN) Today: Technical Summary, Fundamental News and a Trade Setup With Entry, Stop Loss and Take Profit | 31-08-2026
Market Outlook on Amazon (AMZN) Today: Technical Summary, Fundamental News and a Trade Setup With Entry, Stop Loss and Take Profit
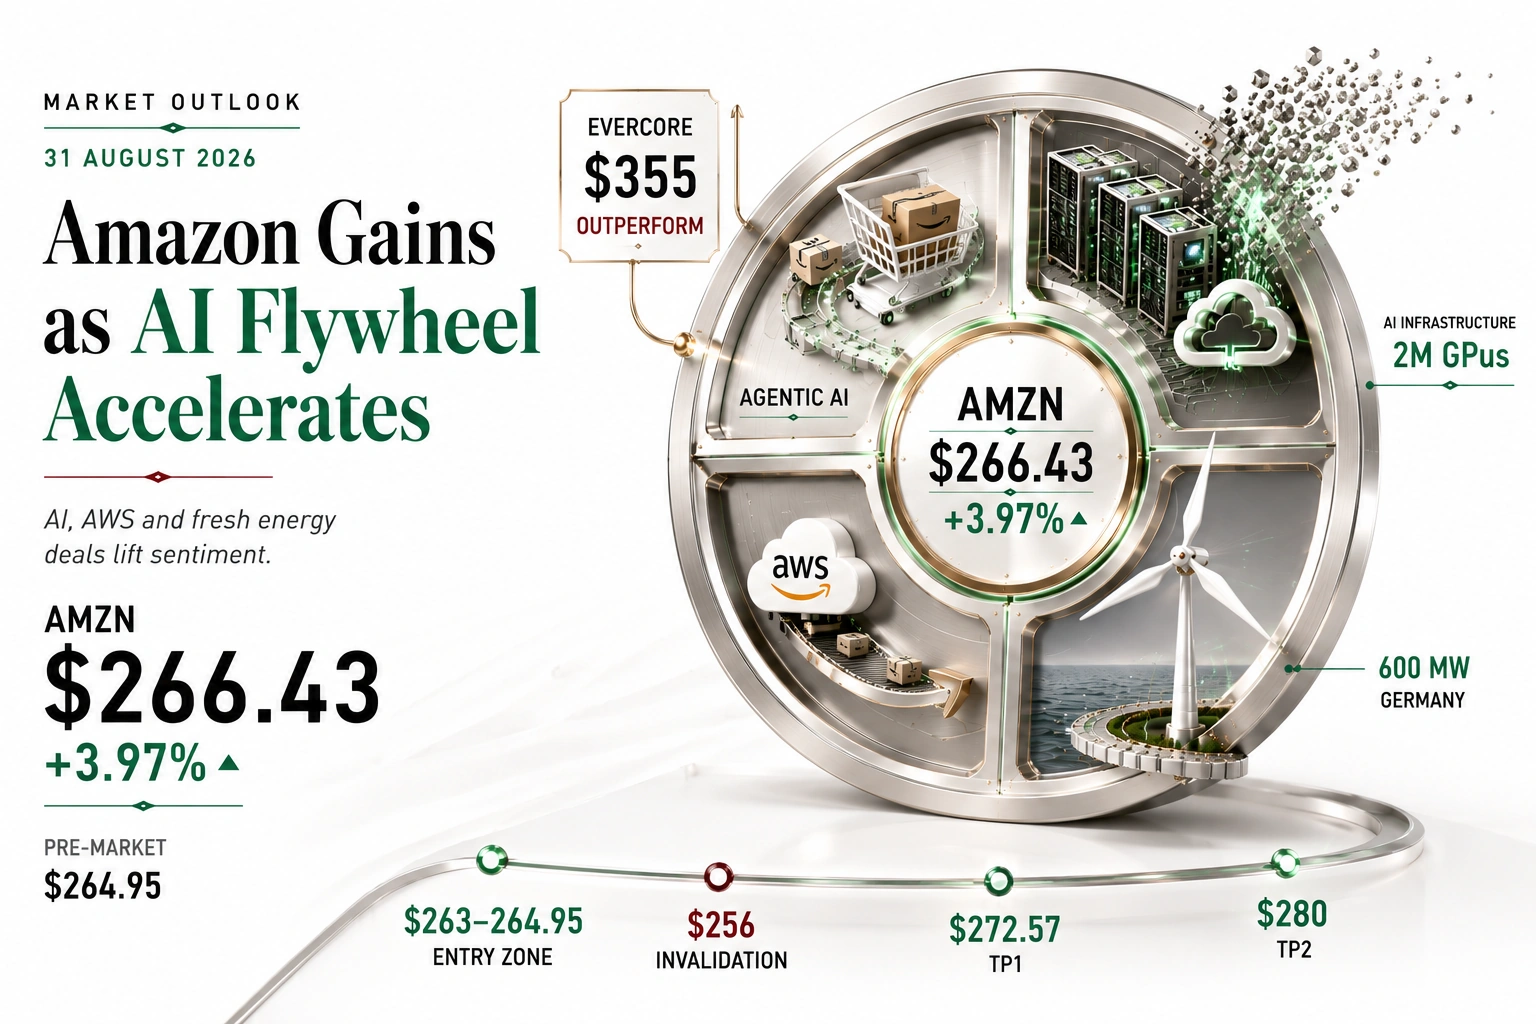
Amazon closed at $266.43, up 3.97 percent, after Evercore ISI’s Mark Mahaney raised his price target to $355 on survey evidence that agentic AI such as Alexa is driving incremental retail purchases, layered onto a fresh wave of renewable-energy power deals.
A same-day market outlook for Amazon covering today’s price action, the fundamental news most likely to move the stock, the event calendar for the next 24 hours — closing with a trade setup that lists entry, stop loss and take profit. Amazon closed Friday’s session at $266.43, up 3.97 percent on the day, after a range of $257.78 to $267.56 on an opening print of $258.32. The stock enters Monday 31 August having extended its rebound from the roughly 9 percent pullback it suffered over the four weeks following its late-July earnings peak near $287.20, with Friday’s advance putting the shares back within reach of that prior high.
Amazon enters the next 24 hours with Evercore ISI’s price-target hike as the dominant catalyst: the firm lifted its 12-month target to $355 from $315 while reiterating an Outperform rating, citing its 14th Annual U.S. Online Retail survey, which found that 57 percent of Alexa AI users bought a product they had not previously known about, that Amazon’s retail penetration stands at 92 percent versus Walmart’s 58 percent, and that regular same-day delivery usage has reached 49 percent, with Prime members using the service spending 3.1 times more than non-Prime shoppers. That backdrop is layered against a fresh set of renewable-energy commitments, including Germany’s largest-ever corporate power purchase agreement, and against AWS’s disclosed plan to deploy 2 million Nvidia GPUs between 2027 and 2028, which is what makes today’s Amazon setup worth tracking with discipline around defined levels as the stock works to reclaim its late-July highs.
Fundamental News Set to Impact the Price Next
The stories driving today’s move and shaping the outlook for the next 24 hours
Technical Summary and Chart Analysis for Today
Daily structure, Fibonacci levels, moving averages and RSI as of 31 August 2026

The Amazon technical summary for today shows a stock rebuilding momentum after a roughly nine percent, four-week pullback from its late-July peak, closing Friday just under its 38.2 percent Fibonacci retracement after one of its stronger single-day gains of the past month. Amazon closed at $266.43, holding a session low of $257.78 and a high of $267.56 on an opening print of $258.32, up 3.97 percent (+$10.17) on the day, with a pre-market indication near $264.95 ahead of Monday’s open.
The Fibonacci grid on the Amazon daily chart is measured from the correction low near $225.08 up to the stock’s late-July high near $287.23. Price closed Friday just above the 38.2 percent retracement at $263.49, having reclaimed the 50 percent level at $256.16 and the 61.8 percent level at $248.82 earlier in the bounce, with the 23.6 percent retracement at $272.57 now the next resistance on the way back toward the $287.23 origin. The 78.6 percent level near $238.88 and the 100 percent level at $225.08 sit well below the market as deeper layers of support, while the 161.8 percent extension at $186.67 remains a distant downside marker from the broader corrective structure.
The moving-average picture is constructive: Amazon trades comfortably above both its short-term moving average near $254.15 and its longer-term moving-average cluster near $251.66, a structure that has held since the stock reclaimed those levels during its bounce off the August low near $228. Momentum has firmed alongside the price recovery: the daily RSI reads 55.85 against a signal line of 53.19, a reading that sits in constructive territory without yet approaching the overbought zone above 70, leaving room for the advance to extend if Monday’s session builds on Friday’s gain.
Amazon Technical Levels at a Glance · Next 24 Hours
- Resistance 1: $267.56 — Friday’s session high
- Resistance 2: $272.57 — the 23.6% Fibonacci retracement
- Resistance 3: $280.00 to $287.23 — round-number zone into the Fibonacci origin / late-July high
- Support 1: $263.49 — the 38.2% Fibonacci retracement
- Support 2: $256.16 — the 50% Fibonacci retracement
- Support 3: $254.15 to $251.66 — the moving-average cluster
- Momentum: RSI 55.85 above its 53.19 signal line, constructive but not yet overbought
Calendar — Events That Can Move Prices in the Next 24 Hours
Key releases and events shaping the outlook over the coming 24 hours
| Date / Time | Event | Detail | Impact |
|---|---|---|---|
| Today US cash session | Monday Full Trading Session, No Holiday Closures | US equity markets trade a full Monday session with Amazon shares digesting Friday’s Evercore price-target hike and the Sweden and Germany PPA announcements as the stock approaches its late-July high | HIGH |
| Tomorrow 10:00am ET / 7:30pm IST | US JOLTS Job Openings (July / August Reference) | Job Openings and Labor Turnover Survey data, a labour-market signal the Federal Reserve tracks closely ahead of its 17 September policy meeting; a softer print would tend to reinforce rate-cut expectations and support high-multiple growth names including Amazon | HIGH |
| Ongoing 24-hour trade | AWS AI Infrastructure and Nvidia GPU Deployment Headlines | Continued analyst and media follow-through on AWS’s disclosed plan to deploy 2 million Nvidia GPUs through 2027-2028 and the raised $220 billion 2026 capex guidance remains a live catalyst for the stock over the next 24 hours | MEDIUM |
| Ongoing 24-hour trade | Mega-Cap and AI-Sector Sentiment Follow-Through | Amazon’s near-term direction remains linked to the broader reaction across AI-linked megacap technology names; a fade in that sentiment, or fresh scrutiny of elevated AI capital spending across the sector, would be the clearest near-term headwind | MEDIUM |
Amazon Trade Setup for the Next 24 Hours: Entry, Stop Loss and Take Profit
AMZN · Amazon.com, Inc. · $266.43 — ▲ CONSTRUCTIVE, ROOM TO RUN — Buy Dips Toward $263.00–264.95 or a Hold Above $267.56, Target the $272.57–287.23 Zone
Amazon · AMZN
Technical Summary (Next 24 Hours)
Amazon closed Friday at $266.43 after a session between $257.78 and $267.56, up 3.97 percent on the Evercore price-target hike and the renewable-energy PPA news, and is indicated near $264.95 ahead of Monday’s open. The RSI at 55.85 sitting above its 53.19 signal line, but still well short of overbought, points to a stock with room to extend Friday’s advance rather than one that is stretched.
Fundamental Driver
Today’s dominant backdrop is Evercore ISI’s price-target hike to $355 on agentic-AI retail survey data, layered onto Germany’s largest-ever corporate renewable power deal, new Sweden PPAs, and AWS’s disclosed plan to deploy 2 million Nvidia GPUs through 2027-2028. Tuesday’s JOLTS job openings report and the broader Federal Reserve rate-path narrative into the 17 September FOMC meeting are the main competing macro risks over the next 24 hours.
Risk Management
Risk on the pullback-buy entry is roughly $7.00 to $9.00 against a $6.00 to $23.00 move to the staged take-profit levels, a risk-to-reward ratio that improves meaningfully from TP1 through TP3. Given that Amazon is still working through resistance left over from its late-July peak, consider staged profit-taking into strength and standard position sizing rather than an oversized bet on a single breakout attempt. The idea is invalidated on a close below $256.00, which would put the stock back beneath the 50 percent Fibonacci retracement and open a path toward the moving-average cluster near $251.66.
There are two valid ways to express this Amazon trade idea into a session where the stock is working to reclaim ground lost during its four-week, late-July pullback. The patient version waits for a pullback into $263.00 to $264.95, where the 38.2 percent Fibonacci retracement and the current pre-market level converge, entering once price shows signs of holding rather than chasing Friday’s strength. The momentum version buys a confirmed hold above $267.56, Friday’s session high, accepting a slightly higher entry level in exchange for confirmation that the rally has genuine follow-through into the new week.
What would make this Amazon trade idea fail? The clearest failure mode is a broad reversal in AI-sector sentiment, a hot JOLTS print on Tuesday that pushes Treasury yields higher and pressures high-multiple technology names, or fresh scrutiny of the pace of AI capital spending across the sector, including Amazon’s own raised $220 billion 2026 capex guidance. If the stock loses $256.00 and the 50 percent Fibonacci retracement gives way on a closing basis, the path opens back toward the moving-average cluster near $251.66 and the 61.8 percent level at $248.82.
FAQ: Today’s Price, Technicals and Trade Setup
Common questions traders ask on 31 August 2026
Conclusion and Outlook for the Next 24 Hours
Amazon closed Friday’s session at $266.43, up 3.97 percent on the day, after a range of $257.78 to $267.56, and is indicated near $264.95 in pre-market trade as markets digest Evercore ISI’s price-target hike to $355. The next 24 hours are dominated by follow-through reaction to the agentic-AI retail survey behind that upgrade, Amazon’s fresh renewable-energy power deals in Germany and Sweden, and AWS’s disclosed 2-million-GPU Nvidia deployment, alongside Tuesday’s US JOLTS job openings report — the stock trades comfortably above its short-term moving average near $254.15 and its longer-term moving-average cluster near $251.66, the RSI at 55.85 sits in constructive territory well short of overbought, and Amazon enters the session testing whether it can reclaim the $272.57 to $287.23 zone that marks its late-July highs. The technical picture supports the same read: a stock rebuilding momentum after a multi-week pullback is being tested against a backdrop of supportive but not yet stretched momentum, which is what makes today’s Amazon setup worth tracking with discipline through a session shaped by AI-infrastructure headlines and incoming labour-market data.
The Amazon trade setup for the next 24 hours is to buy dips into $263.00 to $264.95 or a confirmed hold above $267.56, with a stop loss at $256.00 and take profit staged at $272.57, $280.00 and $287.23. Watch $256.00 as the line that separates continued recovery from a deeper retest of the moving-average cluster near $251.66, and treat a broad reversal in AI-sector sentiment, a hot JOLTS print, or fresh scrutiny of AI capital spending as the developments most capable of changing the picture before this window closes.
This market outlook on Amazon will be updated as new price action and fundamental developments unfold. For traders looking to act on today’s Amazon setup with flexible leverage and fast execution around a high-volatility, news-driven session like this one, Capital Street FX offers the tools to position around fast-moving technology stocks. Traders who are new to the platform can open an account in minutes, and existing clients funding a new position may want to check the current deposit bonus terms before sizing up into this setup.
Open an AccountRelated Research from the CSFX Desk
Trading the AI-driven rally across asset classes? See today’s companion report, Trade Idea for ETHUSD Today: Technical Summary, Fundamental News and a Trade Setup, for the technical levels and catalysts shaping Ethereum in the same 24-hour window.