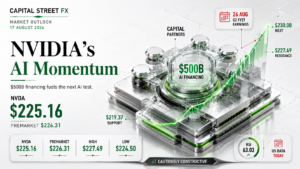
Market Outlook on NVIDIA Corporation Today: Technical Summary, Fundamental News and a Trade Setup With Entry, Stop Loss and Take Profit | 24-08-2026
Market Outlook on NVIDIA Corporation Today: Technical Summary, Fundamental News and a Trade Setup With Entry, Stop Loss and Take Profit
NVIDIA holds near $214.72, down 0.98 percent on the day, as traders de-risk into Wednesday’s fiscal Q2 earnings report and the options market prices in one of the largest single-day swings in the stock’s history.
A same-day market outlook on NVIDIA covering today’s price action, the fundamental news most likely to move the stock, the event calendar for the next 24 hours — closing with a trade setup that lists entry, stop loss and take profit. NVIDIA is trading around $214.72, down 0.98 percent on the day, after a session that ran from $214.50 to $218.74. The stock enters Monday 24 August still holding above its 50-day and 100-day EMA cluster near $206.65 to $207.58, even as it has slipped roughly 4.6 percent over the past week alongside a broader semiconductor pullback tied to rising long-bond yields.
NVIDIA enters the next 24 hours with Wednesday’s fiscal second-quarter earnings report as the dominant catalyst on the calendar, after options pricing implied a move of roughly six to seven percent in the shares, equal to more than $300 billion of market value in either direction. That report lands alongside Tuesday’s Conference Board Consumer Confidence release and a 30-year Treasury yield sitting near its highest level since 2007, both swing factors for long-duration AI infrastructure names heading into the print. Layered against reports of AI server prices rising more than 15 percent on tightening memory supply and a fresh up-to-$7 billion partnership with AI startup Poolside, that combination is what makes today’s NVIDIA outlook worth tracking with discipline around defined levels through what looks set to be a headline-driven run-up to Wednesday’s print.
Fundamental News Set to Impact the Price Next
The stories driving today’s move and shaping the outlook for the next 24 hours
Technical Summary and Chart Analysis for Today
Daily structure, Fibonacci levels, moving averages and RSI as of 24 August 2026

The NVIDIA technical summary for today shows a stock that has pulled back modestly from its May cycle high while still holding the broad rising channel that has defined price action since the April low. NVDA opened at $218.42, held a session low of $214.50, pushed to a high of $218.74, and last traded at $214.72, down 0.98 percent (-$2.13) on the day. That range sits comfortably above the stock’s moving-average support shelf, leaving the market in a consolidation phase rather than confirming any trend break as it heads into Wednesday’s earnings report.
The Fibonacci grid on the NVDA daily chart is measured from the cycle low near $163.96 up to the May high near $236.73. Price has slipped back below the 23.6 percent retracement at $219.55 but remains well above the 38.2 percent level at $208.93, leaving the stock inside the upper half of its multi-month retracement range. A sustained close back above $219.55 would open the path toward the mid-channel zone near $226.00 and, ultimately, the May high at $236.73.
The moving-average picture is still constructive despite today’s dip. NVIDIA trades just below its short-term EMA near $213.18 to $214.89 and comfortably above the 50-day and 100-day EMA cluster near $206.65 to $207.58, a support shelf that has repeatedly held on pullbacks since the spring recovery. Momentum has cooled from its extreme: the daily RSI reads 51.01 against a signal line of 59.08, a neutral reading that shows the sharp upside momentum from earlier in the year has faded without turning outright bearish, consistent with a market pausing to digest risk ahead of a binary event.
NVIDIA Technical Levels at a Glance · Next 24 Hours
- Resistance 1: $219.55 — the 23.6% Fibonacci level
- Resistance 2: $226.00 — the mid-channel zone below the descending trendline
- Resistance 3: $236.73 — the May cycle high and 0% Fibonacci level
- Support 1: $213.18 — the short-term EMA
- Support 2: $206.65–$207.58 — the 50-day/100-day EMA cluster
- Support 3: $200.34 — the 50% Fibonacci retracement
- Momentum: RSI 51.01 below its 59.08 signal line, neutral and cooling from May’s overbought extreme
Calendar — Events That Can Move Prices in the Next 24 Hours
Key releases and events shaping the outlook over the coming 24 hours
| Date / Time | Event | Detail | Impact |
|---|---|---|---|
| Tue Aug 25, 10:00 ET 19:30 IST | US Conference Board Consumer Confidence (August) | Prior reading 100.3; a soft print would revive September rate-cut hopes and could ease pressure on long-duration growth names such as NVIDIA | MEDIUM |
| Ongoing through the session | 30-Year Treasury Yield Near Its Highest Since 2007 | Rising long-bond yields have pressured richly valued AI infrastructure stocks; a further move higher would be a headwind for NVDA into earnings | HIGH |
| Wed Aug 26, after close ~4:20pm ET / 1:50am IST (Thu) | NVIDIA Fiscal Q2 FY2027 Earnings + Call | Options pricing implies a six to seven percent single-day move; consensus revenue near $91.8 billion versus Nvidia’s own $91 billion guidance midpoint | CRITICAL |
| Fri Aug 28, 10:00 ET 19:30 IST | Fed Chair Kevin Warsh’s First Jackson Hole Keynote | Warsh’s inaugural address as Fed Chair, at the Kansas City Fed’s Jackson Hole symposium, is the next major cross-asset catalyst for rates and, in turn, AI equity valuations | MEDIUM |
NVIDIA Trade Setup for the Next 24 Hours: Entry, Stop Loss and Take Profit
NVDA · NVIDIA Corporation · $214.72 — NEUTRAL-TO-CONSTRUCTIVE — Buy Dips Toward $211.50–213.20, Reduce Size Into Wednesday’s Print
NVIDIA Corporation · NVDA
Technical Summary (Next 24 Hours)
NVIDIA is trading around $214.72 after a session between $214.50 and $218.74, holding above its 50-day and 100-day EMA cluster near $206.65 to $207.58 while it slips back below the 23.6 percent Fibonacci level at $219.55. The RSI at 51.01 below its 59.08 signal line confirms momentum has cooled from May’s extreme without breaking down.
Fundamental Driver
Today’s dominant catalyst is positioning ahead of Wednesday’s fiscal Q2 FY2027 earnings report, where options markets imply a six to seven percent single-day move worth more than $300 billion. Reports of AI server prices rising over 15 percent on tight memory supply and a fresh up-to-$7 billion Poolside partnership add to the fundamental picture, while rising 30-year Treasury yields keep pressure on richly valued AI names into the print.
Risk Management
Risk on the pullback-buy entry is roughly $3.00 to $4.70 against a $6.35 to $22.20 move to the staged take-profit levels. Given the scale of Wednesday’s binary earnings event and the options market’s own implied volatility, consider trading a reduced position size and tightening or flattening exposure ahead of the close on Wednesday rather than holding a full position through the print. The idea is invalidated on a daily close below $208.50, which would put the stock back beneath its moving-average cluster and open a path toward $200.34.
There are two valid ways to express this NVIDIA trade idea into a session dominated by pre-earnings positioning. The patient version waits for a pullback into $211.50 to $213.20, the retest of the EMA cluster and the rising trendline from the April low, entering once price shows signs of holding rather than breaking through it. The momentum version buys a confirmed break above $219.55 should broad market risk appetite improve, accepting a higher entry level in exchange for confirmation that renewed strength has genuine follow-through before Wednesday’s print.
What would make this NVIDIA trade setup fail? The clearest failure mode is a further rise in long-bond yields combined with a soft Conference Board Consumer Confidence print on Tuesday that revives “higher for longer” fears and pressures the whole AI trade into the earnings report. If the market loses $208.50 and the 50-day/100-day EMA cluster gives way on a closing basis, the path opens back toward the 50 percent Fibonacci level near $200.34. Wednesday’s earnings report itself remains the single largest source of risk, and traders should size accordingly.
FAQ: Today’s Price, Technicals and Trade Setup
Common questions traders ask on 24 August 2026
Conclusion and Outlook for the Next 24 Hours
NVIDIA is trading around $214.72, down 0.98 percent on the day, after a session that ran from $214.50 to $218.74 and left the market consolidating just under its 23.6 percent Fibonacci level ahead of Wednesday’s headline earnings report. The next 24 hours are dominated by positioning into a Q2 FY2027 print that the options market expects to move the stock by six to seven percent, worth more than $300 billion, alongside Tuesday’s Consumer Confidence data and a 30-year Treasury yield sitting near its highest level since 2007 — the market is holding above its 50-day and 100-day EMA support shelf near $206.65 to $207.58, the RSI at 51.01 sits just below its signal line in cooling-but-not-broken territory, and NVIDIA enters the session digesting reports of rising AI server costs and a fresh multi-billion-dollar AI partnership even as the semiconductor sector nurses a rough week tied to rate pressure. The fundamental backdrop supports the same read: an improving AI infrastructure demand story is being tested against a genuinely binary earnings event, which is what makes today’s NVIDIA outlook worth tracking with discipline through what is likely to be a cautious, headline-driven session ahead of Wednesday’s close.
The NVIDIA trade setup for the next 24 hours is to buy dips into $211.50 to $213.20 or a confirmed break above $219.55, with a stop loss at $208.50 and take profit staged at $219.55, $226.00 and $236.73, sized down ahead of Wednesday’s print. Watch $208.50 as the line that separates continued consolidation from a deeper pullback toward $200.34, and treat any surprise in Tuesday’s Consumer Confidence data, a further leg up in Treasury yields, or fresh earnings-related headlines as the developments most capable of changing the picture before this window closes.
This market outlook on NVIDIA will be updated as new price action and fundamental developments unfold. For traders looking to act on today’s NVIDIA setup with flexible leverage and fast execution around a high-volatility, event-driven session like this one, Capital Street FX offers the tools to position around fast-moving AI and semiconductor names.
Explore Capital Street FX