AMD Stock Trade Setup – May 26, 2026 | Advanced Micro Devices Technical Analysis
Advanced Micro Devices (AMD) Trade Setup & Technical Analysis – May 26, 2026
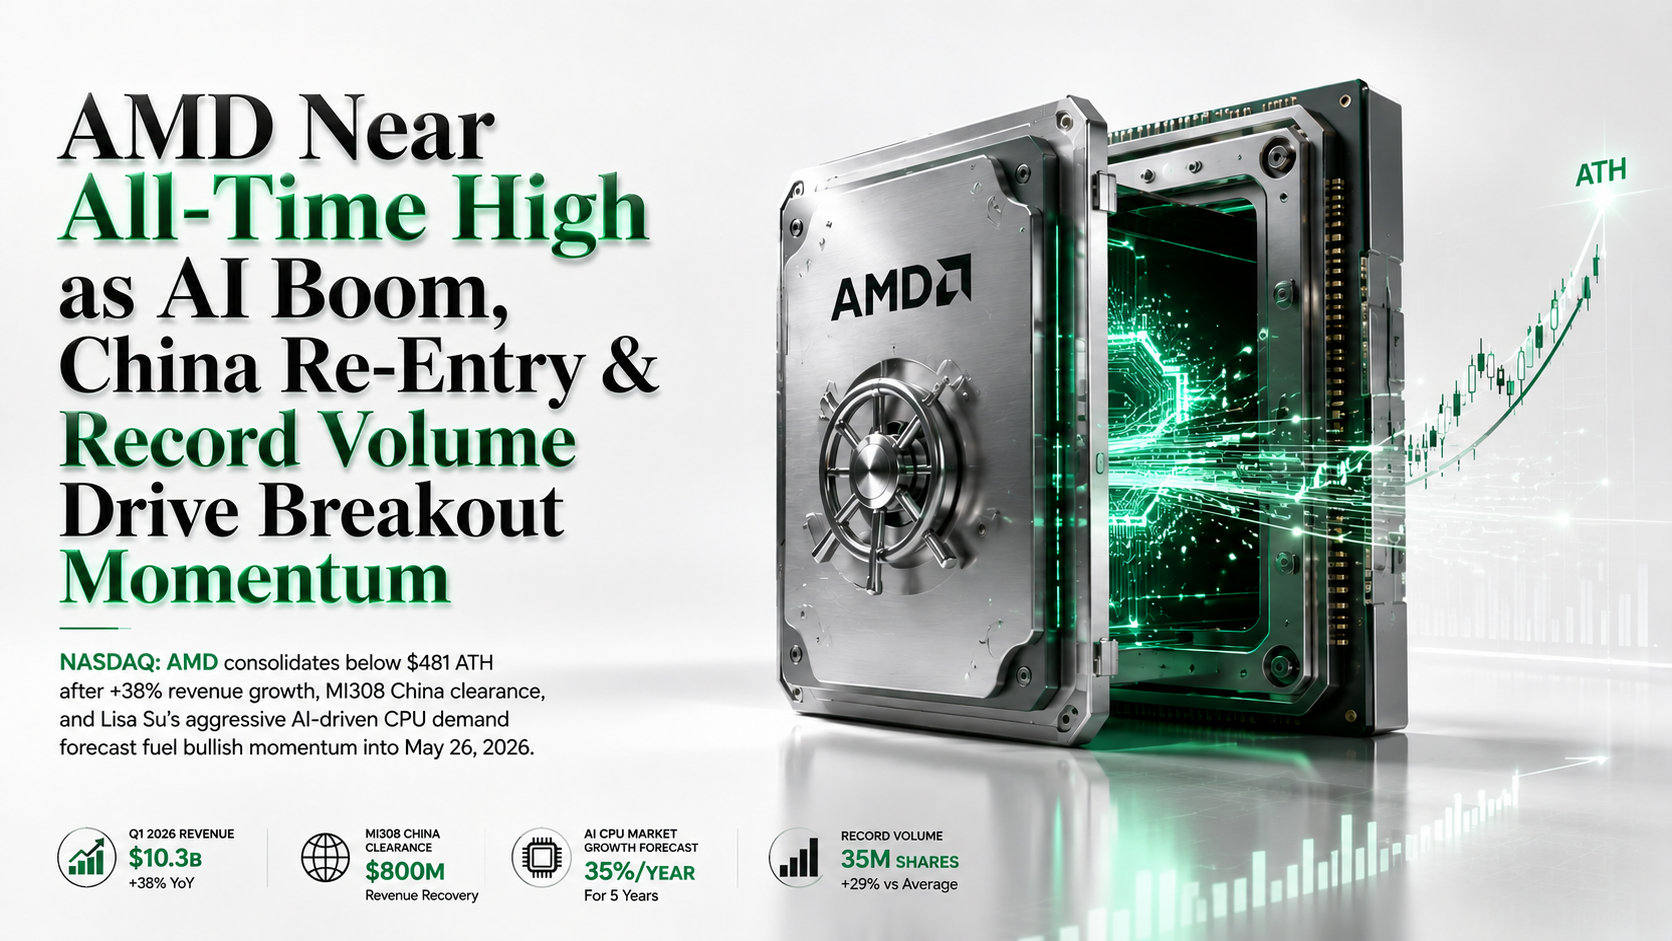
AMD printed its all-time high of $481.41 on May 22, 2026, fueled by Lisa Su’s CPU growth projections, MI308 China clearance, and NVIDIA’s Q1 blowout boosting the entire AI semiconductor complex. Here is a precise trade setup with every technical and fundamental detail you need for today’s session.

AMD has been in a powerful ascending channel since the March low at approximately $188. The stock has gained more than 150% from that low to its May 22 all-time high of $481.41. After three consecutive days of strong gains, price is currently consolidating just below the ATH, which aligns with the Fibonacci 0 projection level at $486.69.
The RSI on the daily chart is elevated near 73, firmly in overbought territory. This does not necessarily signal an immediate reversal in a strong trending stock, but it raises the probability of a short-term consolidation or minor pullback before any continuation higher.
Volume rose on the last day alongside the price (+8M additional shares vs average, totaling 35M shares / ~$16B notional), a strongly bullish confirmation signal. The 3-month MACD carries a sell signal, which is the only notable bearish divergence in an otherwise bullish technical picture.
| Indicator | Value / Reading | Signal | Interpretation (24H) |
|---|---|---|---|
| RSI (14, Daily) | ~73 | Overbought | Extended rally; pullback risk to 50-day MA support (~$406); not a sell signal alone |
| MACD (3-Month) | Sell Signal Active | Caution | Longer-term divergence; use as risk filter, not primary signal |
| Volume (Last Day) | 35M shares (+29% vs avg) | Bullish | Volume expansion confirms trend; institutional participation strong |
| Ascending Channel | Lower: ~$380 / Upper: ~$500 | Intact | Channel intact; price near upper boundary; expect retest of midline ~$440 on dips |
| 50-Day MA | ~$405.90 | Support | Strong dynamic support; first buy-the-dip zone if pullback materializes |
| Fib 0 Target | $486.69 | Target | ATH zone; resistance at $486–$490; break = price discovery, next target $520+ |
| Key Support | $455.19 | Buy Zone | Accumulated volume pivot; expected strong bid on intraday dips here |
| Pivot Support (ATH Retest) | $461–$467 | Consolidation | Current price zone; tight consolidation below ATH is constructive |
MI308 China Export Clearance – US Commerce Dept
AMD received clearance from the US Commerce Department to resume export license review for its MI308 AI processors to China. AMD confirmed it will begin MI308 shipments once regulatory approvals are finalized. The restrictions had cost AMD an estimated $800 million in lost revenue. China accounts for roughly one-quarter of AMD’s annual revenue. Resumption of MI308 sales represents a major revenue recovery catalyst for H2 2026.
Lisa Su: CPU Market to Grow 35% Per Year for 5 Years
AMD CEO Lisa Su stated at AMD’s Taipei forum that CPU demand will grow approximately 35% per year for the next five years, driven by AI infrastructure buildout – a projection that surprised even AMD’s own analysts. Su also confirmed AI demand is “absolutely real” and not a bubble, pushing back against skeptics following the stock’s rapid appreciation.
Q1 2026: Revenue +38% YoY, $10.3B; FCF Triples
AMD’s most recent quarter delivered revenue of $10.3 billion, a 38% year-over-year increase that cleared the company’s own forecast of $9.8 billion. Free cash flow more than tripled year-over-year. Management’s guidance for Q2 was equally impressive, with continued data center segment strength. AMD has more than doubled YTD and nearly quadrupled over the past 12 months.
Nvidia Earnings Tailwind + Memory Supply Constraint
NVIDIA’s strong Q1 2026 earnings boosted confidence across the AI chip sector, lifting AMD to its all-time high on May 22. Bank of America named AMD a “Clear Winner for the Next AI Wave.” However, Lisa Su flagged high-bandwidth memory (HBM) constraints as a potential supply gating factor for AI accelerator shipments in H2 2026 – a risk to monitor for guidance updates.
Primary Setup – ATH Breakout Long
Buy current consolidation zone just below ATH. Best entered on first 30-min candle above $470 with volume confirmation. Do not chase if AMD opens above $480.
Below the $455.19 accumulated volume support and the recent breakout pivot. A daily close below $453 invalidates the bullish thesis short-term.
TP1 at ATH $481.41. TP2 at Fib 0 projection $486.69 / psychological $490. Risk:Reward ≈ 1:2.1 on TP2. Scale out 50% at TP1.
Alternative Setup – Dip to 50-Day MA Support Buy
If AMD sells off sharply (risk-off / negative China headlines), the 50-day MA (~$405.90) provides the key structural buy zone for medium-term investors.
Below 50-DMA and the 0.236 Fib retracement from the entire March-May rally. A break here suggests a deeper correction to the $370 zone.
TP1 at channel midline ~$440. TP2 near ATH zone. Risk:Reward ≈ 1:4+ on TP2 from the 50-DMA entry.
Contrarian Setup – Overbought RSI Fade (Aggressive)
Aggressive fade of the ATH zone ($481.41–$486.69 Fib 0). Only for experienced traders. Requires bearish reversal candle (shooting star / doji) at resistance.
Above the $490 psychological level. A sustained break above $490 on strong volume = trend extension, not reversal.
TP1 at prior consolidation. TP2 at channel midline. Risk:Reward ≈ 1:2.6 on TP2. Low-probability but good R:R if conditions align.
AMD Conclusion – May 26, 2026
Advanced Micro Devices stands at one of the most compelling junctures in its history as of May 26, 2026. The stock is consolidating just below its all-time high of $481.41, driven by three powerful converging tailwinds: Q1 2026 earnings that demolished expectations ($10.3B revenue, +38% YoY), CEO Lisa Su’s credible 35%/year CPU growth projection, and the critical US clearance allowing AMD to resume AI chip shipments to China via the MI308 – potentially recovering $800M in lost revenue.
Technically, AMD is in a confirmed strong uptrend within an ascending channel, trading near the Fibonacci 0 projection at $486.69. The RSI at 73 is elevated, and the 3-month MACD carries a caution signal, but these are insufficient to override the macro fundamental momentum in a stock printing all-time highs on record volume.
The primary trade opportunity today is a breakout long above $470 targeting $481–$490, with a well-defined stop at $453. The key risks are any negative development on China MI308 delivery timelines or a risk-off surge in geopolitical tensions. AMD’s next earnings on August 4, 2026 represents the next major catalyst event. This analysis is for informational purposes only and does not constitute financial or investment advice. All trading involves risk.