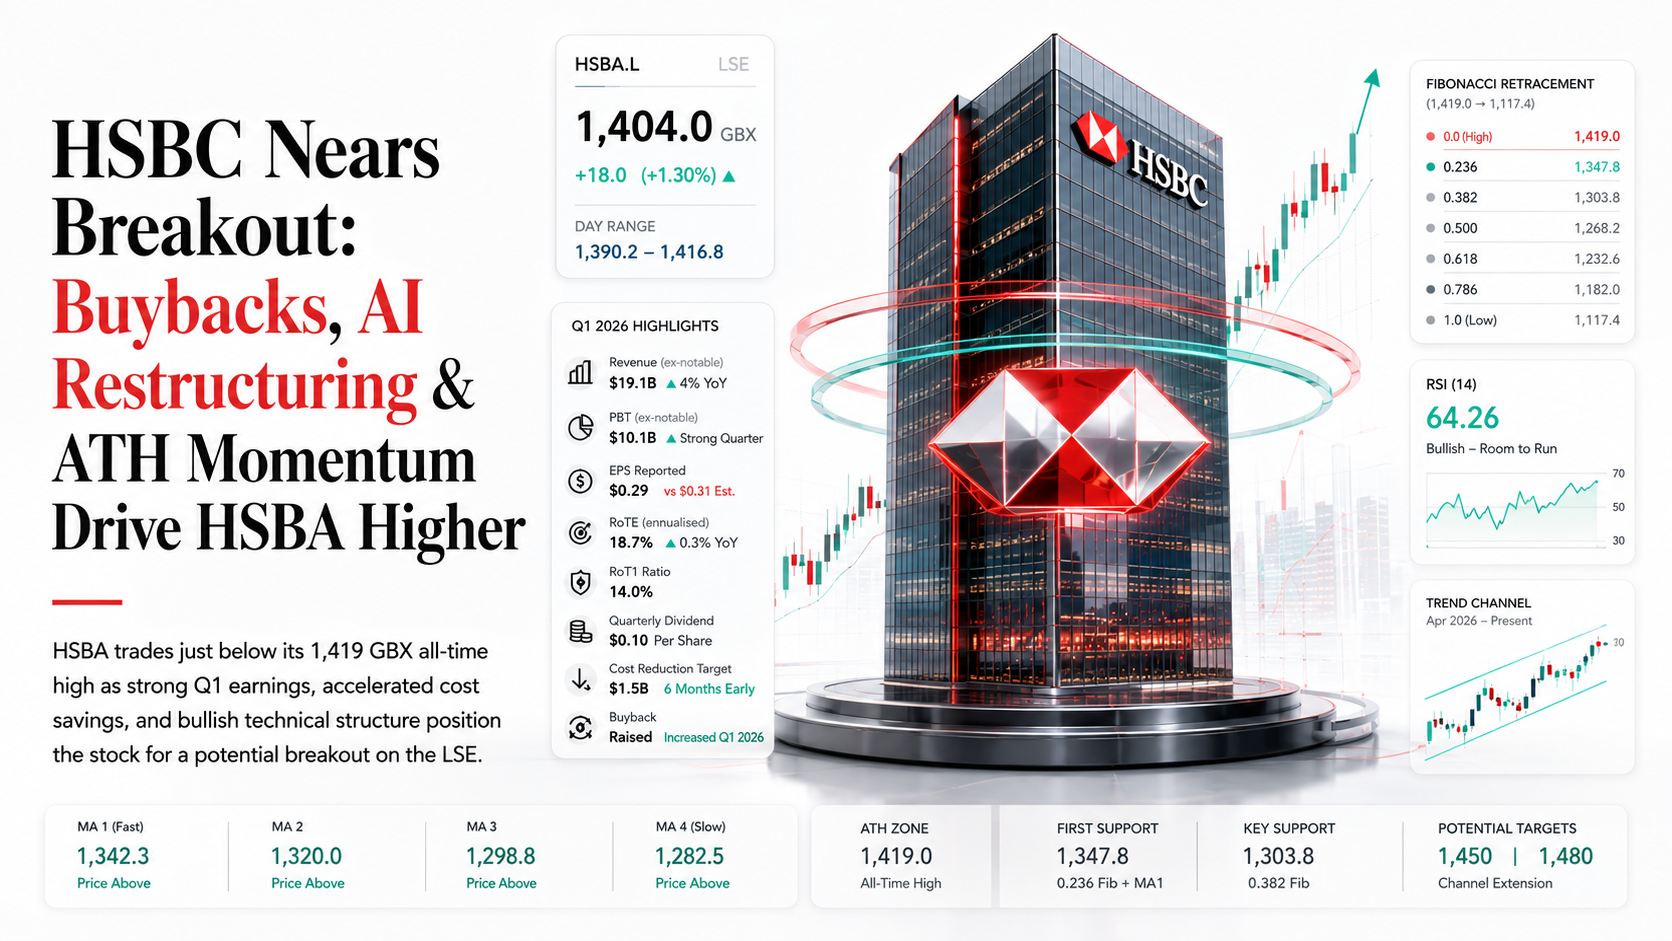
HSBC Holdings (HSBA) Trade Setup — May 28, 2026 | CSFX Research
Trade Setup — HSBC Holdings (HSBA) · May 28, 2026
A complete professional trade setup for HSBC Holdings PLC (HSBA.L) on the London Stock Exchange — covering daily technical analysis, Q1 2026 earnings impact, AI restructuring news, Fibonacci key levels, event calendar, entry, stop loss and take profit.
HSBA Daily Chart — Technical Overview

Q1 2026 Earnings Snapshot
Revenue beat consensus; EPS narrowly missed. Capital returns and simplification plan ahead of schedule.
Technical Summary — Next 24 Hours
| Level | Price (GBX) | Status |
|---|---|---|
| 0.0 (High) ★ | 1,419.0 | Target / ATH Zone |
| 0.236 | 1,347.8 | Support |
| 0.382 | 1,303.8 | Support |
| 0.500 | 1,268.2 | Mid Support |
| 0.618 | 1,232.6 | Strong Support |
| 0.786 | 1,182.0 | Deep Support |
| 1.0 (Low) | 1,117.4 | March 2026 Corrective Low |
HSBC Holdings (HSBA.L) is trading at 1,404 GBX, just 15 GBX below its recent swing high of 1,419 GBX — the 0.0 Fibonacci retracement level from the February peak. The stock has recovered remarkably from its corrective low of 1,117.4 GBX in March 2026, staging a powerful rally of over 25% in approximately two months. This recovery makes HSBA one of the strongest performers on the FTSE 100 over that period.
All four moving averages (1,282.5 → 1,298.8 → 1,320.0 → 1,342.3 GBX) are rising and perfectly stacked below price — a textbook bullish momentum configuration. The ascending channel established from the April 2026 lows remains intact with price comfortably within its upper range. RSI at 64.26 provides room for further upside before reaching overbought territory. Unlike USD/CAD (RSI 69.79), HSBA’s RSI gap from overbought gives the stock more technical headroom for the next 24-hour session.
A breakout above the 1,419 GBX ATH zone opens the path toward 1,450–1,480 GBX (projected channel extension). On the downside, the first major support is at the 0.236 Fibonacci level of 1,347.8 GBX, coinciding closely with the fastest moving average at 1,342.3 GBX — forming a strong confluence support zone.
Fundamental Drivers — Key News Impact
The dominant near-term fundamental driver for HSBA is the ongoing confidence in HSBC’s capital return programme following the raised buyback and ahead-of-schedule $1.5B cost savings delivery. Analyst coverage remains firmly bullish — Traders Union and institutional analysts project HSBA has a greater than 80% probability of a short-term price increase, with a 5-day range of 1,340–1,375 GBX (now exceeded) and bullish breakout above 1,375 GBX confirmed. The market is now watching whether HSBA can close above 1,419 GBX to confirm a new high.
✅ Price action and fundamentals are aligned — bullish setup has high structural conviction.
📅 Event Calendar — HSBA · Next 24 Hours
MAY 28
MAY 28
MAY 28
MAY 29
MAY 29
Trade Setup — HSBA · Next 24 Hours
Triggers on sustained hold above 1,400 GBX with bullish market open. ATH breakout above 1,419 GBX would confirm extended move.
| Parameter | Level (GBX) | Notes |
|---|---|---|
| Entry (Long) | 1,395 – 1,405 | Buy at or near current price; use any minor dip toward 1,395 as entry. Momentum and fundamentals aligned. |
| Stop Loss | 1,370 | Below the ascending channel lower trendline and recent consolidation base. ~30–35 GBX risk (~2.2%). |
| Take Profit 1 | 1,419 | 0.0 Fibonacci / recent ATH zone. First partial close — ~20 GBX reward. Partial exit here. |
| Take Profit 2 | 1,450 | Channel extension target above ATH. ~50 GBX reward. Trail stop to 1,415 on break of 1,419. |
| Take Profit 3 | 1,480 | Full channel extension. Analyst high target zone. R:R ≈ 2.3:1. Leave runner position. |
| Risk:Reward | ≈ 1:1.4 – 1:2.5 | Close 40% at TP1, 40% at TP2, leave 20% runner to TP3. |
Triggers if price pulls back on PCE risk-off or profit-taking from 1,419 ATH. Use for better R:R entry. Requires 0.236 Fib hold confirmation.
| Parameter | Level (GBX) | Notes |
|---|---|---|
| Entry (Long) | 1,345 – 1,360 | 0.236 Fibonacci zone (1,347.8 GBX) confluencing with MA1 at 1,342.3 GBX. Very strong structural support. |
| Stop Loss | 1,315 | Below 0.382 Fibonacci (1,303.8 GBX) zone and all key MAs. ~30–45 GBX risk. |
| Take Profit 1 | 1,419 | 0.0 Fibonacci / ATH zone. ~59–74 GBX reward. R:R ≈ 1.8:1. |
| Take Profit 2 | 1,480 | Channel extension. ~120–135 GBX reward. R:R ≈ 3:1. Excellent entry if pullback occurs. |
| Risk:Reward | ≈ 1:2.0 – 1:3.5 | Superior R:R to Setup A. Patience required for pullback. High conviction if Fib zone holds. |
Frequently Asked Questions — HSBC Holdings (HSBA)
Conclusion
HSBC Holdings (HSBA) — 24-Hour Summary
HSBC Holdings (HSBA.L) presents one of the strongest technical and fundamental alignments on the LSE for the next 24 hours. The stock is trading at 1,404 GBX — just 15 GBX from its recent high of 1,419 GBX — with all four moving averages rising beneath price, RSI at a healthy 64.26 (with room to extend), and an intact ascending channel established from April 2026. The post-earnings trajectory has been powerfully bullish.
Fundamentally, HSBC delivered Q1 2026 revenue of $19.1 billion (+4% YoY), confirmed a raised buyback programme, and is on track to deliver $1.5 billion in annualised cost savings six months early. The bank’s Asia-growth narrative, improving RoTE at 18.7%, and capital return discipline provide strong structural underpinning for the share price. The primary risk over the next 24 hours is China PMI data on Friday — a disappointment there would be the most direct headwind given HSBC’s significant Asian revenue exposure.
The preferred trade approach is to hold or initiate long positions near the 1,395–1,405 GBX zone, targeting 1,419 GBX as an initial take profit, with extension targets at 1,450 and 1,480 GBX. A pullback to the 0.236 Fibonacci / MA1 confluence at 1,342–1,348 GBX, if it occurs, represents an even higher-conviction re-entry opportunity for longer-duration positions.