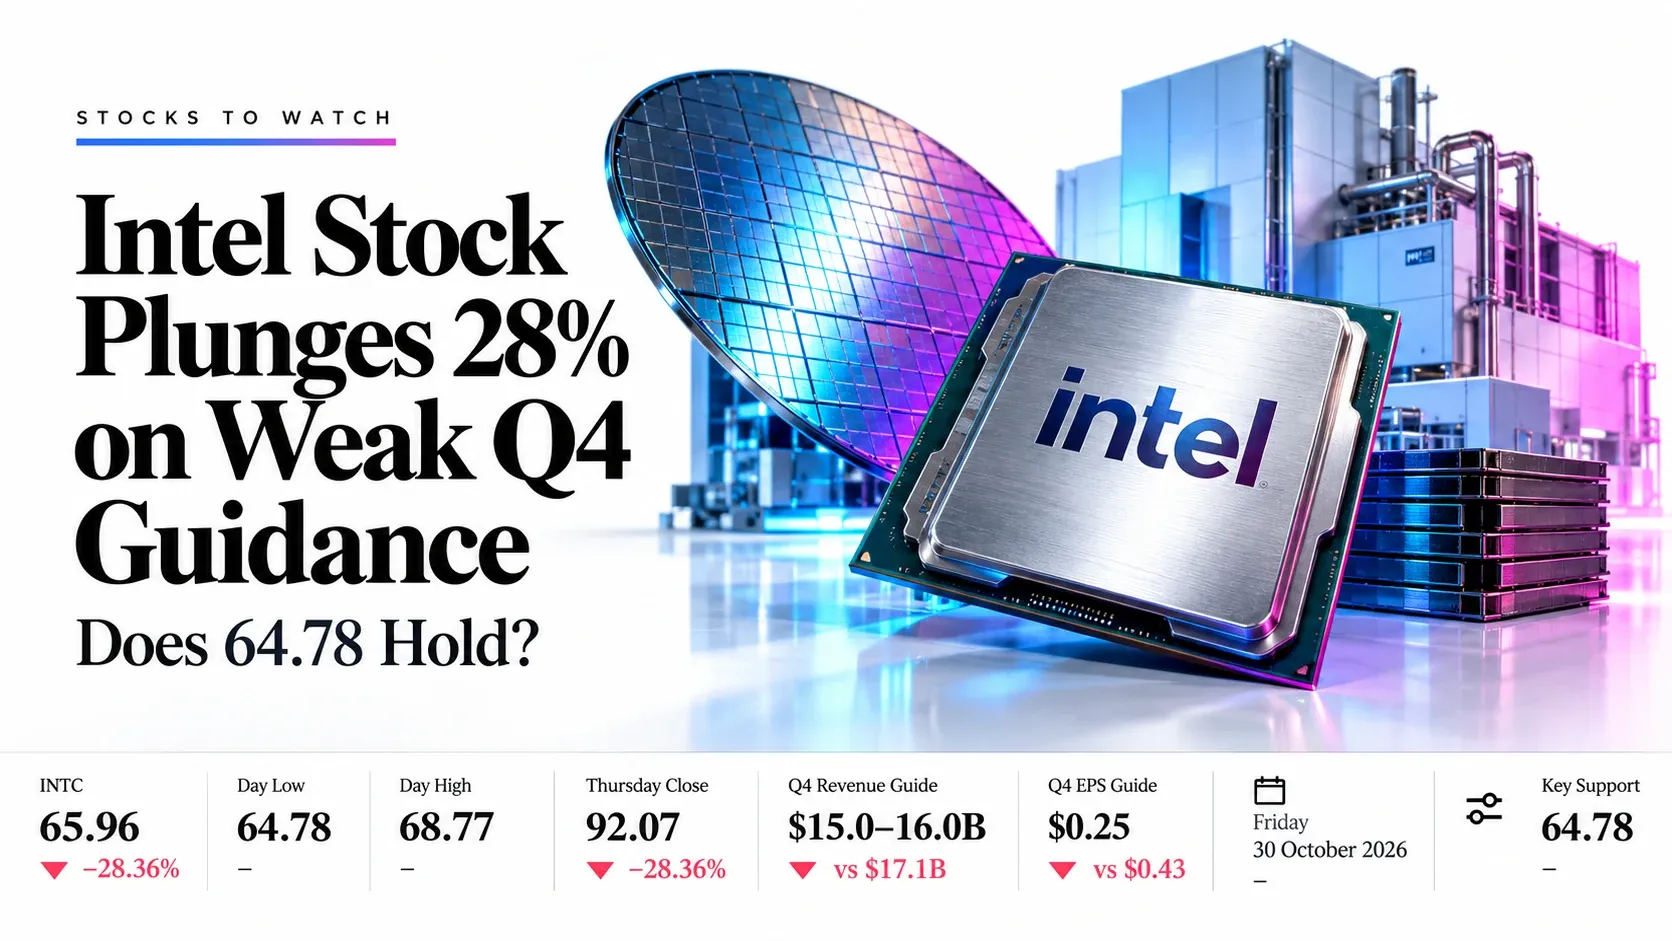
Intel (INTC) Stock Plunges 28% on Weak Q4 Guidance: Does 64.78 Hold? | Trade Idea | 30 Oct 2026
Stocks to Watch Shares, earnings catalyst
Friday 30 October 2026
INTC
Intel Corporation Nasdaq, United States, semiconductors
65.96
−26.11 (−28.36%) at 13:41 GMT, range 64.78–68.77
Thursday close 92.07, results published after the bell
Intel (INTC) Stock Plunges 28% on Weak Q4 Guidance: Does 64.78 Hold?
Desk Summary: Intel Gaps $26 Lower on a Guidance Reset
Intel (INTC) is down 28.36% at 65.96 at 13:41 GMT, a $26.11 gap lower from Thursday’s 92.07 close, after guiding fourth-quarter revenue to $15.0–16.0 billion against about $17.1 billion expected (LSEG, via CNBC) and EPS to $0.25 against $0.43. Traders looked straight past a third-quarter beat and record data centre revenue of $7.3 billion and priced in a PC slowdown that runs into the first half of 2027, plus an Israel fab shutdown that squeezes margins. The stock hangs just above the 64.78 day low with RSI(14) at 25.17, deeply oversold, but 68.77–71.00 now caps any bounce. Our preferred plan is Plan A, a short from 68.77–71.00 with a stop at 72.50. Answer: 64.78 holds for now, but a daily close below 60.00 opens 55.50 and then 49.50.
Key highlights
- Catalyst: Q3 EPS beat ($0.52 vs $0.41) overwhelmed by a Q4 guide of 15.0–16.0bn revenue versus 17.1bn expected
- Damage: Down $26.11 a share; Q4 gross margin guided to 38% from 44.1%; BofA and Roth cut targets and move to Neutral
- Levels: Resistance 68.77–71.00, 83.00–86.00; support 60.00–64.78, 49.50–55.50
- Backdrop: PC slowdown to last through first half of 2027; Israel fab shutdown costs about $300 million a quarter
Intel Trade Setups: Sell 68.77–71.00, Short Below 60.00
Plan A Sell into resistance Short, medium conviction
Entry zone68.77–71.00
- Stop loss
- 72.50
- Target 1
- 64.78
- Target 2
- 60.00
- Reward:risk
- 2.0 and 3.8
Average entry 69.89, risk $2.61 a share. Fades a rebound into the 68.77 day high and 71.00 chart mark, stop above both.
Plan B Short the breakdown Short, on confirmation
TriggerDaily close below 60.00
- Entry
- 59.50
- Stop loss
- 62.00
- Target 1
- 55.50
- Target 2
- 49.50
- Reward:risk
- 1.6 and 4.0
Risk $2.50 a share. A close under the 60.00 floor opens 55.50 and 49.50, the early-April base.
Event risk: A daily close above 71.00 cancels both plans. Monday’s US open at 14:30 GMT can gap through the 60.00 trigger.
Intel Sentiment Heat Map: Mildly Bearish, −4
Data centre growth
Up 78%$7.3 billion, record quarterThird-quarter EPS
$0.52Consensus about $0.41Daily RSI(14)
25.17Oversold, bounce riskIsrael fab shutdown
$300m hitMargin also down 200 basis pointsAnalyst moves
Targets cutBofA, Roth downgrade to NeutralFourth-quarter guidance
EPS $0.25Versus $0.43 consensusClient computing
Down 5%$8.1 billion, missed estimatesDaily trend
Below averagesTriangle support broken in OctoberNet score −4 on a scale of −16 to +16. Each tile scores −2 to +2.
Catalyst File: Beat on Q3, Reset on Q4
| Revenue | $16.51 billion, up 21%; consensus $16.47 billion |
|---|---|
| Non-GAAP EPS | $0.52 against $0.41 consensus; guidance was $0.38 |
| Data centre | $7.3 billion, up about 78%; strongest growth in 15 years |
| Client computing | $8.1 billion, down 5% a year, below estimates |
| Q4 guidance | Revenue $15.0–16.0 billion vs about $17.1 billion; EPS $0.25 vs $0.43 |
| Gross margin | Q3 44.1%; Q4 guided to 38% at the midpoint |
| Israel fab | Fatal explosion; about $600 million revenue lost over two quarters |
Reaction Map: 64.78 Decides the Next Leg
Relief bounce
68.77, then 71.00
Plan A short; stop 72.50
Range holds
64.78, then 68.77
Wait; no edge inside the range
Support breaks
60.00, then 55.50
Plan B short on daily close
INTC Chart: Gap Lower Leaves 64.78 Support Exposed

- Trend: The rising trendline from April broke in October; price at 65.96 is far below 83.00.
- Averages: 20-day near 96.40, 50-day near 101.11; RSI(14) at 25.17, deeply oversold.
- Ceiling: 68.77–71.00 caps the first rebound; 83.00–86.00 is the next band and gap-fill zone.
Intel by the Numbers: Strong Quarter, Weak Guide
- Q3 revenue
- $16.51 billion
- Up 21% a year
- Non-GAAP EPS
- $0.52
- Beat by $0.11
- Data centre revenue
- $7.3 billion
- Up 78% a year
- Q4 revenue guide
- $15.0–16.0 billion
- Street $17.1 billion
- Q4 EPS guide
- $0.25
- Street $0.43
- Q4 gross margin
- 38%
- Q3 was 44.1%
Catalyst Calendar in GMT
30 Oct
US close, first full session after results
2 Nov
US open after the weekend, gap risk
3 Nov
US close, plan validity ends
Intel Company News Behind the Move
Intel beats Q3 estimates but guides Q4 below consensus
Revenue $16.51 billion, EPS 52 cents; fourth-quarter revenue guided to $15.0–16.0 billion against about $17.1 billion expected. CNBC, 29 Oct 2026
Israel fab shutdown to cost about $300 million a quarter
Impact lands in the fourth and first quarters; gross margin pressured by about 200 basis points in Q4. Investing.com, 29 Oct 2026
Analysts cut targets; BofA and Roth downgrade Intel
BofA cuts its target to $100 from $145 and Roth to $70 from $120, both moving to Neutral. Benzinga, 30 Oct 2026
Intel Price Targets: Where the Street Sees the Stock
MarketBeat shows a Hold consensus with an average target of 104.01, 57.7% above the price; the figure does not yet include all of today’s cuts.
Bottom Line
Yes above 64.78, not below 60.00
Intel beat third-quarter estimates but guided fourth-quarter revenue to 15.0–16.0 billion against about 17.1 billion expected, and the shares gapped 28% lower. Plan A sells a rebound into 68.77–71.00 with a stop at 72.50, targeting 64.78 and 60.00. The view turns if Intel closes above 71.00, which opens 83.00, and strengthens on a daily close below 60.00, which opens 55.50.
Trade Intel and 2,000+ instruments with Capital Street FX.
Frequently Asked Questions
Why is Intel stock falling today?
Intel guided fourth-quarter revenue to $15.0–16.0 billion against about $17.1 billion expected, citing a PC slowdown and an Israel fab shutdown, despite beating third-quarter estimates.
What is the Intel trade setup?
Plan A sells 68.77–71.00 with a stop at 72.50 and targets of 64.78 and 60.00. Plan B shorts a daily close below 60.00.
How much did Intel earn in the third quarter of 2026?
Non-GAAP earnings were $0.52 a share on revenue of $16.5 billion, up 21%; earnings attributable to Intel were $0.60 a share.
When does Intel report its next earnings?
The date is unconfirmed. Intel published fourth-quarter 2025 results on 22 January 2026 after the US close, about 21:00 GMT, so late January 2027 is likely.