Nvidia (NVDA) Trade Idea Live: $400 Billion Wiped Out, Bounce Tests 189, and 175.00 Decides the Next Leg | Trade Idea | 06 Nov 2026
Stocks to Watch AI rout, policy and earnings catalysts
Friday 6 November 2026
NVDA
NVIDIA Corporation NASDAQ, United States, semiconductors (prices in US dollars)
188.20
Friday open 191.19, low 187.31; Thursday range 181.46–196.25, Wednesday close 200.13, 52-week range 164.27–243.37, results 17 Nov
Nvidia (NVDA) Trade Idea Live: $400 Billion Wiped Out, Bounce Fades From 191, and 175.00 Decides the Next Leg
Live Overview: $400 Billion Vanished in One Session. Nvidia Is Bouncing but Fading, and 175.00 Is the Line Bulls Cannot Lose
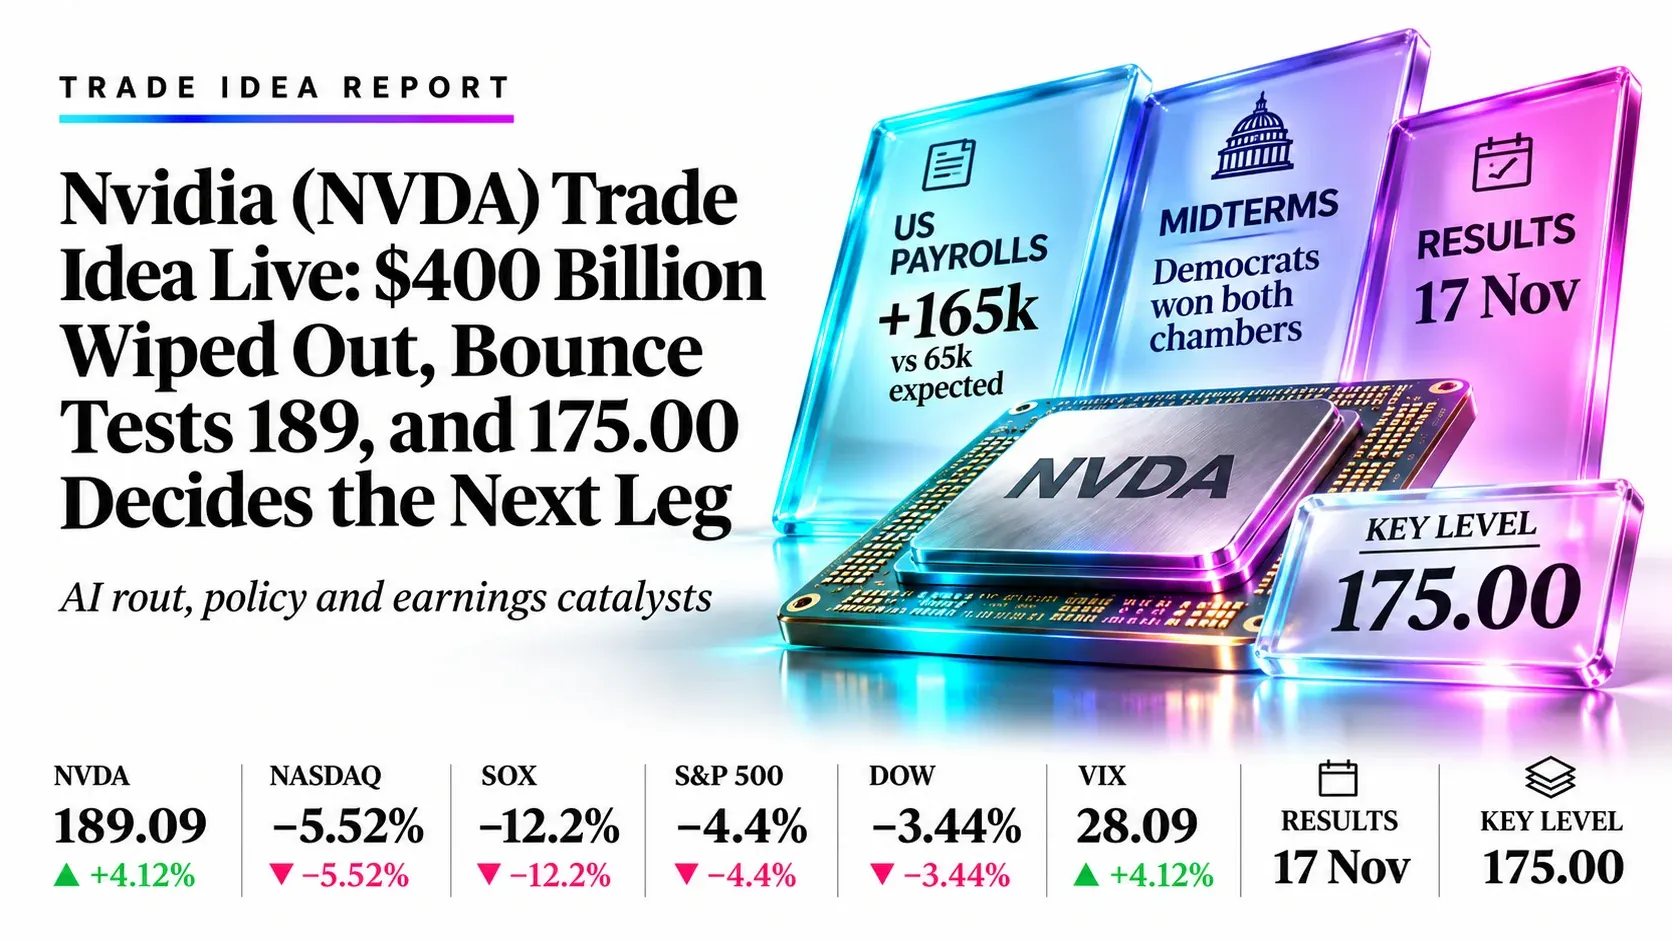
Nvidia is the stock every desk is watching, and today decides whether Thursday’s crash was the low. NVDA fell 9.26% on Thursday to close at 181.60, its lowest in seven months and a wipeout of more than $400 billion, as the Nasdaq Composite fell 5.52% into a correction and the Philadelphia Semiconductor Index dropped 12.2% on fears that a Democratic Congress will slow AI data-center construction. Buyers stepped in at the open: NVDA opened at 191.19, but has since faded to trade near 188 (+3.6%) after US payrolls crushed forecasts, +165,000 jobs against about 65,000 expected with unemployment down to 4.1%. The Nasdaq Composite is up about 1.4% and the semiconductor index is up roughly 4–6% after Thursday’s 12% plunge. The bounce is real but unproven: the stock has given back part of its opening pop. Price still sits below every moving average, RSI(14) reads 25.39, deeply oversold, a hot jobs print keeps Fed rate-hike risk in play, and results follow on 17 November. Our preferred plan is still Plan A, a limit buy at 181.50–184.00 on a retest of Thursday’s low, with a stop at 176.50; today’s low of 187.31 has not reached it, so it remains unfilled. Answer: 175.00 is the line; a daily close below it opens 165.00, while a close above 200.13 would show buyers have taken back Thursday’s gap.
- Live midday
- 188.20, +3.6%
- US payrolls
- +165k vs 65k expected
- Plan A, buy
- 181.50–184.00, stop 176.50
- View fails
- Daily close below 175.00
Live highlights, midday in New York
- Data: US October payrolls rose 165,000 against about 65,000 expected, unemployment fell to 4.1% and September was revised up to 60,000; the strong print keeps a December Fed rate hike in play and the 10-year yield is near 4.85%
- Catalyst: Democrats won both chambers on Tuesday and candidates pledging to curb data centers won in Texas, Ohio, Michigan and Georgia; Yardeni Research called Thursday’s selloff overdone and a buying opportunity, and Texas governor-elect Gina Hinojosa said already-permitted projects can finish construction
- Fundamentals: Nvidia’s own numbers have not changed; it trades near 20 times fiscal 2027 and 11.5 times fiscal 2028 earnings, and the 58-analyst consensus target is 327.14, about 80% above the close
- Levels: Resistance sits at 191.19 (today’s open), 196.25 (Thursday’s high) and 200.13; support sits at 187.31 (today’s low), 181.46, 175.00 and 164.27–165.00
- Backdrop: Thursday’s selloff erased about $2.3 trillion in market value; today the S&P 500 is up about 0.7%, the Dow is flat, the VIX has dropped about 14% to 24.35, and the Nasdaq is still heading for a fourth weekly fall
NVDA Trade Setups: Buy 181.50–184.00, Short Below 175.00
Plan A Buy the retest of Thursday’s low Long, medium conviction
Entry zone181.50–184.00
- Stop loss
- 176.50
- Target 1
- 196.25
- Target 2
- 200.13
- Reward:risk
- 2.2 and 2.8
Average entry 182.75, risk 6.25 a share. A limit order that only fills if today’s bounce fades further and price retests Thursday’s 181.46 low (today’s low so far is 187.31, so it has not triggered); the stop sits below it and above 175.00. Target 1 is Thursday’s high and the gap-down zone; target 2 is Wednesday’s close.
Plan B Short the failed floor Short, on confirmation
TriggerDaily close below 175.00
- Entry
- 174.00
- Stop loss
- 181.00
- Target 1
- 165.00
- Target 2
- 160.00
- Reward:risk
- 1.3 and 2.0
Risk 7.00 a share. A close under 175.00 breaks the support that technical desks link to a further 10–12% fall; 165.00 sits at the April low (164.27) and 160.00 is the lower end of that zone.
Event risk: US payrolls printed at +165,000 this morning against about 65,000 expected, and a strong number keeps a December rate hike in play, which can hold yields and chip volatility elevated. NVDA has a beta near 2.2 and had a 14.79-point range on Thursday alone. Policy headlines on data centers, or any customer pulling back, can gap the stock through stops. Results on 17 November are a binary event; positions held through them carry gap risk. After a 12% sector crash, a bounce is normal; do not chase above 196.25.
NVDA Sentiment Heat Map: Mixed, 0
Daily trend
Channel brokenRising channel from July lost in mid-October; price under all averagesDemand
Orders > supplyBulls say chips remain sold out; EPS revisions risingPolicy
Data-center riskCalls for moratoria after the Democratic sweepValuation
11.5x FY28About 20x FY27 earnings; compressed vs growthDaily RSI(14)
25.39Thursday close; oversold, below signal 39.39Sector flow
SOX +4–6%Rebound after −12.2%, worst day since 2020Analyst view
Strong BuyTarget 327.14, but set before the midtermsMacro
Rate-hike riskPayrolls +165k; VIX 24.35, 10-year 4.85%Net score 0 on a scale of −16 to +16. Each tile scores −2 to +2.
Catalyst File: What Moves NVDA This Week
| Policy | Democrats won the House and Senate; Senator Bernie Sanders called for a national data-center moratorium and Texas governor-elect Gina Hinojosa said the state must pause projects until residents are protected; rising electricity costs made data centers a campaign issue (Reuters, Bloomberg, CNBC) |
|---|---|
| Sector | Friday midday: Nasdaq about +1.4% (near 24,650), S&P 500 +0.7%, SOX +4–6%, AMD +8–9%, Intel +6%, Micron +5–9%. Thursday: Nasdaq −5.52% to 24,315, its worst day in 19 months; SOX −12.2%; AMD −17.26%, Micron −17.46%, Broadcom −10.43%, Intel −10.33%; Qualcomm −9.5% on a weak smartphone outlook; Arm sharply lower on its own guidance |
| Customers | Bloomberg reported Microsoft has tightened oversight of some neocloud data-center projects; CoreWeave, Nebius and IREN fell 9–17%; a Reuters report on stranded H200 chips earlier revived China worries |
| Positioning | Yardeni Research called the selloff overdone and a buying opportunity, noting Goldman estimates about 45% of planned US data-center capacity faces possible restrictions; Nomura’s Charlie McElligott saw hedge funds locking in year-end profits; Jefferies called the move reactionary rather than a fundamental reset; Argent’s Jed Ellerbroek called it capitulation for data-center beneficiaries |
| Data | US October payrolls +165,000 vs about 65,000 expected, unemployment 4.1%, September revised to 60,000; the print keeps a December Fed hike in play (Yahoo Finance); US CPI on 10 November |
| Next results | Nvidia reports on 17 November 2026; investors will watch fiscal 2028 guidance and any sign customers are delaying projects |
Reaction Map: 175.00 Decides the Next Leg
Policy fears cool and the Nasdaq holds gains despite the hot jobs print
191.19, then 196.25 and 200.13
No chase; Plan A buys dips only
Choppy, muted reaction
181.46 to 191.19
Wait; no edge mid-range
Rate-hike fears, new policy or customer-cut headlines
175.00, then 165.00
Plan B short on daily close
NVDA Chart: Channel Broken, 175.00 Is the Last Support Before April

- Trend: Price rose in a channel from the late-July low near 189 to the early-October record, then broke the lower rail near 225 in mid-October and has fallen five weeks in a row, about 24% from the 6 October record close. Thursday’s candle closed near its low; today’s bounce has so far faded from the open.
- Averages: Three averages sit overhead at 213.68, 214.20 and 220.64 on the desk chart, and the 200-day near 204.48 is also above price. RSI(14) is 25.39, well under its signal line at 39.39.
- Ceiling and floor: Resistance sits at 191.19 (today’s open), 196.25, 200.13 and 204.48. Support sits at 187.31 (today’s low), 181.46, 175.00, then the April low at 164.27. NVDA is now back in positive territory for the year.
NVDA by the Numbers: Cheap on Earnings, Brutal on Price
- Forward P/E
- 20x / 11.5x
- Fiscal 2027 and 2028 estimates
- Consensus target
- $327.14
- +74% vs live price; 58 analysts
- Buy ratings
- 59 of 62
- 2 Hold, 1 Sell
- Thursday move
- −9.26%
- 200.13 to 181.60
- Value lost in a day
- $400bn+
- Worst day since early 2025
- From record close
- −24%
- Five straight weekly losses
Catalyst Calendar in GMT
5 Nov
Nasdaq enters correction, NVDA −9.26%, SOX −12.2%
6 Nov
US October jobs report released: +165,000 vs about 65,000 expected, unemployment 4.1%; chips rebound, NVDA about +3.6% at midday
10 Nov
US October CPI
17 Nov
Nvidia quarterly results and guidance, the key test for the AI trade
9 Dec
Fed decision and projections
NVDA News Behind the Move
Chips rebound after worst selloff since 2020; Nvidia up about 4% at midday
The Nasdaq rose about 1.4% and the semiconductor index 4–6% as AMD, Intel and Micron led the bounce; Yardeni called Thursday’s move overdone, while the strong jobs report kept a December Fed hike in play. Reuters and Yahoo Finance, 6 Nov 2026
Nasdaq posts its biggest drop in 19 months; Nvidia sinks 9.26%
The index confirmed a correction and about $3 trillion left S&P 500 value, with chipmakers hit hardest on AI-regulation fears. Reuters, 5 Nov 2026
Chips selloff worsens as AI-trade fears grip the market
Bloomberg said the SOX was on pace for its fifth straight weekly drop, its longest streak since April 2025. Bloomberg, 5 Nov 2026
Democrats win Congress; data centers become a political target
Opposition to new projects, driven by power costs, helped swing races in key data-center states. Reuters and CNBC, 4–5 Nov 2026
NVDA Price Targets: Street Sits Far Above Price
Investing.com’s consensus of 58 analysts averages 327.14, about 80% above Thursday’s close and about 74% above the live price, with targets from 180 to 515 and a Strong Buy rating. Recent moves: Needham, Goldman Sachs and UBS 300, Cantor Fitzgerald 350; Melius cut to 315 from 420 on 2 November. Most targets predate the midterm selloff and may be cut before 17 November.
Bottom Line
Buy 181.50–184.00, short below 175.00
Nvidia has fallen on policy and positioning, not on its own numbers, and trades oversold near the lows of a broken channel with results on 17 November ahead. Plan A is a limit buy at 181.50–184.00 with a stop at 176.50, targeting 196.25 and 200.13, and only fills if today’s bounce fades further; it has not filled yet. The view turns if NVDA closes below 175.00, which opens 165.00 and 160.00; a daily close above 200.13 shifts the focus to the 204.48 average and the 213–221 cluster.
Trade Nvidia and 2,000+ instruments with Capital Street FX.
Frequently Asked Questions
Why is Nvidia stock in focus today?
NVDA fell 9.26% to 181.60 on Thursday as the Nasdaq entered a correction on fears that a Democratic Congress will slow AI data-center buildout; it trades near 188 at midday on Friday after payrolls beat at +165,000, having faded from a 191.19 open, and results follow on 17 November.
What is the Nvidia trade idea?
Plan A buys 181.50–184.00 with a stop at 176.50 and targets of 196.25 and 200.13. Plan B shorts a daily close below 175.00 toward 165.00 and 160.00.
What are the key Nvidia support and resistance levels?
Support is 187.31 (today’s low), 181.46, 175.00 and the April low at 164.27. Resistance is 191.19, 196.25, 200.13 and the 200-day average near 204.48.
What is the Nvidia analyst price target?
The Investing.com consensus averages 327.14 from 58 analysts, about 80% above the close, with targets from 180 to 515.
When does Nvidia report next?
Nvidia is scheduled to report on 17 November 2026, after the US close.